Pay Versus Performance
In accordance with rules adopted by the SEC pursuant to the Dodd-Frank Act, we are providing the following disclosure regarding the relationship between executive compensation and certain financial performance measures of the Company. As we are permitted to report as a “smaller reporting company” as defined under the U.S. federal securities laws, we have not included a tabular list of financial performance measures, and the table below does not include a column for a “Company — Selected Measure” as defined in Item 402(v) of Regulation S-K.
Pay Versus Performance Table
The following table shows the past three fiscal years’ total compensation for our named executive officers as set forth in the Summary Compensation Table, the compensation actually paid to our named executive officers (as determined under SEC rules, “Compensation Actually Paid”), our total shareholder return (“TSR”) and our net income.
SEC rules require certain adjustments be made to the Summary Compensation Table totals to determine Compensation Actually Paid as reported in the Pay Versus Performance Table. Compensation Actually Paid does not necessarily represent compensation actually earned, realized or received by the applicable named executive officer, but rather is a valuation calculated under applicable SEC rules by adjusting the Summary Compensation Table totals for the applicable year as described in the footnotes to the Pay Versus Performance Table.
| Year | Summary | Compensation | Average | Average | Value of | Net | |||||||
| 2025 | 2,655,774 | 2,309,996 | 1,382,378 | 1,406,824 | 198.88 | (57.4 | ) | ||||||
| 2024 | 1,791,843 | 4,386,910 | 1,106,334 | 1,636,421 | 197.01 | (44.6 | ) | ||||||
| 2023 | 1,906,132 | 1,272,679 | 1,241,689 | 958,775 | 69.96 | (40.4 | ) | ||||||
____________
(1) Mr. Shefferman was our principal executive officer (“PEO”) for each of the years reported.
(2) Compensation Actually Paid to our PEO was calculated in accordance with Item 402(v) of Regulation S-K by deducting and adding from the Summary Compensation Table totals as shown below. In calculating the Compensation Actually Paid amounts reflected in this column, the fair value or change in fair value, as applicable, of the equity award adjustments included in such calculations was computed in accordance with FASB ASC Topic 718. The valuation assumptions used to calculate such fair values did not materially differ from those disclosed at the time of grant.
| Year | Equity Award Adjustments | ||||||||||||||||||||
| Reported | Less: | Plus: Year | Plus: Year | Plus: Fair | Plus: Year | Less: Year End | Plus: Value of | Compensation | |||||||||||||
| 2025 | 2,655,774 | (1,571,666 | ) | 1,792,785 | (99,525 | ) |
| (467,372 | ) |
|
| 2,309,996 | |||||||||
| 2024 | 1,791,843 | (655,294 | ) | 1,974,355 | 835,949 |
|
| 440,057 |
|
|
| 4,386,910 | |||||||||
| 2023 | 1,906,132 | (891,050 | ) | 515,157 | (186,258 | ) |
| (71,302 | ) |
|
| 1,272,679 | |||||||||
(a) The grant date fair value of equity awards represents the total of the amounts reported in the “Stock Awards” and “Option Awards” columns in the Summary Compensation Table for the applicable year.
(3) The Non-PEO NEOs, for each year reported were as follows:
2025: Leonardo Nicacio, M.D. and Jacqueline Zummo, Ph.D.
2024: Patrick Fabbio, Jacqueline Zummo, Ph.D. and Jathin Bandari, M.D.
2023: Patrick Fabbio and Jacqueline Zummo, Ph.D.
Compensation Actually Paid to our Non-PEO NEOs was calculated in accordance with Item 402(v) of Regulation S-K by deducting and adding from the Summary Compensation Table totals as shown below. In calculating the Compensation Actually Paid amounts reflected in this column, the fair value or change in fair value, as applicable, of the equity award adjustments included in such calculations was computed in accordance with FASB ASC Topic 718. The valuation assumptions used to calculate such fair values did not materially differ from those disclosed at the time of grant.
| Year | Equity Award Adjustments | |||||||||||||||||||||
| Average | Less: | Plus: Year | Plus: Year | Plus: Fair | Plus: Year | Less: Year End | Plus: Value of | Average | ||||||||||||||
| 2025 | 1,382,378 | (627,382 | ) | 758,330 | (19,096 | ) |
| (87,406 | ) |
|
|
| 1,406,824 | |||||||||
| 2024 | 1,106,334 | (248,480 | ) | 495,297 | 261,916 |
| 8,494 | 170,694 |
| (157,834 | ) |
| 1,636,421 | |||||||||
| 2023 | 1,241,689 | (546,300 | ) | 302,879 | (32,834 | ) |
| (6,659 | ) |
|
|
| 958,775 | |||||||||
(a) The grant date fair value of equity awards represents the total of the amounts reported in the “Stock Awards” and “Option Awards” columns in the Summary Compensation Table for the applicable year.
(4) The values disclosed in this TSR column represent the value at year-end, for each noted year, of an initial fixed investment of $100 made on December 31, 2022.
(5) The dollar amounts reported represent the amount of net income (loss) reflected in our audited consolidated financial statements included in the Annual Report for the applicable year.
| Year | Equity Award Adjustments | ||||||||||||||||||||
| Reported | Less: | Plus: Year | Plus: Year | Plus: Fair | Plus: Year | Less: Year End | Plus: Value of | Compensation | |||||||||||||
| 2025 | 2,655,774 | (1,571,666 | ) | 1,792,785 | (99,525 | ) |
| (467,372 | ) |
|
| 2,309,996 | |||||||||
| 2024 | 1,791,843 | (655,294 | ) | 1,974,355 | 835,949 |
|
| 440,057 |
|
|
| 4,386,910 | |||||||||
| 2023 | 1,906,132 | (891,050 | ) | 515,157 | (186,258 | ) |
| (71,302 | ) |
|
| 1,272,679 | |||||||||
(a) The grant date fair value of equity awards represents the total of the amounts reported in the “Stock Awards” and “Option Awards” columns in the Summary Compensation Table for the applicable year.
2025: Leonardo Nicacio, M.D. and Jacqueline Zummo, Ph.D.
2024: Patrick Fabbio, Jacqueline Zummo, Ph.D. and Jathin Bandari, M.D.
2023: Patrick Fabbio and Jacqueline Zummo, Ph.D.
Compensation Actually Paid to our Non-PEO NEOs was calculated in accordance with Item 402(v) of Regulation S-K by deducting and adding from the Summary Compensation Table totals as shown below. In calculating the Compensation Actually Paid amounts reflected in this column, the fair value or change in fair value, as applicable, of the equity award adjustments included in such calculations was computed in accordance with FASB ASC Topic 718. The valuation assumptions used to calculate such fair values did not materially differ from those disclosed at the time of grant.
| Year | Equity Award Adjustments | |||||||||||||||||||||
| Average | Less: | Plus: Year | Plus: Year | Plus: Fair | Plus: Year | Less: Year End | Plus: Value of | Average | ||||||||||||||
| 2025 | 1,382,378 | (627,382 | ) | 758,330 | (19,096 | ) |
| (87,406 | ) |
|
|
| 1,406,824 | |||||||||
| 2024 | 1,106,334 | (248,480 | ) | 495,297 | 261,916 |
| 8,494 | 170,694 |
| (157,834 | ) |
| 1,636,421 | |||||||||
| 2023 | 1,241,689 | (546,300 | ) | 302,879 | (32,834 | ) |
| (6,659 | ) |
|
|
| 958,775 | |||||||||
(a) The grant date fair value of equity awards represents the total of the amounts reported in the “Stock Awards” and “Option Awards” columns in the Summary Compensation Table for the applicable year.
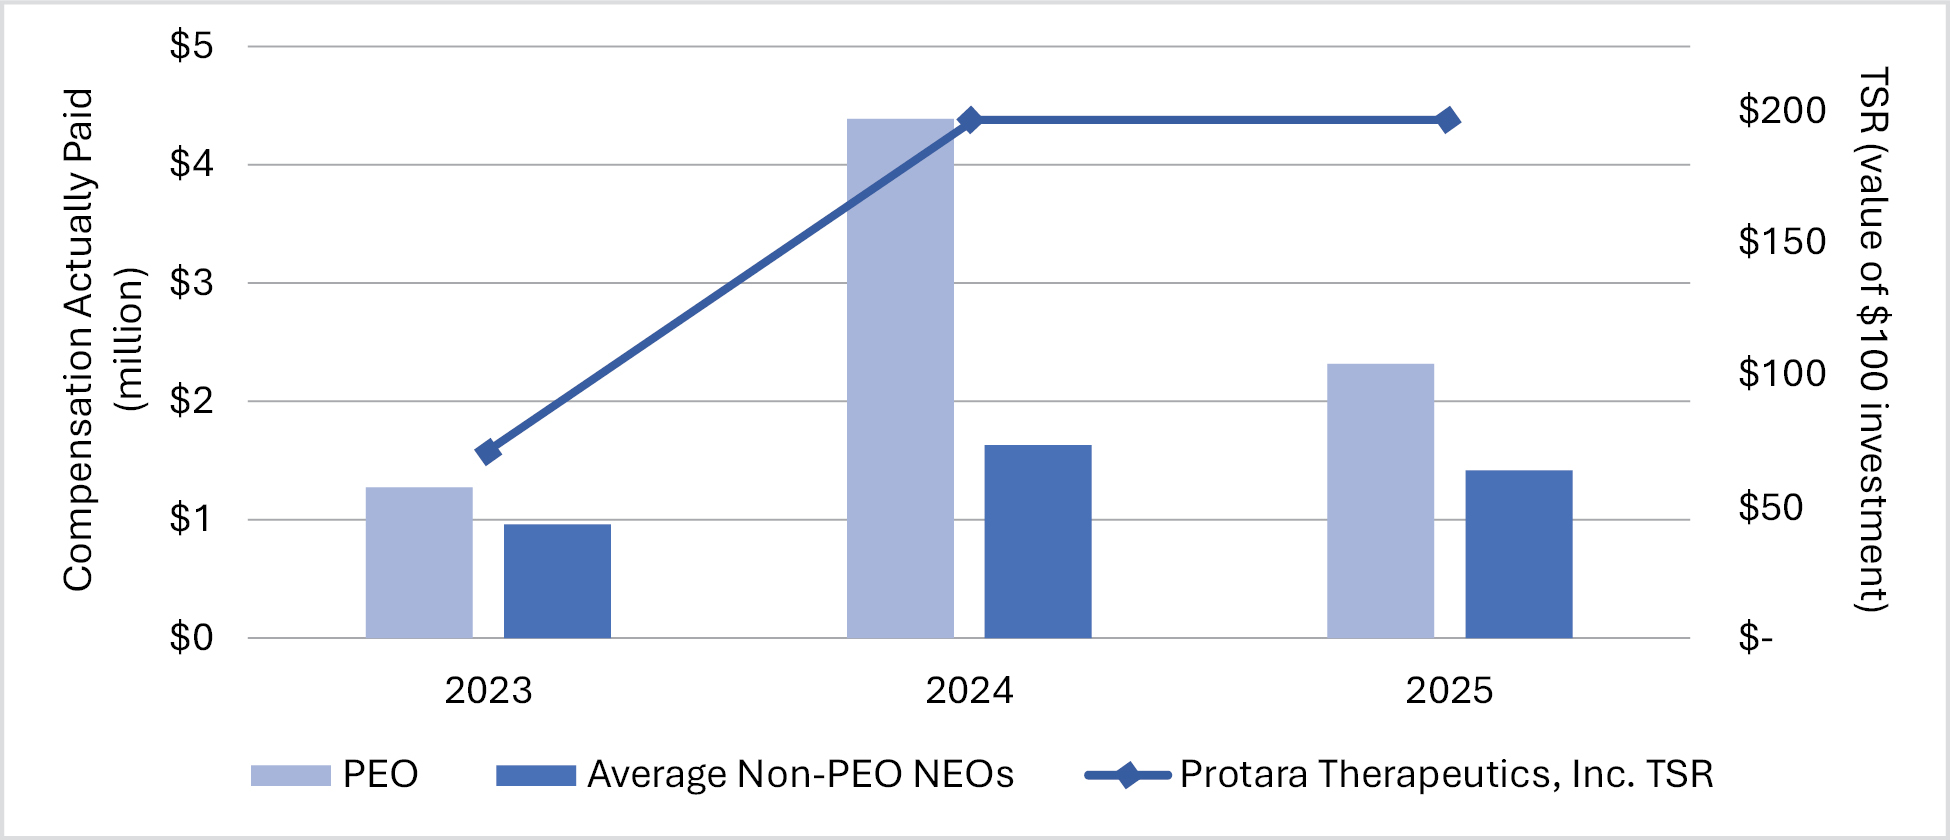
Relationship Between Compensation Actually Paid and Company TSR
The following chart sets forth the relationship between Compensation Actually Paid to our PEO, the average of Compensation Actually Paid to our non-PEO NEOs, and the Company’s TSR over the three most recently completed fiscal years.
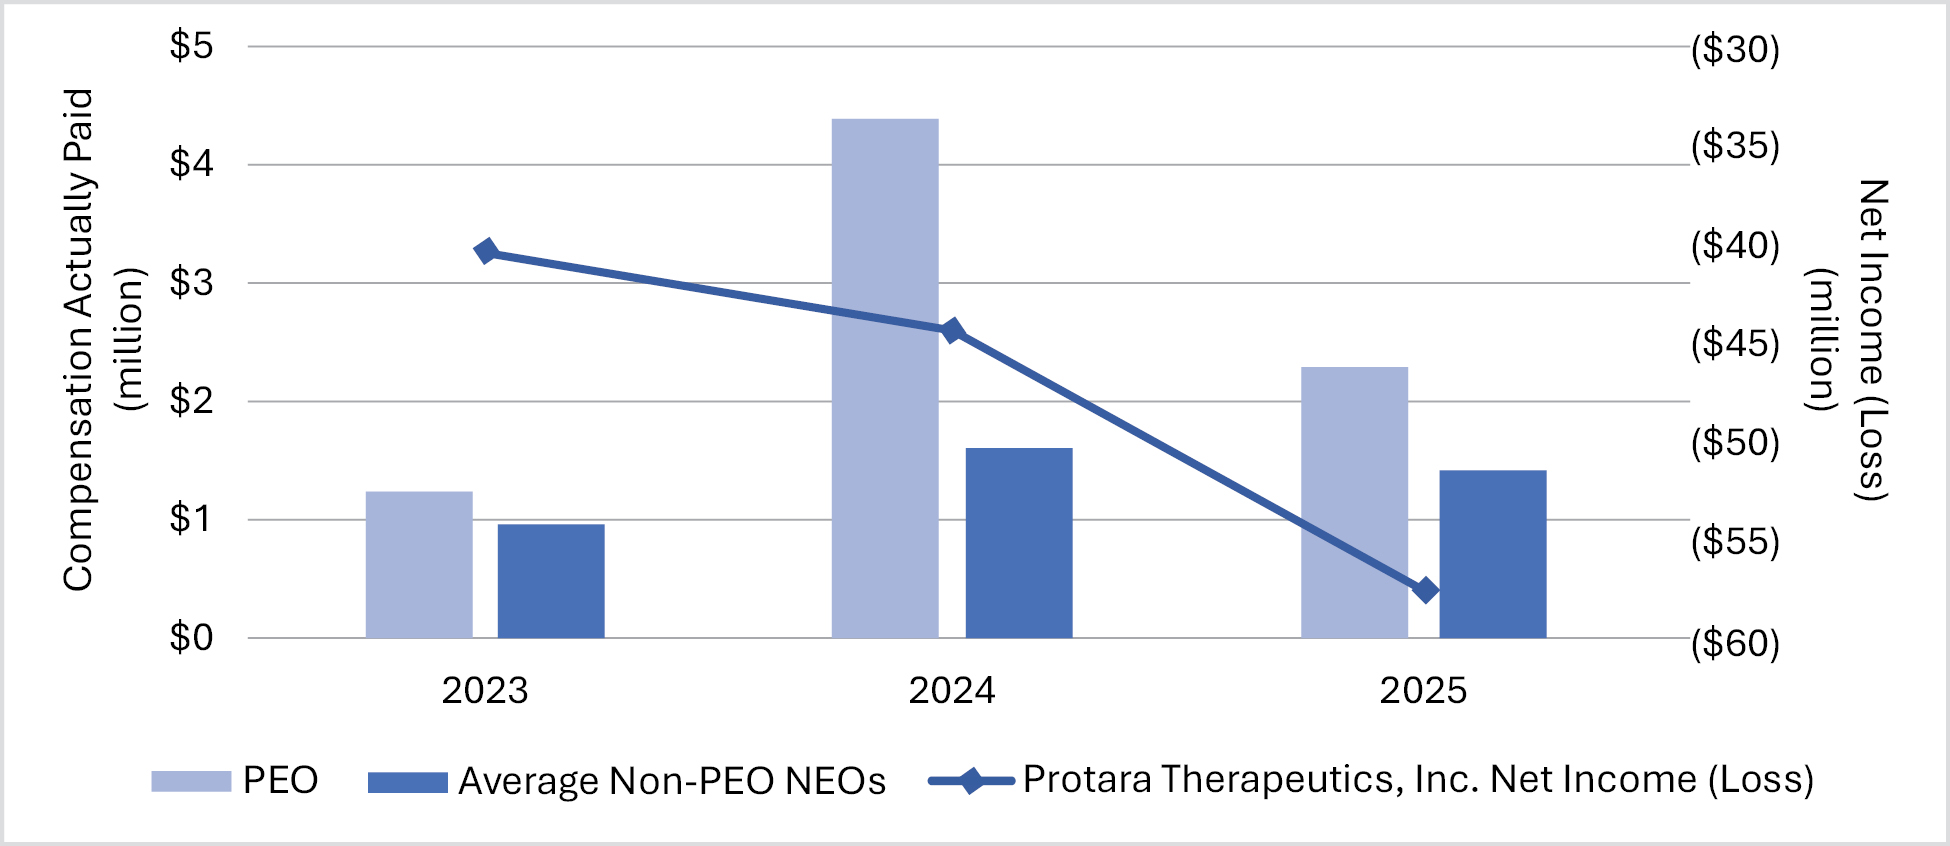
Relationship Between Compensation Actually Paid and Net Income (Loss)
The following chart sets forth the relationship between Compensation Actually Paid to our PEO, the average of Compensation Actually Paid to our non-PEO NEOs, and our net income (loss) during the three most recently completed fiscal years.
All information provided above under the “Pay Versus Performance” heading will not be deemed to be incorporated by reference in any filing of our company under the Securities Act of 1933, as amended, whether made before or after the date hereof and irrespective of any general incorporation language in any such filing.
| [1] | Mr. Shefferman was our principal executive officer (“PEO”) for each of the years reported. | |||||||||||||||||||||||||||||||||||||||||||||||||||||||||||||||||||||||||||||||||||||||||||||||||||||||||||||||||
| [2] | Compensation Actually Paid to our PEO was calculated in accordance with Item 402(v) of Regulation S-K by deducting and adding from the Summary Compensation Table totals as shown below. In calculating the Compensation Actually Paid amounts reflected in this column, the fair value or change in fair value, as applicable, of the equity award adjustments included in such calculations was computed in accordance with FASB ASC Topic 718. The valuation assumptions used to calculate such fair values did not materially differ from those disclosed at the time of grant.
(a) The grant date fair value of equity awards represents the total of the amounts reported in the “Stock Awards” and “Option Awards” columns in the Summary Compensation Table for the applicable year. |
|||||||||||||||||||||||||||||||||||||||||||||||||||||||||||||||||||||||||||||||||||||||||||||||||||||||||||||||||
| [3] | The Non-PEO NEOs, for each year reported were as follows: 2025: Leonardo Nicacio, M.D. and Jacqueline Zummo, Ph.D. 2024: Patrick Fabbio, Jacqueline Zummo, Ph.D. and Jathin Bandari, M.D. 2023: Patrick Fabbio and Jacqueline Zummo, Ph.D. Compensation Actually Paid to our Non-PEO NEOs was calculated in accordance with Item 402(v) of Regulation S-K by deducting and adding from the Summary Compensation Table totals as shown below. In calculating the Compensation Actually Paid amounts reflected in this column, the fair value or change in fair value, as applicable, of the equity award adjustments included in such calculations was computed in accordance with FASB ASC Topic 718. The valuation assumptions used to calculate such fair values did not materially differ from those disclosed at the time of grant.
(a) The grant date fair value of equity awards represents the total of the amounts reported in the “Stock Awards” and “Option Awards” columns in the Summary Compensation Table for the applicable year. |
|||||||||||||||||||||||||||||||||||||||||||||||||||||||||||||||||||||||||||||||||||||||||||||||||||||||||||||||||
| [4] | The values disclosed in this TSR column represent the value at year-end, for each noted year, of an initial fixed investment of $100 made on December 31, 2022. | |||||||||||||||||||||||||||||||||||||||||||||||||||||||||||||||||||||||||||||||||||||||||||||||||||||||||||||||||
| [5] | The dollar amounts reported represent the amount of net income (loss) reflected in our audited consolidated financial statements included in the Annual Report for the applicable year. | |||||||||||||||||||||||||||||||||||||||||||||||||||||||||||||||||||||||||||||||||||||||||||||||||||||||||||||||||
| [6] | The grant date fair value of equity awards represents the total of the amounts reported in the “Stock Awards” and “Option Awards” columns in the Summary Compensation Table for the applicable year. | |||||||||||||||||||||||||||||||||||||||||||||||||||||||||||||||||||||||||||||||||||||||||||||||||||||||||||||||||
| [7] | The grant date fair value of equity awards represents the total of the amounts reported in the “Stock Awards” and “Option Awards” columns in the Summary Compensation Table for the applicable year. | |||||||||||||||||||||||||||||||||||||||||||||||||||||||||||||||||||||||||||||||||||||||||||||||||||||||||||||||||