Pay vs Performance Disclosure - USD ($)
|
12 Months Ended |
Dec. 28, 2025 |
Dec. 29, 2024 |
Dec. 31, 2023 |
Dec. 25, 2022 |
Dec. 26, 2021 |
| Pay vs Performance Disclosure |
|
|
|
|
|
| Pay vs Performance Disclosure, Table |
| | | | | | | | | | | | | | | | | | | | | | | | | | | | | | | | | | | | | | | | | | | | | | | | | | | | | | | | | Year(1) | Summary Compensation Table Total for PEO1(1) ($) | Summary Compensation Table Total for PEO2(1) ($) | Compensation Actually Paid to PEO1(1)(3) | Compensation Actually Paid to PEO2(1)(3) | Average Summary Compensation Table Total for Non-PEO Named Executive Officers ($)(2) | Average Compensation Actually Paid to Non-PEOs Named Executive Officers ($)(2)(4) | | Value of initial fixed $100
investment based on: | Net Income (Loss) ($ in thousands) | Adjusted EBITDA ($ in thousands)(6) | | Total Shareholder Return ($)(5) | Peer Group Total Shareholder Return ($)(5) | | 2025 | | $ | 7,326,910 | | $ | 1,467,689 | | $ | 2,893,265 | | $ | 1,085,003 | | | $ | 1,312,847 | | | $ | 694,216 | | | | $ | 16.19 | | | $ | 85.41 | | | $ | 21,092 | | | $ | 97,331 | | | 2024 | | 5,871,407 | | — | | 3,640,156 | | — | | | 1,240,165 | | | 647,101 | | | | 30.86 | | | 100.21 | | | 35,076 | | | 104,760 | | | 2023 | | 2,047,180 | | — | | (2,495,215) | | — | | | 811,553 | | | 109,240 | | | | 54.74 | | | 84.48 | | | 24,818 | | | 102,282 | | | 2022 | | 1,288,848 | | — | | (27,590,871) | | — | | | 600,948 | | | (3,550,698) | | | | 59.07 | | | 71.31 | | | 17,157 | | | 84,955 | | | 2021 | | 31,244,207 | | — | | 49,575,563 | | — | | | 5,753,329 | | | 6,805,064 | | | | 131.75 | | | 89.79 | | | (13,416) | | | 98,497 | |
|
|
|
|
|
| Company Selected Measure Name |
Adjusted EBITDA
|
|
|
|
|
| Named Executive Officers, Footnote |
PEO1 and PEO2 refer to Michael Osanloo and Michael A. Miles, Jr, respectively. The individuals comprising the Non-PEO NEOs for each year presented are: 2025: Michelle Hook, Tony Darden, Jill Waite, and Kelly Kaiser. 2024: Michelle Hook, Jill Waite, Kelly Kaiser, Mike Ellis and Derrick Pratt. Mr. Pratt ceased to be an Executive Officer as of June 30, 2024. 2023: Michelle Hook, Derrick Pratt, Jill Waite and Susan Shelton. Ms. Shelton ceased to be an Executive Officer as of February 8, 2024. 2022: Michelle Hook, Derrick Pratt and Sherri Abruscato. Ms. Abruscato ceased to be an Executive Officer as of October 31, 2022. 2021: Sherri Abruscato and Michelle Hook.
|
|
|
|
|
| Peer Group Issuers, Footnote |
For the relevant fiscal year, represents the cumulative total shareholder return (“TSR”) of Portillo’s through the applicable fiscal year, assuming $100 was invested on October 21, 2021. For the relevant fiscal year, represents cumulative TSR of the S&P 600 Restaurants Index through the applicable fiscal year, assuming $100 was invested October 21, 2021 and dividends were reinvested.
|
|
|
|
|
| PEO Total Compensation Amount |
|
$ 5,871,407
|
$ 2,047,180
|
$ 1,288,848
|
$ 31,244,207
|
| PEO Actually Paid Compensation Amount |
|
3,640,156
|
(2,495,215)
|
(27,590,871)
|
49,575,563
|
| Adjustment To PEO Compensation, Footnote |
Item 402 requires certain adjustments to be made to the Summary Compensation Table totals to determine CAP for reporting in the Pay versus Performance Table. CAP is a value calculated under Item 402, but does not necessarily represent cash and/or equity transferred to the NEO without restriction. As required by Item 402, the following table details adjustments made to Summary Compensation Table total compensation values to arrive at CAP values (Note that NEOs do not participate in a defined benefit plan so there are no adjustments for pension benefits, and similarly, there are no adjustments made for dividends). The following table reconciles the PEO1 Summary Compensation Table total to PEO1 Compensation Actually Paid for fiscal 2025: | | | | | | | | | | | | | | | | | | | | | | | | | | | | | | | | | | | | | | | | | | | Year | Summary Compensation Table Total ($) | Grant Date Fair Value of Equity Awards Granted During Applicable Year ($) | Year-End Fair Value of Equity Awards Granted During Applicable Year ($)(7) | Change in Fair Value as of Year- End of Any Prior Year Awards that Remain Unvested as of Year-End ($) | Fair Value as of the Vesting Date of Any Equity Awards Granted During Applicable Year that Vested During Applicable Year ($) | Change in Fair Value as of the Vesting Date of Any Prior Year Awards that Vested During Applicable Year ($) | Fair Value at the End of the Prior Year for Prior Year Awards Forfeited During Applicable Year ($) | Total Equity Value Reflected in Compensation Actually Paid ($) | | | | | | | | | | | | | | | | 2025 | $ | 7,326,910 | | $ | (4,000,000) | | | $ | — | | | $ | — | | | $ | — | | | $ | 2,352,034 | | | $ | (2,785,679) | | $ | 2,893,265 | | | 2024 | 5,871,407 | | (4,000,000) | | | 2,785,679 | | | (530,950) | | | — | | | (220,530) | | | (265,450) | | 3,640,156 | | | 2023 | 2,047,180 | | — | | | — | | | (3,679,281) | | | — | | | (863,114) | | | — | | (2,495,215) | | | 2022 | 1,288,848 | | (413,746) | | | — | | | (20,471,998) | | | 413,746 | | | (8,407,721) | | | — | | (27,590,871) | | | 2021 | 31,244,207 | | (27,666,075) | | | 27,740,157 | | | 5,601,087 | | | 9,855,643 | | | 2,800,544 | | | — | | 49,575,563 | |
The following table reconciles the PEO2 Summary Compensation Table total to PEO1 Compensation Actually Paid for fiscal 2025: | | | | | | | | | | | | | | | | | | | | | | | | | | | | | | | | | | | | | | | | | | | Year | Summary Compensation Table Total ($) | Grant Date Fair Value of Equity Awards Granted During Applicable Year ($) | Year-End Fair Value of Equity Awards Granted During Applicable Year ($)(7) | Change in Fair Value as of Year- End of Any Prior Year Awards that Remain Unvested as of Year-End ($) | Fair Value as of the Vesting Date of Any Equity Awards Granted During Applicable Year that Vested During Applicable Year ($) | Change in Fair Value as of the Vesting Date of Any Prior Year Awards that Vested During Applicable Year ($) | Fair Value at the End of the Prior Year for Prior Year Awards Forfeited During Applicable Year ($) | Total Equity Value Reflected in Compensation Actually Paid ($) | | | | | | | | | | | | | | | | 2025 | $ | 1,467,689 | | $ | (1,320,000) | | | $ | 937,314 | | | $ | — | | | $ | — | | | $ | — | | | $ | — | | $ | 1,085,003 | | | 2024 | — | | — | | | — | | | — | | | — | | | — | | | — | | — | | | 2023 | — | | — | | | — | | | — | | | — | | | — | | | — | | — | | | 2022 | — | | — | | | — | | | — | | | — | | | — | | | — | | — | | | 2021 | — | | — | | | — | | | — | | | — | | | — | | | — | | — | |
|
|
|
|
|
| Non-PEO NEO Average Total Compensation Amount |
$ 1,312,847
|
1,240,165
|
811,553
|
600,948
|
5,753,329
|
| Non-PEO NEO Average Compensation Actually Paid Amount |
$ 694,216
|
647,101
|
109,240
|
(3,550,698)
|
6,805,064
|
| Adjustment to Non-PEO NEO Compensation Footnote |
Average non-PEO NEO Compensation Actually Paid | | | | | | | | | | | | | | | | | | | | | | | | | | | | | | | | | | | | | | | | | | | | | | | | | | | | Year | Summary Compensation Table Total ($) | Grant Date Fair Value of Equity Awards Granted During Applicable Year ($) | Year-End Fair Value of Equity Awards Granted During Applicable Year ($)(7) | Change in Fair Value as of Year- End of Any Prior Year Awards that Remain Unvested as of Year-End ($) | Fair Value as of the Vesting Date of Any Equity Awards Granted During Applicable Year that Vested During Applicable Year ($) | Change in Fair Value as of the Vesting Date of Any Prior Year Awards that Vested During Applicable Year ($) | Fair Value at the End of the Prior Year for Prior Year Awards Forfeited During Applicable Year ($) | Total Equity Value Reflected in Compensation Actually Paid ($) | | | | | | | | | | | | | | | | | | | 2025 | | $ | 1,312,847 | | | $ | (848,030) | | | $ | 436,971 | | | $ | (177,578) | | | $ | — | | | $ | (29,994) | | | $ | — | | | $ | 694,216 | | | 2024 | | 1,240,165 | | | (595,000) | | | 353,482 | | | (96,149) | | | — | | | (123,643) | | | (131,754) | | | 647,101 | | | 2023 | | 811,553 | | | — | | | — | | | (702,931) | | | — | | | 618 | | | — | | | 109,240 | | | 2022 | | 600,948 | | | (138,459) | | | — | | | (3,355,857) | | | 107,060 | | | (501,815) | | | (262,575) | | | (3,550,698) | | | 2021 | | 5,753,329 | | | (4,814,531) | | | 5,468,876 | | | — | | | 397,391 | | | — | | | — | | | 6,805,064 | |
|
|
|
|
|
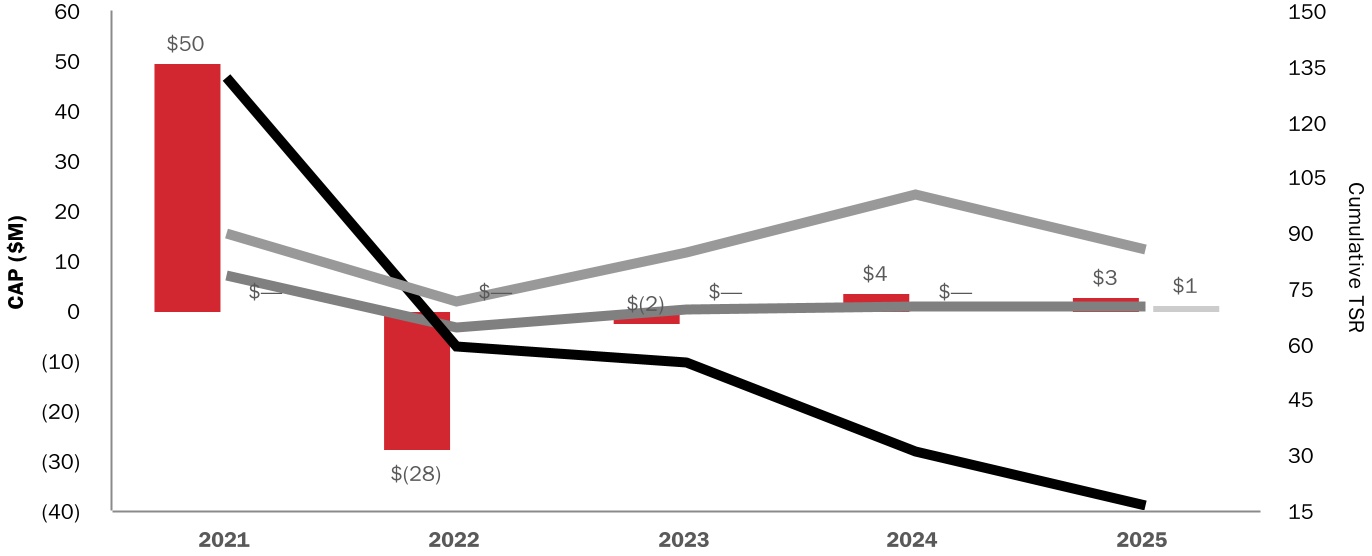
| Compensation Actually Paid vs. Total Shareholder Return |
Compensation Actually Paid vs. TSR (Company TSR & Peer Group TSR) | | | | | | | | | | | | | | | | | | | | | | | | | | | | | | | ¢ | PEO 1 CAP | ¢ | PEO 2 CAP | | PTLO TSR | | NEO Avg CAP | | S&P 600 Restaurants Index |
|
|
|
|
|
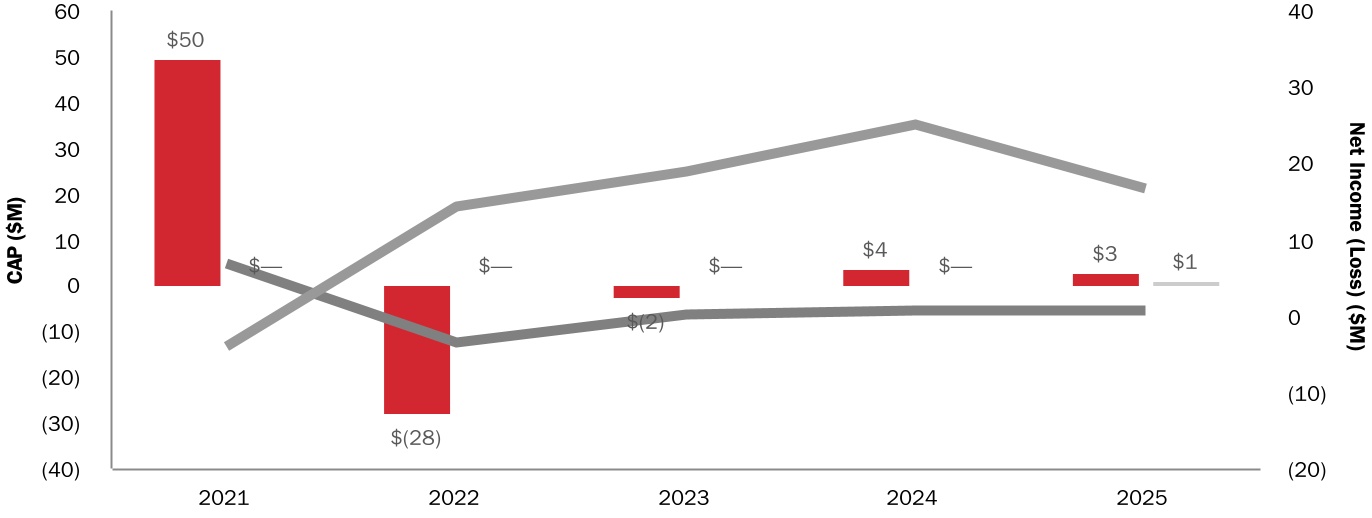
| Compensation Actually Paid vs. Net Income |
Compensation Actually Paid vs. Net Income | | | | | | | | | | | | | | | | | | | | | | | | | ¢ | PEO 1 CAP | ¢ | PEO 2 CAP | | NEO Avg CAP | | Net Income |
|
|
|
|
|
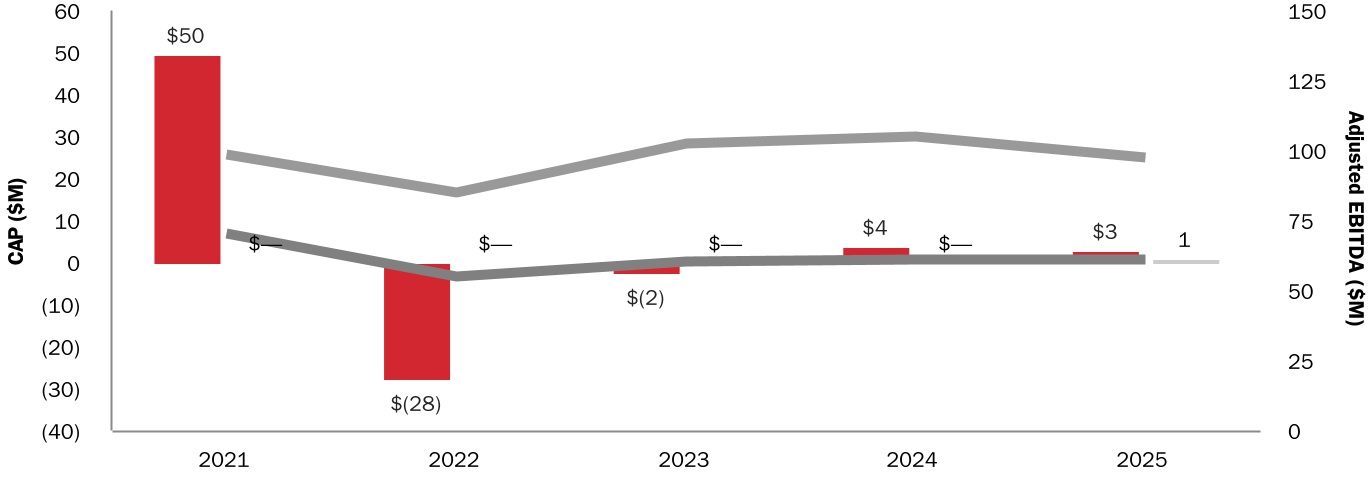
| Compensation Actually Paid vs. Company Selected Measure |
Compensation Actually Paid vs. Adjusted EBITDA | | | | | | | | | | | | | | | | | | | | | | | | | ¢ | PEO 1 CAP | ¢ | PEO 2 CAP | | NEO Avg CAP | | Adjusted EBITDA |
|
|
|
|
|
| Total Shareholder Return Vs Peer Group |
Compensation Actually Paid vs. TSR (Company TSR & Peer Group TSR) | | | | | | | | | | | | | | | | | | | | | | | | | | | | | | | ¢ | PEO 1 CAP | ¢ | PEO 2 CAP | | PTLO TSR | | NEO Avg CAP | | S&P 600 Restaurants Index |
|
|
|
|
|
| Tabular List, Table |
| | | | Other Key Company Measures | Restaurant Unit Growth | | Revenue | Same Restaurant Sales Growth | Restaurant-level Adjusted EBITDA | |
|
|
|
|
|
| Total Shareholder Return Amount |
$ 16.19
|
30.86
|
54.74
|
59.07
|
131.75
|
| Peer Group Total Shareholder Return Amount |
85.41
|
100.21
|
84.48
|
71.31
|
89.79
|
| Net Income (Loss) |
$ 21,092,000
|
$ 35,076,000
|
$ 24,818,000
|
$ 17,157,000
|
$ (13,416,000)
|
| Company Selected Measure Amount |
97,331,000
|
104,760,000
|
102,282,000
|
84,955,000
|
98,497,000
|
| Additional 402(v) Disclosure |
For purposes of this table, all PSUs are based on target-level achievement.
|
|
|
|
|
| Measure:: 1 |
|
|
|
|
|
| Pay vs Performance Disclosure |
|
|
|
|
|
| Name |
Adjusted EBITDA
|
|
|
|
|
| Non-GAAP Measure Description |
The Company defines Adjusted EBITDA as net income (loss) before depreciation and amortization, interest expense, interest income, and income taxes, adjusted for the impact of certain non-cash and other items that we do not consider in our evaluation of ongoing core operating performance, including equity-based compensation expense, deferred lease costs, loss on disposal of assets and impairment charges, ERP and human capital management (“HCM”) implementation costs, certain non-recurring charges, costs related to the Company's strategic reset of its development and growth plans, and Tax Receivable Agreement liability adjustments.
|
|
|
|
|
| Measure:: 2 |
|
|
|
|
|
| Pay vs Performance Disclosure |
|
|
|
|
|
| Name |
Restaurant Unit Growth
|
|
|
|
|
| Measure:: 3 |
|
|
|
|
|
| Pay vs Performance Disclosure |
|
|
|
|
|
| Name |
Revenue
|
|
|
|
|
| Measure:: 4 |
|
|
|
|
|
| Pay vs Performance Disclosure |
|
|
|
|
|
| Name |
Same Restaurant Sales Growth
|
|
|
|
|
| Measure:: 5 |
|
|
|
|
|
| Pay vs Performance Disclosure |
|
|
|
|
|
| Name |
Restaurant-level Adjusted EBITDA
|
|
|
|
|
| Michael Osanloo [Member] |
|
|
|
|
|
| Pay vs Performance Disclosure |
|
|
|
|
|
| PEO Total Compensation Amount |
$ 7,326,910
|
$ 5,871,407
|
$ 2,047,180
|
$ 1,288,848
|
$ 31,244,207
|
| PEO Actually Paid Compensation Amount |
$ 2,893,265
|
3,640,156
|
(2,495,215)
|
(27,590,871)
|
49,575,563
|
| PEO Name |
Michael Osanloo
|
|
|
|
|
| Michael A. Miles Jr, [Member] |
|
|
|
|
|
| Pay vs Performance Disclosure |
|
|
|
|
|
| PEO Total Compensation Amount |
$ 1,467,689
|
|
|
|
|
| PEO Actually Paid Compensation Amount |
$ 1,085,003
|
|
|
|
|
| PEO Name |
Michael A. Miles, Jr,
|
|
|
|
|
| PEO | Michael Osanloo [Member] | Aggregate Grant Date Fair Value of Equity Award Amounts Reported in Summary Compensation Table |
|
|
|
|
|
| Pay vs Performance Disclosure |
|
|
|
|
|
| Adjustment to Compensation, Amount |
$ (4,000,000)
|
(4,000,000)
|
0
|
(413,746)
|
(27,666,075)
|
| PEO | Michael Osanloo [Member] | Year-end Fair Value of Equity Awards Granted in Covered Year that are Outstanding and Unvested |
|
|
|
|
|
| Pay vs Performance Disclosure |
|
|
|
|
|
| Adjustment to Compensation, Amount |
0
|
2,785,679
|
0
|
0
|
27,740,157
|
| PEO | Michael Osanloo [Member] | Year-over-Year Change in Fair Value of Equity Awards Granted in Prior Years That are Outstanding and Unvested |
|
|
|
|
|
| Pay vs Performance Disclosure |
|
|
|
|
|
| Adjustment to Compensation, Amount |
0
|
(530,950)
|
(3,679,281)
|
(20,471,998)
|
5,601,087
|
| PEO | Michael Osanloo [Member] | Vesting Date Fair Value of Equity Awards Granted and Vested in Covered Year |
|
|
|
|
|
| Pay vs Performance Disclosure |
|
|
|
|
|
| Adjustment to Compensation, Amount |
0
|
0
|
0
|
413,746
|
9,855,643
|
| PEO | Michael Osanloo [Member] | Change in Fair Value as of Vesting Date of Prior Year Equity Awards Vested in Covered Year |
|
|
|
|
|
| Pay vs Performance Disclosure |
|
|
|
|
|
| Adjustment to Compensation, Amount |
2,352,034
|
(220,530)
|
(863,114)
|
(8,407,721)
|
2,800,544
|
| PEO | Michael Osanloo [Member] | Prior Year End Fair Value of Equity Awards Granted in Any Prior Year that Fail to Meet Applicable Vesting Conditions During Covered Year |
|
|
|
|
|
| Pay vs Performance Disclosure |
|
|
|
|
|
| Adjustment to Compensation, Amount |
(2,785,679)
|
(265,450)
|
0
|
0
|
0
|
| PEO | Michael A. Miles Jr, [Member] | Aggregate Grant Date Fair Value of Equity Award Amounts Reported in Summary Compensation Table |
|
|
|
|
|
| Pay vs Performance Disclosure |
|
|
|
|
|
| Adjustment to Compensation, Amount |
(1,320,000)
|
|
|
|
|
| PEO | Michael A. Miles Jr, [Member] | Year-end Fair Value of Equity Awards Granted in Covered Year that are Outstanding and Unvested |
|
|
|
|
|
| Pay vs Performance Disclosure |
|
|
|
|
|
| Adjustment to Compensation, Amount |
937,314
|
|
|
|
|
| PEO | Michael A. Miles Jr, [Member] | Year-over-Year Change in Fair Value of Equity Awards Granted in Prior Years That are Outstanding and Unvested |
|
|
|
|
|
| Pay vs Performance Disclosure |
|
|
|
|
|
| Adjustment to Compensation, Amount |
0
|
|
|
|
|
| PEO | Michael A. Miles Jr, [Member] | Vesting Date Fair Value of Equity Awards Granted and Vested in Covered Year |
|
|
|
|
|
| Pay vs Performance Disclosure |
|
|
|
|
|
| Adjustment to Compensation, Amount |
0
|
|
|
|
|
| PEO | Michael A. Miles Jr, [Member] | Change in Fair Value as of Vesting Date of Prior Year Equity Awards Vested in Covered Year |
|
|
|
|
|
| Pay vs Performance Disclosure |
|
|
|
|
|
| Adjustment to Compensation, Amount |
0
|
|
|
|
|
| PEO | Michael A. Miles Jr, [Member] | Prior Year End Fair Value of Equity Awards Granted in Any Prior Year that Fail to Meet Applicable Vesting Conditions During Covered Year |
|
|
|
|
|
| Pay vs Performance Disclosure |
|
|
|
|
|
| Adjustment to Compensation, Amount |
0
|
|
|
|
|
| Non-PEO NEO | Aggregate Grant Date Fair Value of Equity Award Amounts Reported in Summary Compensation Table |
|
|
|
|
|
| Pay vs Performance Disclosure |
|
|
|
|
|
| Adjustment to Compensation, Amount |
(848,030)
|
(595,000)
|
0
|
(138,459)
|
(4,814,531)
|
| Non-PEO NEO | Year-end Fair Value of Equity Awards Granted in Covered Year that are Outstanding and Unvested |
|
|
|
|
|
| Pay vs Performance Disclosure |
|
|
|
|
|
| Adjustment to Compensation, Amount |
436,971
|
353,482
|
0
|
0
|
5,468,876
|
| Non-PEO NEO | Year-over-Year Change in Fair Value of Equity Awards Granted in Prior Years That are Outstanding and Unvested |
|
|
|
|
|
| Pay vs Performance Disclosure |
|
|
|
|
|
| Adjustment to Compensation, Amount |
(177,578)
|
(96,149)
|
(702,931)
|
(3,355,857)
|
0
|
| Non-PEO NEO | Vesting Date Fair Value of Equity Awards Granted and Vested in Covered Year |
|
|
|
|
|
| Pay vs Performance Disclosure |
|
|
|
|
|
| Adjustment to Compensation, Amount |
0
|
0
|
0
|
107,060
|
397,391
|
| Non-PEO NEO | Change in Fair Value as of Vesting Date of Prior Year Equity Awards Vested in Covered Year |
|
|
|
|
|
| Pay vs Performance Disclosure |
|
|
|
|
|
| Adjustment to Compensation, Amount |
(29,994)
|
(123,643)
|
618
|
(501,815)
|
0
|
| Non-PEO NEO | Prior Year End Fair Value of Equity Awards Granted in Any Prior Year that Fail to Meet Applicable Vesting Conditions During Covered Year |
|
|
|
|
|
| Pay vs Performance Disclosure |
|
|
|
|
|
| Adjustment to Compensation, Amount |
$ 0
|
$ (131,754)
|
$ 0
|
$ (262,575)
|
$ 0
|