Pay vs Performance Disclosure - USD ($)
Dec. 31, 2025
Dec. 31, 2024
Dec. 31, 2023
Dec. 31, 2022
Dec. 31, 2021
PAY VERSUS PERFORMANCE |
As required by Section 953(a) of the Dodd-Frank Wall Street Reform and Consumer Protection Act and Item 402(v) of Regulation S-K, we are providing the following information about the relationship between executive “compensation actually paid” and certain financial performance of the Company. The Compensation Committee does not in practice use “compensation actually paid” as the basis for making compensation decisions. For further information concerning our compensation philosophy and how we align executive compensation with our performance, see “Compensation Discussion and Analysis.” The below disclosure is provided only to comply with applicable SEC rules.
Pay Versus Performance Table and Related Disclosure
The following table sets forth information regarding compensation for our principal executive officer and average compensation related to our other named executive officers versus our Company performance for the past five years.
Value of Initial Fixed $100 Investment Based On: | ||||||||||||||||||||||||||
Year(1) | Summary Compensation Table Total for CEO($) | Compensation Actually Paid to CEO ($)(2)(3) | Average Summary Compensation Table Total for Other NEOs ($) | Average Compensation Actually Paid to Other NEOs ($)(3)(4) | Total Shareholder Return ($)(5) | Peer Group Total Shareholder Return ($)(5) | Net Loss ($) (in thousands) | Annual Recurring Revenues ($)(6) (in thousands) | ||||||||||||||||||
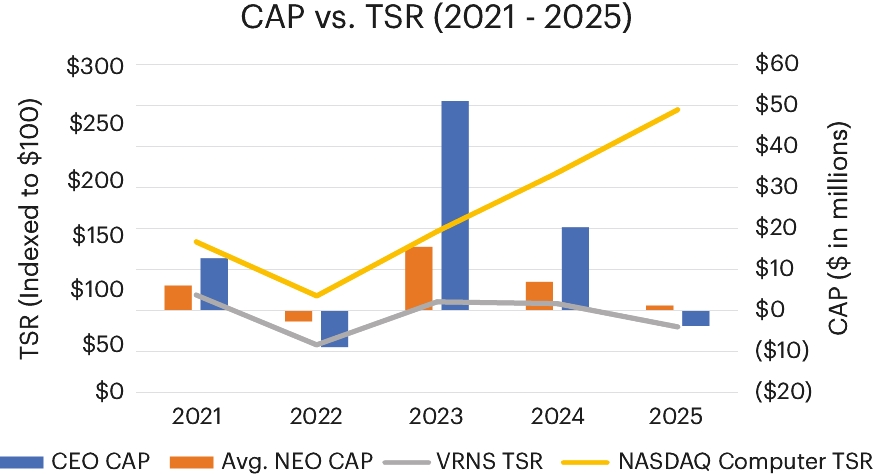
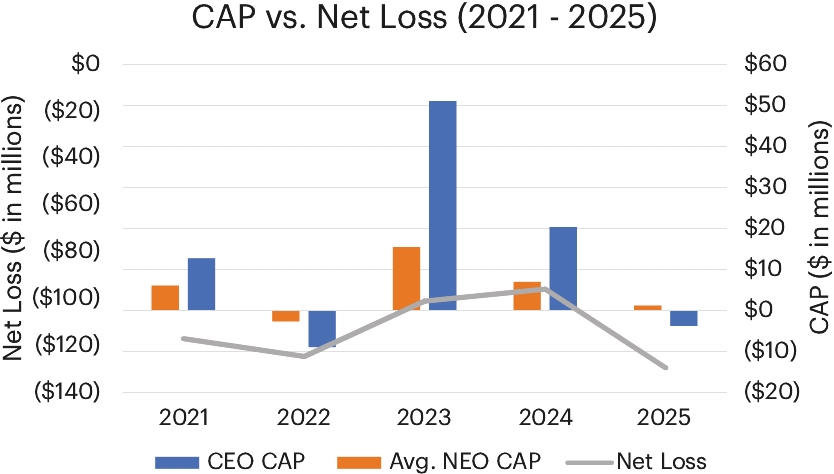
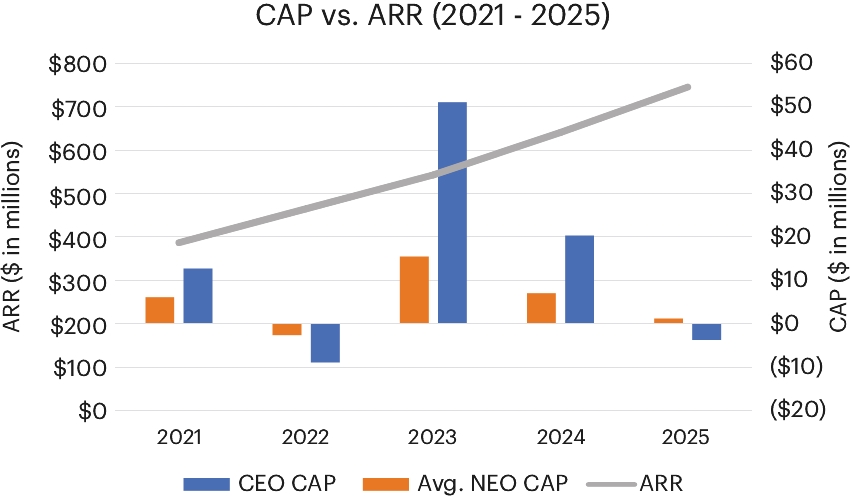
2025 | 14,375,278 | (3,652,545) | 5,035,592 | 1,220,249 | 60.14 | 258.44 | (129,324) | 745,400 | ||||||||||||||||||
2024 | 14,502,288 | 20,277,376 | 5,019,444 | 7,007,804 | 81.46 | 200.98 | (95,765) | 641,900 | ||||||||||||||||||
2023 | 14,112,979 | 50,973,771 | 4,799,302 | 15,463,566 | 83.02 | 147.39 | (100,916) | 543,000 | ||||||||||||||||||
2022 | 9,618,354 | (8,866,124) | 4,728,473 | (2,636,005) | 43.89 | 88.54 | (124,518) | 465,100 | ||||||||||||||||||
2021 | 10,372,443 | 12,724,377 | 5,273,748 | 6,100,570 | 89.44 | 137.86 | (116,861) | 387,100 | ||||||||||||||||||
(1) | The CEO and other NEOs included in the above compensation columns reflect the following: |
Year | CEO | Other NEOs | ||||||
2025 | Yakov Faitelson | Guy Melamed, David Bass, Gregory Pomeroy, Dov Gottlieb | ||||||
2024 | Yakov Faitelson | Guy Melamed, David Bass, James O’Boyle, Dov Gottlieb | ||||||
2023 | Yakov Faitelson | Guy Melamed, David Bass, James O’Boyle, Dov Gottlieb | ||||||
2022 | Yakov Faitelson | Guy Melamed, David Bass, James O’Boyle, Dov Gottlieb | ||||||
2021 | Yakov Faitelson | Guy Melamed, David Bass, James O’Boyle, Gilad Raz | ||||||
(2) | The following table details the amounts deducted and added to the Summary Compensation Table figure to calculate compensation actually paid in accordance with Item 402(v) for our CEO: |
2025 | 2024 | 2023 | 2022 | 2021 | |||||||||||||
Total Compensation as reported on Summary Compensation Table | 14,375,278 | 14,502,288 | 14,112,979 | 9,618,354 | 10,372,443 | ||||||||||||
Fair value of equity awards reported in Summary Compensation Table | (13,000,049) | (13,000,007) | (13,000,055) | (8,787,553) | (9,250,316) | ||||||||||||
Fair value at year-end of equity compensation granted in current year and unvested at year-end | 10,657,376 | 17,882,053 | 41,221,463 | 3,576,325 | 12,490,656 | ||||||||||||
Change in fair value from end of prior fiscal to end of current fiscal year for awards made in prior fiscal years that were unvested at end of current fiscal year | (15,428,323) | (820,990) | 7,810,760 | (11,936,142) | (2,779,713) | ||||||||||||
Change in fair value from end of prior fiscal year to vesting date for awards made in prior fiscal years that vested during current fiscal year | (256,827) | 1,714,032 | 828,624 | (1,337,108) | 1,891,307 | ||||||||||||
Compensation Actually Paid | (3,652,545) | 20,277,376 | 50,973,771 | (8,866,124) | 12,724,377 | ||||||||||||
(3) | The following table details the amounts deducted and added to the Summary Compensation Table figure to calculate compensation actually paid in accordance with Item 402(v) for all other NEOs: |
2025 | 2024 | 2023 | 2022 | 2021 | |||||||||||||
Total Compensation as reported on Summary Compensation Table | 5,035,592 | 5,019,444 | 4,799,302 | 4,728,473 | 5,273,748 | ||||||||||||
Fair value of equity awards reported in Summary Compensation Table | (4,338,474) | (4,342,319) | (4,142,279) | (4,142,296) | (4,714,847) | ||||||||||||
Fair value at year-end of equity compensation granted in current year and unvested at year-end | 3,556,660 | 5,706,156 | 11,498,166 | 1,927,757 | 5,832,637 | ||||||||||||
Change in fair value from end of prior fiscal to end of current fiscal year for awards made in prior fiscal years that were unvested at end of current fiscal year | (2,891,282) | (194,175) | 2,939,286 | (4,408,373) | (1,230,120) | ||||||||||||
Change in fair value from end of prior fiscal year to vesting date for awards made in prior fiscal years that vested during current fiscal year | (142,246) | 818,698 | 369,091 | (741,566) | 939,152 | ||||||||||||
Compensation Actually Paid | 1,220,249 | 7,007,804 | 15,463,566 | (2,636,005) | 6,100,570 | ||||||||||||
(4) | The assumptions used to value equity for the purposes of compensation actually paid were developed consistently with those used to value equity awards at the grant date under ASC 718. For each respective measurement date, RSUs were valued at the then-current stock price. PSUs were valued at the then-current stock price multiplied by the applicable performance factor actually earned for PSUs outstanding in fiscal year 2025. |
(5) | Peer Group TSR reflects the Company’s peer group (NASDAQ Computer Index) used for purposes of Item 201(e)(ii) of Regulation S-K in our latest Annual Report on Form 10-K filed with the SEC. Each year reflects what the cumulative value of $100 would be as of the end of the applicable fiscal year, including the reinvestment of dividends, if such amount were first invested on December 31, 2020. |
(6) | We chose annual recurring revenues as our company selected measure because it is the key variable component of our executive compensation program. Annual recurring revenues is a key performance indicator defined as the annualized value of active term-based subscription license contracts, maintenance contracts and SaaS contracts in effect at the end of that period. Subscription license contracts, maintenance contracts and SaaS contracts are annualized by dividing the total contract value by the number of days in the term and multiplying the result by 365. The annualized value of contracts is a legal and contractual determination made by assessing the contractual terms with our customers. The annualized value of maintenance contracts is not determined by reference to historical revenues, deferred revenues or any other GAAP financial measure over any period. Annual recurring revenues is not a forecast of future revenues and can be impacted by contract start and end dates and renewal rates. |
(1) | The CEO and other NEOs included in the above compensation columns reflect the following: |
Year | CEO | Other NEOs | ||||||
2025 | Yakov Faitelson | Guy Melamed, David Bass, Gregory Pomeroy, Dov Gottlieb | ||||||
2024 | Yakov Faitelson | Guy Melamed, David Bass, James O’Boyle, Dov Gottlieb | ||||||
2023 | Yakov Faitelson | Guy Melamed, David Bass, James O’Boyle, Dov Gottlieb | ||||||
2022 | Yakov Faitelson | Guy Melamed, David Bass, James O’Boyle, Dov Gottlieb | ||||||
2021 | Yakov Faitelson | Guy Melamed, David Bass, James O’Boyle, Gilad Raz | ||||||
(5) | Peer Group TSR reflects the Company’s peer group (NASDAQ Computer Index) used for purposes of Item 201(e)(ii) of Regulation S-K in our latest Annual Report on Form 10-K filed with the SEC. Each year reflects what the cumulative value of $100 would be as of the end of the applicable fiscal year, including the reinvestment of dividends, if such amount were first invested on December 31, 2020. |
(2) | The following table details the amounts deducted and added to the Summary Compensation Table figure to calculate compensation actually paid in accordance with Item 402(v) for our CEO: |
2025 | 2024 | 2023 | 2022 | 2021 | |||||||||||||
Total Compensation as reported on Summary Compensation Table | 14,375,278 | 14,502,288 | 14,112,979 | 9,618,354 | 10,372,443 | ||||||||||||
Fair value of equity awards reported in Summary Compensation Table | (13,000,049) | (13,000,007) | (13,000,055) | (8,787,553) | (9,250,316) | ||||||||||||
Fair value at year-end of equity compensation granted in current year and unvested at year-end | 10,657,376 | 17,882,053 | 41,221,463 | 3,576,325 | 12,490,656 | ||||||||||||
Change in fair value from end of prior fiscal to end of current fiscal year for awards made in prior fiscal years that were unvested at end of current fiscal year | (15,428,323) | (820,990) | 7,810,760 | (11,936,142) | (2,779,713) | ||||||||||||
Change in fair value from end of prior fiscal year to vesting date for awards made in prior fiscal years that vested during current fiscal year | (256,827) | 1,714,032 | 828,624 | (1,337,108) | 1,891,307 | ||||||||||||
Compensation Actually Paid | (3,652,545) | 20,277,376 | 50,973,771 | (8,866,124) | 12,724,377 | ||||||||||||
(3) | The following table details the amounts deducted and added to the Summary Compensation Table figure to calculate compensation actually paid in accordance with Item 402(v) for all other NEOs: |
2025 | 2024 | 2023 | 2022 | 2021 | |||||||||||||
Total Compensation as reported on Summary Compensation Table | 5,035,592 | 5,019,444 | 4,799,302 | 4,728,473 | 5,273,748 | ||||||||||||
Fair value of equity awards reported in Summary Compensation Table | (4,338,474) | (4,342,319) | (4,142,279) | (4,142,296) | (4,714,847) | ||||||||||||
Fair value at year-end of equity compensation granted in current year and unvested at year-end | 3,556,660 | 5,706,156 | 11,498,166 | 1,927,757 | 5,832,637 | ||||||||||||
Change in fair value from end of prior fiscal to end of current fiscal year for awards made in prior fiscal years that were unvested at end of current fiscal year | (2,891,282) | (194,175) | 2,939,286 | (4,408,373) | (1,230,120) | ||||||||||||
Change in fair value from end of prior fiscal year to vesting date for awards made in prior fiscal years that vested during current fiscal year | (142,246) | 818,698 | 369,091 | (741,566) | 939,152 | ||||||||||||
Compensation Actually Paid | 1,220,249 | 7,007,804 | 15,463,566 | (2,636,005) | 6,100,570 | ||||||||||||
Financial Performance Measures
As described in detail in the “Compensation Discussion and Analysis,” the Company’s executive compensation program consists of several compensation elements reflecting the Company’s pay-for-performance philosophy, including equity compensation which is directly tied to the returns experienced by our shareholders.
The most important financial performance measures used to link compensation actually paid to the Company’s named executive officers with the Company’s performance for 2025 are as follows:
• | Annual Recurring Revenues |
• | Trailing-Twelve-Month Margin |
• | Net New SaaS ARR |
• | Free Cash Flow |
(6) | We chose annual recurring revenues as our company selected measure because it is the key variable component of our executive compensation program. Annual recurring revenues is a key performance indicator defined as the annualized value of active term-based subscription license contracts, maintenance contracts and SaaS contracts in effect at the end of that period. Subscription license contracts, maintenance contracts and SaaS contracts are annualized by dividing the total contract value by the number of days in the term and multiplying the result by 365. The annualized value of contracts is a legal and contractual determination made by assessing the contractual terms with our customers. The annualized value of maintenance contracts is not determined by reference to historical revenues, deferred revenues or any other GAAP financial measure over any period. Annual recurring revenues is not a forecast of future revenues and can be impacted by contract start and end dates and renewal rates. |