PAY VERSUS PERFORMANCE
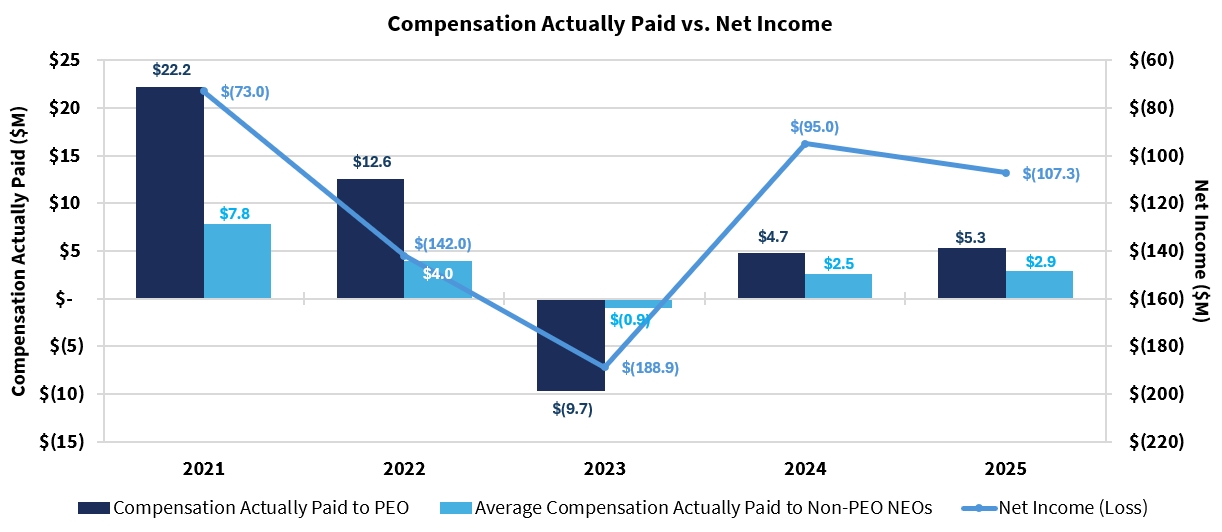
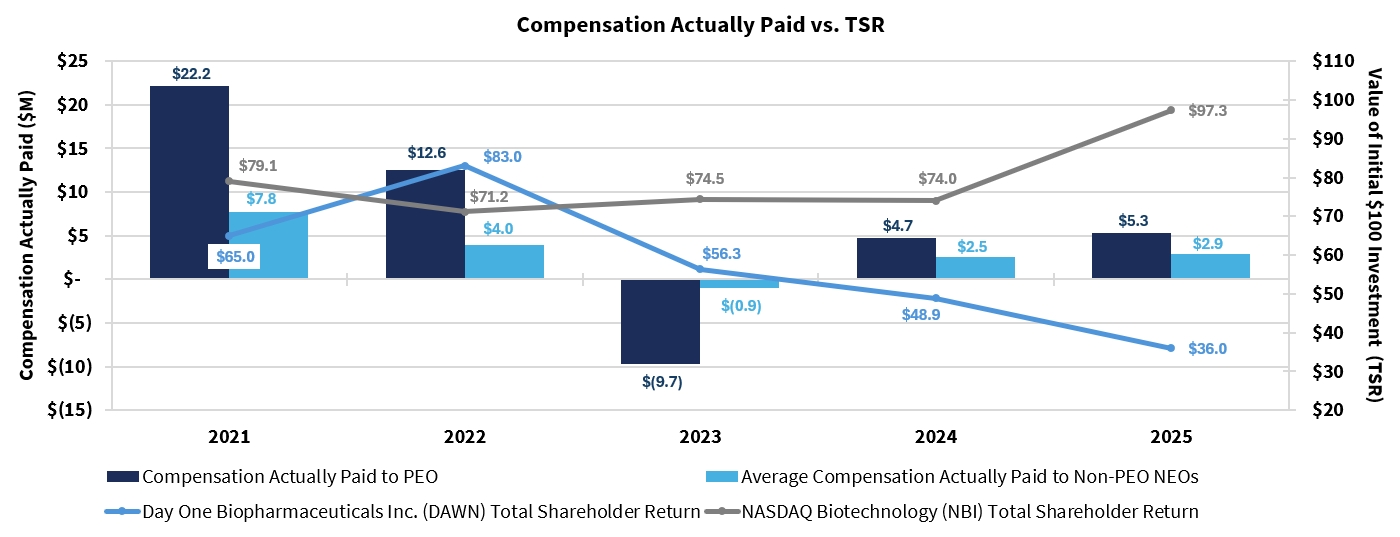
As required by Section 953(a) of the Dodd-Frank Wall Street Reform and Consumer Protection Act, and Item 402(v) of Regulation S-K (the “PvP Rules”), we are providing tabular compensation and performance disclosure for our fiscal years 2021, 2022, 2023, and 2024 and additional disclosure relative to the relationship between the “Compensation Actually Paid” (“CAP”) set forth in the Pay versus Performance Table and between the Company’s and the Peer Group TSR, in each case over four years. We did not use any financial performance measure to link “compensation actually paid” to our NEOs to our Company performance in the most recently completed fiscal year; accordingly, this disclosure does not present a Company-Selected Measure in the table below. The Compensation Committee did not consider the pay versus performance disclosure below in making its pay decisions for any of the years shown. For further information concerning our pay-for-performance philosophy and how we align executive compensation with our performance, refer to the “Compensation Discussion and Analysis” section above.
In the below Pay versus Performance Table, we provide information about compensation of our NEOs for each of the last four fiscal years (the “Covered Years”). Although the PvP Rules require us to disclose “compensation actually paid,” these amounts do not necessarily reflect compensation that our NEOs actually earned in the Covered Years. Instead, “compensation actually paid” reflects a calculation computed in accordance with the PvP Rules, including adjusted values to unvested and vested equity awards during the Covered Years based on either year-end or vesting date stock prices and various accounting valuation assumptions. “Compensation actually paid” generally fluctuates due to stock price performance.
|
|
|
|
|
|
|
|
|
|
|
|
|
|
Value of Initial Fixed $100 Investment based on: |
|
|
|
|
||||||||||
Year(1) |
|
Summary Compensation Table Total |
|
|
Compensation Actually Paid for PEO ($)(3) |
|
|
Average Summary Compensation Table Total |
|
|
Average Compensation Actually Paid for Non-PEO NEOs ($)(4) |
|
|
Total Shareholder Reurn ($)(5) |
|
|
Peer Group Total Shareholder Return ($)(6) |
|
|
Net Income (Loss) |
|
|||||||
2025 |
|
|
9,134,351 |
|
|
|
5,272,475 |
|
|
|
3,774,677 |
|
|
|
2,878,386 |
|
|
|
36 |
|
|
|
97 |
|
|
|
(107,322,000 |
) |
2024 |
|
|
6,560,577 |
|
|
|
4,740,154 |
|
|
|
3,298,866 |
|
|
|
2,545,320 |
|
|
|
49 |
|
|
|
93 |
|
|
|
(95,496,000 |
) |
2023 |
|
|
6,913,959 |
|
|
|
(9,653,551 |
) |
|
|
2,934,914 |
|
|
|
(945,110 |
) |
|
|
56 |
|
|
|
94 |
|
|
|
(188,917,000 |
) |
2022 |
|
|
5,086,456 |
|
|
|
12,585,855 |
|
|
|
2,198,324 |
|
|
|
3,989,344 |
|
|
|
83 |
|
|
|
90 |
|
|
|
(142,181,000 |
) |
2021 |
|
|
19,761,110 |
|
|
|
22,201,175 |
|
|
|
5,427,365 |
|
|
|
7,770,283 |
|
|
|
65 |
|
|
|
100 |
|
|
|
(72,754,000 |
) |
(1) Jeremy Bender served as the Company’s Principal Executive (our “PEO”) for the entirety of fiscal years 2021, 2022, 2023, 2024 and 2025. The Company’s other non-PEO NEOs for the indicated fiscal years were as follows:
(2) Amounts reported in these columns represent (i) the total compensation reported in the Summary Compensation Table for the indicated fiscal year in the case of our PEO and (ii) the average of the total compensation reported in the Summary Compensation Table for the non-PEO NEOs in the indicated year for such years.
(3) Amounts reported in these columns represent the compensation actually paid to our PEO for the indicated fiscal year, as calculated under Item 402(v) of Regulation S-K based on his total compensation reported in the Summary Compensation Table for the indicated fiscal years and adjusted as shown in the tables below:
|
|
|
2021 |
|
|
2022 |
|
|
2023 |
|
|
2024 |
|
|
2025 |
|
|||||
|
Summary Compensation Table - Total Compensation(a) |
|
|
19,761,110 |
|
|
|
5,086,456 |
|
|
|
6,913,959 |
|
|
|
6,560,577 |
|
|
|
9,134,351 |
|
- |
Grant Date Fair Value of Stock Awards and Option Awards Granted in Fiscal Year(b) |
|
|
18,924,289 |
|
|
|
4,174,256 |
|
|
|
5,865,559 |
|
|
|
5,364,977 |
|
|
|
4,425,385 |
|
+ |
Fair Value at Fiscal Year End of Outstanding and Unvested Stock Awards and Option Awards Granted in Fiscal Year(c) |
|
|
21,251,082 |
|
|
|
5,759,191 |
|
|
|
2,317,141 |
|
|
|
3,460,341 |
|
|
|
2,421,415 |
|
+/- |
Change in Fair Value of Outstanding and Unvested Stock Awards and Option Awards Granted in Prior Fiscal Years(d) |
|
— |
|
|
|
7,488,830 |
|
|
|
(7,618,215 |
) |
|
|
(988,072 |
) |
|
|
(1,080,428 |
) |
|
+ |
Fair Value at Vesting of Stock Awards and Option Awards Granted in Fiscal Year that Vested During Fiscal Year(e) |
|
|
113,272 |
|
|
|
1,315,382 |
|
|
|
721,743 |
|
|
|
1,305,626 |
|
|
|
681,098 |
|
+/- |
Change in Fair Value of Vesting Date of Stock Awards and Option Awards Grnated in Prior Fiscal Years for which applicable Vesting Conditions were Satisfied during Fiscal Year(f) |
|
— |
|
|
|
(2,889,748 |
) |
|
|
(6,122,619 |
) |
|
|
(233,340 |
) |
|
|
(1,458,576 |
) |
|
- |
Fair Value as of Prior Fiscal Year End of Stock Awards and Option Awards Granted in Prior Fiscal Years that Failed to meet Applicable Vesting Conditions during Applicable Fiscal Year(g) |
|
— |
|
|
— |
|
|
— |
|
|
— |
|
|
— |
|
|||||
= |
Compensation Actually Paid |
|
|
22,201,175 |
|
|
|
12,585,855 |
|
|
|
(9,653,551 |
) |
|
|
4,740,154 |
|
|
|
5,272,475 |
|
Equity award values are calculated in accordance with ASC 718, and the valuation assumptions used to calculate fair values did not materially differ from those disclosed at the time of grant of such equity awards.
(a) Represents Total Compensation as reported in the Summary Compensation Table for the indicated fiscal year.
(b) Represents the total of the amounts reported in the “Stock Awards” and “Option Awards” columns in the Summary Compensation Table granted to the PEO during the indicated fiscal year, computed in accordance with ASC 718.
(c) Represents the aggregate fair value as of the applicable fiscal year-end of the PEO’s outstanding and unvested stock awards and option awards granted during such fiscal year, computed in accordance with ASC 718.
(d) Represents the aggregate change in fair value during the applicable fiscal year of the outstanding and unvested stock awards and option awards held by the PEO as of the last day of the applicable fiscal year (from the end of the prior fiscal year), computed in accordance with ASC 718.
(e) Represents the aggregate fair value at vesting of the stock awards and option awards that were granted to the PEO and vested during the same applicable fiscal year, computed in accordance with ASC 718.
(f) Represents the aggregate change in fair value, measured from the prior fiscal year-end to the vesting date, of each stock award and option award held by the PEO that was granted in a prior fiscal year and which vested during the applicable fiscal year, computed in accordance with ASC 718.
(g) Represents the aggregate fair value as of the last day of the prior fiscal year of the PEOs stock awards and option awards that were granted in a prior fiscal year and which failed to meet the applicable vesting conditions during the applicable fiscal year, computed in accordance with ASC 718.
(4) Amounts reported in this column represent the compensation actually paid to the non-PEO NEOs in the indicated fiscal year, as calculated under Item 402(v) of Regulation S-K based on the average total compensation for such NEOs reported in the Summary Compensation Table for the indicated fiscal year and adjusted as shown in the table below:
|
|
|
2021 |
|
|
2022 |
|
|
2023 |
|
|
2024 |
|
|
2025 |
|
|||||
|
Summary Compensation Table - Total Compensation(a) |
|
|
5,427,365 |
|
|
|
2,198,324 |
|
|
|
2,934,914 |
|
|
|
3,298,866 |
|
|
|
3,774,677 |
|
- |
Grant Date Fair Value of Stock Awards and Option Awards Granted in Fiscal Year(b) |
|
|
4,756,410 |
|
|
|
1,503,124 |
|
|
|
2,232,014 |
|
|
|
2,505,733 |
|
|
|
2,492,958 |
|
+ |
Fair Value at Fiscal Year End of Outstanding and Unvested Stock Awards and Option Awards Granted in Fiscal Year(c) |
|
|
7,099,328 |
|
|
|
2,074,024 |
|
|
|
881,521 |
|
|
|
1,614,676 |
|
|
|
2,282,020 |
|
+/- |
Change in Fair Value of Outstanding and Unvested Stock Awards and Option Awards Granted in Prior Fiscal Years(d) |
|
— |
|
|
|
1,321,669 |
|
|
|
(1,730,931 |
) |
|
|
(374,055 |
) |
|
|
(474,845 |
) |
|
+ |
Fair Value at Vesting of Stock Awards and Option Awards Granted in Fiscal Year that Vested During Fiscal Year(e) |
|
— |
|
|
|
473,622 |
|
|
|
274,593 |
|
|
|
609,252 |
|
|
|
203,821 |
|
|
+/- |
Change in Fair Value of Vesting Date of Stock Awards and Option Awards Grnated in Prior Fiscal Years for which applicable Vesting Conditions were Satisfied during Fiscal Year(f) |
|
— |
|
|
|
(575,172 |
) |
|
|
(1,073,193 |
) |
|
|
(97,685 |
) |
|
|
(414,329 |
) |
|
- |
Fair Value as of Prior Fiscal Year End of Stock Awards and Option Awards Granted in Prior Fiscal Years that Failed to meet Applicable Vesting Conditions during Applicable Fiscal Year(g) |
|
— |
|
|
— |
|
|
— |
|
|
— |
|
|
— |
|
|||||
= |
Compensation Actually Paid |
|
|
7,770,283 |
|
|
|
3,989,344 |
|
|
|
(945,110 |
) |
|
|
2,545,320 |
|
|
|
2,878,386 |
|
Please see footnote 1 for the non-PEO NEOs included in the average for each indicated fiscal year. Equity Award values are calculated in accordance with ASC 718, and the valuation assumptions used to calculate fair values did not materially differ from those disclosed at the time of grant.
(a) Represents the average “Total Compensation” as reported in the Summary Compensation Table for the non-PEO NEOs (as a group) in the applicable fiscal year.
(b) Represents the average of the total of the amounts reported in the “Stock Awards” and “Option Awards” columns in the Summary Compensation Table granted to our non-PEO NEOs (as a group) during the applicable fiscal year, computed in accordance with ASC 718.
(c) Represents the average aggregate fair value as of the applicable fiscal year-end of our non-PEO NEOs’ (as a group) outstanding and unvested stock awards and option awards granted during such fiscal year, computed in accordance with ASC 718.
(d) Represents the average aggregate change in fair value during the applicable fiscal year of the outstanding and unvested stock awards and option awards held by our non-PEO NEOs (as a group) as of the last day of the applicable fiscal year, computed in accordance with ASC 718.
(e) Represents the average aggregate fair value at vesting of the stock awards and option awards that were granted to our non-PEO NEOs (as a group) and vested during the same applicable fiscal year, computed in accordance with ASC 718.
(f) Represents the average aggregate change in fair value, measured from the prior fiscal year-end to the vesting date, of each stock award and option award held by our non-PEO NEOs (as a group) that was granted in a prior fiscal year and which vested during the applicable fiscal year, computed in accordance with ASC 718.
(g) Represents the average aggregate fair value as of the last day of the prior fiscal year of our non-PEO NEOs’ (as a group) stock awards and option awards that were granted in a prior fiscal year and which failed to meet the applicable vesting conditions in the applicable fiscal year, computed in accordance with ASC 718.
(5) Pursuant to Item 402(v) of Regulation S-K, the comparison assumes $100 was invested in our common stock on May 27, 2021, using the closing stock price on that date. Historic stock price performance is not necessarily indicative of future stock price performance.
(6) The TSR Peer Group is the Nasdaq Biotechnology Index (NBI). This calculation assumes that $100 was invested in this index on May 27, 2021 (aligned with the period used in footnote #5 above).
(1) Jeremy Bender served as the Company’s Principal Executive (our “PEO”) for the entirety of fiscal years 2021, 2022, 2023, 2024 and 2025. The Company’s other non-PEO NEOs for the indicated fiscal years were as follows:
(3) Amounts reported in these columns represent the compensation actually paid to our PEO for the indicated fiscal year, as calculated under Item 402(v) of Regulation S-K based on his total compensation reported in the Summary Compensation Table for the indicated fiscal years and adjusted as shown in the tables below:
|
|
|
2021 |
|
|
2022 |
|
|
2023 |
|
|
2024 |
|
|
2025 |
|
|||||
|
Summary Compensation Table - Total Compensation(a) |
|
|
19,761,110 |
|
|
|
5,086,456 |
|
|
|
6,913,959 |
|
|
|
6,560,577 |
|
|
|
9,134,351 |
|
- |
Grant Date Fair Value of Stock Awards and Option Awards Granted in Fiscal Year(b) |
|
|
18,924,289 |
|
|
|
4,174,256 |
|
|
|
5,865,559 |
|
|
|
5,364,977 |
|
|
|
4,425,385 |
|
+ |
Fair Value at Fiscal Year End of Outstanding and Unvested Stock Awards and Option Awards Granted in Fiscal Year(c) |
|
|
21,251,082 |
|
|
|
5,759,191 |
|
|
|
2,317,141 |
|
|
|
3,460,341 |
|
|
|
2,421,415 |
|
+/- |
Change in Fair Value of Outstanding and Unvested Stock Awards and Option Awards Granted in Prior Fiscal Years(d) |
|
— |
|
|
|
7,488,830 |
|
|
|
(7,618,215 |
) |
|
|
(988,072 |
) |
|
|
(1,080,428 |
) |
|
+ |
Fair Value at Vesting of Stock Awards and Option Awards Granted in Fiscal Year that Vested During Fiscal Year(e) |
|
|
113,272 |
|
|
|
1,315,382 |
|
|
|
721,743 |
|
|
|
1,305,626 |
|
|
|
681,098 |
|
+/- |
Change in Fair Value of Vesting Date of Stock Awards and Option Awards Grnated in Prior Fiscal Years for which applicable Vesting Conditions were Satisfied during Fiscal Year(f) |
|
— |
|
|
|
(2,889,748 |
) |
|
|
(6,122,619 |
) |
|
|
(233,340 |
) |
|
|
(1,458,576 |
) |
|
- |
Fair Value as of Prior Fiscal Year End of Stock Awards and Option Awards Granted in Prior Fiscal Years that Failed to meet Applicable Vesting Conditions during Applicable Fiscal Year(g) |
|
— |
|
|
— |
|
|
— |
|
|
— |
|
|
— |
|
|||||
= |
Compensation Actually Paid |
|
|
22,201,175 |
|
|
|
12,585,855 |
|
|
|
(9,653,551 |
) |
|
|
4,740,154 |
|
|
|
5,272,475 |
|
Equity award values are calculated in accordance with ASC 718, and the valuation assumptions used to calculate fair values did not materially differ from those disclosed at the time of grant of such equity awards.
(a) Represents Total Compensation as reported in the Summary Compensation Table for the indicated fiscal year.
(b) Represents the total of the amounts reported in the “Stock Awards” and “Option Awards” columns in the Summary Compensation Table granted to the PEO during the indicated fiscal year, computed in accordance with ASC 718.
(c) Represents the aggregate fair value as of the applicable fiscal year-end of the PEO’s outstanding and unvested stock awards and option awards granted during such fiscal year, computed in accordance with ASC 718.
(d) Represents the aggregate change in fair value during the applicable fiscal year of the outstanding and unvested stock awards and option awards held by the PEO as of the last day of the applicable fiscal year (from the end of the prior fiscal year), computed in accordance with ASC 718.
(e) Represents the aggregate fair value at vesting of the stock awards and option awards that were granted to the PEO and vested during the same applicable fiscal year, computed in accordance with ASC 718.
(f) Represents the aggregate change in fair value, measured from the prior fiscal year-end to the vesting date, of each stock award and option award held by the PEO that was granted in a prior fiscal year and which vested during the applicable fiscal year, computed in accordance with ASC 718.
(g) Represents the aggregate fair value as of the last day of the prior fiscal year of the PEOs stock awards and option awards that were granted in a prior fiscal year and which failed to meet the applicable vesting conditions during the applicable fiscal year, computed in accordance with ASC 718.
(4) Amounts reported in this column represent the compensation actually paid to the non-PEO NEOs in the indicated fiscal year, as calculated under Item 402(v) of Regulation S-K based on the average total compensation for such NEOs reported in the Summary Compensation Table for the indicated fiscal year and adjusted as shown in the table below:
|
|
|
2021 |
|
|
2022 |
|
|
2023 |
|
|
2024 |
|
|
2025 |
|
|||||
|
Summary Compensation Table - Total Compensation(a) |
|
|
5,427,365 |
|
|
|
2,198,324 |
|
|
|
2,934,914 |
|
|
|
3,298,866 |
|
|
|
3,774,677 |
|
- |
Grant Date Fair Value of Stock Awards and Option Awards Granted in Fiscal Year(b) |
|
|
4,756,410 |
|
|
|
1,503,124 |
|
|
|
2,232,014 |
|
|
|
2,505,733 |
|
|
|
2,492,958 |
|
+ |
Fair Value at Fiscal Year End of Outstanding and Unvested Stock Awards and Option Awards Granted in Fiscal Year(c) |
|
|
7,099,328 |
|
|
|
2,074,024 |
|
|
|
881,521 |
|
|
|
1,614,676 |
|
|
|
2,282,020 |
|
+/- |
Change in Fair Value of Outstanding and Unvested Stock Awards and Option Awards Granted in Prior Fiscal Years(d) |
|
— |
|
|
|
1,321,669 |
|
|
|
(1,730,931 |
) |
|
|
(374,055 |
) |
|
|
(474,845 |
) |
|
+ |
Fair Value at Vesting of Stock Awards and Option Awards Granted in Fiscal Year that Vested During Fiscal Year(e) |
|
— |
|
|
|
473,622 |
|
|
|
274,593 |
|
|
|
609,252 |
|
|
|
203,821 |
|
|
+/- |
Change in Fair Value of Vesting Date of Stock Awards and Option Awards Grnated in Prior Fiscal Years for which applicable Vesting Conditions were Satisfied during Fiscal Year(f) |
|
— |
|
|
|
(575,172 |
) |
|
|
(1,073,193 |
) |
|
|
(97,685 |
) |
|
|
(414,329 |
) |
|
- |
Fair Value as of Prior Fiscal Year End of Stock Awards and Option Awards Granted in Prior Fiscal Years that Failed to meet Applicable Vesting Conditions during Applicable Fiscal Year(g) |
|
— |
|
|
— |
|
|
— |
|
|
— |
|
|
— |
|
|||||
= |
Compensation Actually Paid |
|
|
7,770,283 |
|
|
|
3,989,344 |
|
|
|
(945,110 |
) |
|
|
2,545,320 |
|
|
|
2,878,386 |
|
Please see footnote 1 for the non-PEO NEOs included in the average for each indicated fiscal year. Equity Award values are calculated in accordance with ASC 718, and the valuation assumptions used to calculate fair values did not materially differ from those disclosed at the time of grant.
(a) Represents the average “Total Compensation” as reported in the Summary Compensation Table for the non-PEO NEOs (as a group) in the applicable fiscal year.
(b) Represents the average of the total of the amounts reported in the “Stock Awards” and “Option Awards” columns in the Summary Compensation Table granted to our non-PEO NEOs (as a group) during the applicable fiscal year, computed in accordance with ASC 718.
(c) Represents the average aggregate fair value as of the applicable fiscal year-end of our non-PEO NEOs’ (as a group) outstanding and unvested stock awards and option awards granted during such fiscal year, computed in accordance with ASC 718.
(d) Represents the average aggregate change in fair value during the applicable fiscal year of the outstanding and unvested stock awards and option awards held by our non-PEO NEOs (as a group) as of the last day of the applicable fiscal year, computed in accordance with ASC 718.
(e) Represents the average aggregate fair value at vesting of the stock awards and option awards that were granted to our non-PEO NEOs (as a group) and vested during the same applicable fiscal year, computed in accordance with ASC 718.
(f) Represents the average aggregate change in fair value, measured from the prior fiscal year-end to the vesting date, of each stock award and option award held by our non-PEO NEOs (as a group) that was granted in a prior fiscal year and which vested during the applicable fiscal year, computed in accordance with ASC 718.
(g) Represents the average aggregate fair value as of the last day of the prior fiscal year of our non-PEO NEOs’ (as a group) stock awards and option awards that were granted in a prior fiscal year and which failed to meet the applicable vesting conditions in the applicable fiscal year, computed in accordance with ASC 718.
Tabular List of Financial Performance Measures
Given the current life-cycle stage of our Company, specific financial measures do not feature meaningfully in our incentive plan design, which focuses on clinical, regulatory and commercial advancement, business development and overall financial position, as described in the section titled “Compensation Discussion & Analysis.” For the fiscal year ended December 31, 2025, there were no financial performance measures used to link CAP paid to our NEOs to company performance and therefore, no company-selected measure is reported.