Pay vs Performance Disclosure - USD ($)
|
12 Months Ended |
Dec. 31, 2025 |
Dec. 31, 2024 |
Dec. 31, 2023 |
Dec. 31, 2022 |
Dec. 31, 2021 |
| Pay vs Performance Disclosure |
|
|
|
|
|
| Pay vs Performance Disclosure, Table |
| | | | | | | | | | | | | | | | | | | | | | | | | | | | Year | Summary Compensation Table Total for CEO
($) | Compensation Actually Paid to CEO ($)(1)(2) | Average Summary Compensation Table Total for Other NEOs ($)(3)(4) | Average Compensation Actually Paid to Other NEOs ($)(2)(4) | Value of Initial Fixed $100
Investment Based On: | Net Income (loss) ($ in millions)(6) | Revenue ($ in millions)(7) | Total Shareholder Return
($) | Peer Group Total Shareholder Return ($)(5) | | 2025 | 18,072,322 | | 19,627,298 | | 8,881,027 | | 9,710,121 | | 31.16 | | 176.01 | | 163 | | 2,884 | | | 2024 | 17,956,561 | | 3,664,112 | | 7,935,503 | | 3,245,043 | | 29.73 | | 151.87 | | 303 | | 2,808 | | | 2023 | 16,577,104 | | 5,868,843 | | 7,590,131 | | 3,947,292 | | 45.56 | | 123.64 | | 308 | | 2,748 | | | 2022 | 16,461,507 | | (15,823,299) | | 7,261,266 | | (4,534,407) | | 67.33 | | 99.29 | | (694) | | 2,566 | | | 2021 | 40,584,292 | | 52,367,686 | | 5,850,887 | | 11,909,053 | | 123.06 | | 124.76 | | 494 | | 2,329 | |
|
|
|
|
|
| Company Selected Measure Name |
revenue
|
|
|
|
|
| Named Executive Officers, Footnote |
The following table shows the adjustments made to the total compensation shown for our CEO, Mr. Silverman, in the applicable Summary Compensation Table for each Covered Year to arrive at “compensation actually paid” as reflected in the above table:The Other NEOs for 2021 were Ms. Glaser, Mr. Fisher, Ms. Patel Goyal, and Mr. Scott. The Other NEOs for 2022 were Ms. Glaser, Ms. Moskowitz, Mr. Scott, Mr. Fisher, and Ms. Patel Goyal. The Other NEOs for each of 2023 and 2024 were Ms. Glaser, Ms. Kumar, Ms. Moskowitz, and Mr. Stretch. The Other NEOs for 2025 were Mr. Baker, Ms. Patel Goyal, Mr. Colburn, and Mr. Stretch.
|
|
|
|
|
| Peer Group Issuers, Footnote |
Our peer group is the Russell 1000 Index, which is the index included in our Performance Graph in our Form 10-K for each of the Covered Years.
|
|
|
|
|
| PEO Total Compensation Amount |
$ 18,072,322
|
$ 17,956,561
|
$ 16,577,104
|
$ 16,461,507
|
$ 40,584,292
|
| PEO Actually Paid Compensation Amount |
$ 19,627,298
|
3,664,112
|
5,868,843
|
(15,823,299)
|
52,367,686
|
| Adjustment To PEO Compensation, Footnote |
| | | | | | | Adjustments to Determine CEO Compensation Actually Paid | 2025 | | Summary Compensation Table (SCT) amount | 18,072,322 | | | Less Amounts Reported under “Stock Awards” and "Option Awards" Columns in SCT for the Covered Year | (16,552,130) | | | Plus Year-end Fair Value of Stock Awards and Options Awards Granted during Covered Year that Remain Unvested as of Year-end | 17,469,247 | | | Plus Fair Value on Vesting of Awards Granted during Covered Year that Vest during Covered Year | 1,615,731 | | | Change (positive or negative) in Fair Value from Prior Year-end to Covered Year-end of Awards Granted Prior to Covered Year that were Outstanding and Unvested as of Covered Year-end | (1,622,717) | | | Change (positive or negative) in Fair Value from Prior Year-end to Vesting Date of Awards Granted Prior to Covered Year that Vested during Covered Year | (92,746) | | | Increase based upon Incremental Fair Value of Awards Modified during the year* | 737,591 | | | TOTAL ADJUSTMENTS: | 1,554,976 | | | TOTAL COMPENSATION ACTUALLY PAID: | 19,627,298 | |
|
|
|
|
|
| Non-PEO NEO Average Total Compensation Amount |
$ 8,881,027
|
7,935,503
|
7,590,131
|
7,261,266
|
5,850,887
|
| Non-PEO NEO Average Compensation Actually Paid Amount |
$ 9,710,121
|
3,245,043
|
3,947,292
|
(4,534,407)
|
11,909,053
|
| Adjustment to Non-PEO NEO Compensation Footnote |
The following table shows the adjustments made to the average of the total compensation shown for the Other NEOs in the applicable Summary Compensation Table for each Covered Year to arrive at “compensation actually paid” for 2025 as reflected in the above table: | | | | | | | Adjustments to Determine Average Other NEO Compensation Actually Paid | 2025 | | Summary Compensation Table (SCT) amount | 8,881,027 | | | Less Amounts Reported under “Stock Awards” Column in SCT for the Covered Year | (7,499,526) | | | Plus Year-end Fair Value of Stock Awards and Options Awards Granted during Covered Year that Remain Unvested as of Year-end | 7,525,908 | | | Plus Fair Value on Vesting of Awards Granted during Covered Year that Vest during Covered Year | 665,998 | | | Change (positive or negative) in Fair Value from Prior Year-end to Covered Year-end of Awards Granted Prior to Covered Year that were Outstanding and Unvested as of Covered Year-end | 14,456 | | | Change (positive or negative) in Fair Value from Prior Year-end to Vesting Date of Awards Granted Prior to Covered Year that Vested during Covered Year | 122,258 | | | TOTAL ADJUSTMENTS: | 829,094 | | | TOTAL COMPENSATION ACTUALLY PAID: | 9,710,121 | |
|
|
|
|
|
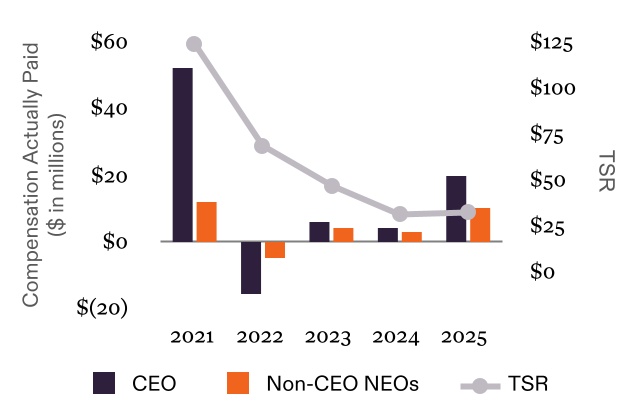
| Compensation Actually Paid vs. Total Shareholder Return |
Compensation Actually Paid vs TSR
|
|
|
|
|
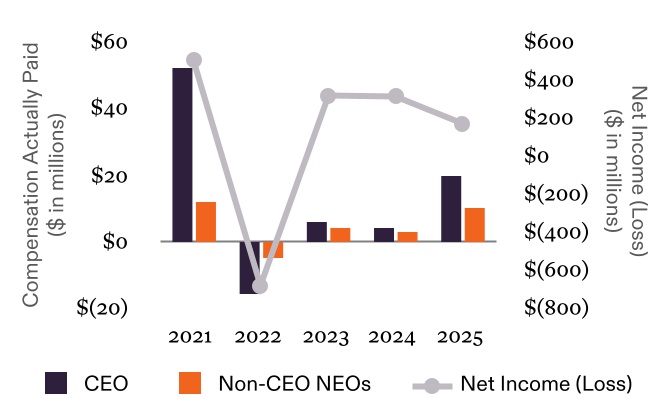
| Compensation Actually Paid vs. Net Income |
Compensation Actually Paid vs Net Income (Loss) |
|
|
|
|
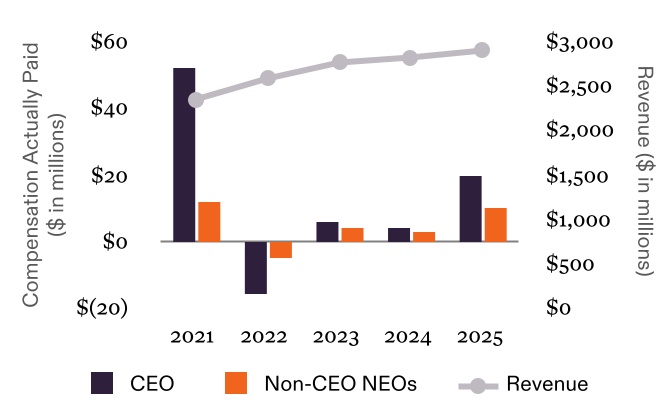
| Compensation Actually Paid vs. Company Selected Measure |
Compensation Actually Paid vs Revenue |
|
|
|
|
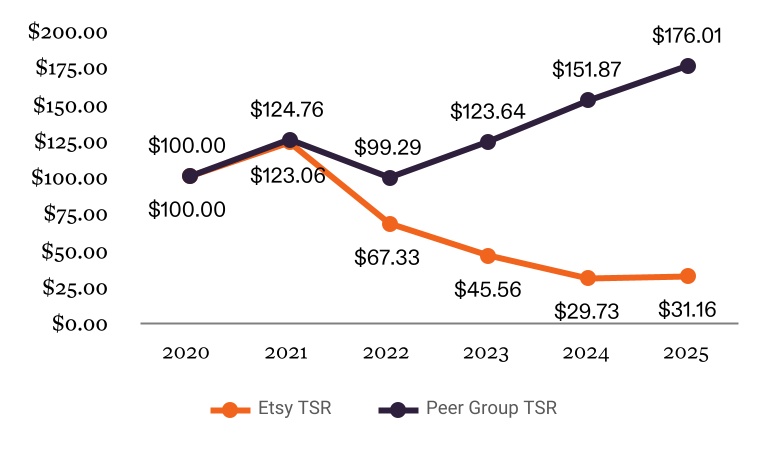
| Total Shareholder Return Vs Peer Group |
Etsy TSR vs Peer Group TSR
|
|
|
|
|
| Tabular List, Table |
| | | | | | | Performance Measure | What it Measures | GMS ($) | The dollar value of items sold in our marketplaces, excluding shipping fees and net of refunds, within the applicable period. | | Revenue ($) | Our revenue (determined on a consolidated basis) reported in Etsy's audited financial statements. | | Take rate | Our consolidated revenue divided by consolidated GMS. | | Adjusted EBITDA Margin (%) | Etsy's profitability from our operations calculated by dividing consolidated Adjusted EBITDA by consolidated revenue and expressed as a percentage. | | Relative TSR ($) | Our stock price performance, reflecting returns to our stockholders relative to the Nasdaq Composite constituents. |
|
|
|
|
|
| Total Shareholder Return Amount |
$ 31.16
|
29.73
|
45.56
|
67.33
|
123.06
|
| Peer Group Total Shareholder Return Amount |
176.01
|
151.87
|
123.64
|
99.29
|
124.76
|
| Net Income (Loss) |
$ 163,000,000
|
$ 303,000,000
|
$ 308,000,000
|
$ (694,000,000)
|
$ 494,000,000
|
| Company Selected Measure Amount |
2,884,000,000
|
2,808,000,000
|
2,748,000,000
|
2,566,000,000
|
2,329,000,000
|
| PEO Name |
Silverman
|
|
|
|
|
| Additional 402(v) Disclosure |
For purposes of the adjustments to determine “compensation actually paid,” we computed the fair value of stock option awards, RSUs, and PSUs in accordance with FASB ASC Topic 718 as of the end of the relevant fiscal year, other than the fair values of equity awards that vested in the Covered Year, which are valued as of the applicable vesting date. The fair value of the unvested PSUs is determined based on the probable outcome (as determined in accordance with FASB ASC Topic 718) as of the end of the relevant fiscal year. Reflects “net income (loss)” for each Covered Year as set forth in our Consolidated Statements of Operations included in our Form 10-K for each of the Covered Years. Reflects “revenue” for each Covered Year as set forth in our Consolidated Statements of Operations included in our Form 10-K for each of the Covered Years.
|
|
|
|
|
| Measure:: 1 |
|
|
|
|
|
| Pay vs Performance Disclosure |
|
|
|
|
|
| Name |
GMS ($)
|
|
|
|
|
| Measure:: 2 |
|
|
|
|
|
| Pay vs Performance Disclosure |
|
|
|
|
|
| Name |
Revenue ($)
|
|
|
|
|
| Measure:: 3 |
|
|
|
|
|
| Pay vs Performance Disclosure |
|
|
|
|
|
| Name |
Take rate
|
|
|
|
|
| Measure:: 4 |
|
|
|
|
|
| Pay vs Performance Disclosure |
|
|
|
|
|
| Name |
Adjusted EBITDA Margin (%)
|
|
|
|
|
| Measure:: 5 |
|
|
|
|
|
| Pay vs Performance Disclosure |
|
|
|
|
|
| Name |
Relative TSR ($)
|
|
|
|
|
| PEO |
|
|
|
|
|
| Pay vs Performance Disclosure |
|
|
|
|
|
| Adjustment to Compensation, Amount |
$ 1,554,976
|
|
|
|
|
| PEO | Aggregate Grant Date Fair Value of Equity Award Amounts Reported in Summary Compensation Table |
|
|
|
|
|
| Pay vs Performance Disclosure |
|
|
|
|
|
| Adjustment to Compensation, Amount |
(16,552,130)
|
|
|
|
|
| PEO | Year-end Fair Value of Equity Awards Granted in Covered Year that are Outstanding and Unvested |
|
|
|
|
|
| Pay vs Performance Disclosure |
|
|
|
|
|
| Adjustment to Compensation, Amount |
17,469,247
|
|
|
|
|
| PEO | Year-over-Year Change in Fair Value of Equity Awards Granted in Prior Years That are Outstanding and Unvested |
|
|
|
|
|
| Pay vs Performance Disclosure |
|
|
|
|
|
| Adjustment to Compensation, Amount |
(1,622,717)
|
|
|
|
|
| PEO | Vesting Date Fair Value of Equity Awards Granted and Vested in Covered Year |
|
|
|
|
|
| Pay vs Performance Disclosure |
|
|
|
|
|
| Adjustment to Compensation, Amount |
1,615,731
|
|
|
|
|
| PEO | Change in Fair Value as of Vesting Date of Prior Year Equity Awards Vested in Covered Year |
|
|
|
|
|
| Pay vs Performance Disclosure |
|
|
|
|
|
| Adjustment to Compensation, Amount |
(92,746)
|
|
|
|
|
| PEO | Change In Fair Value As Of Modification Date Of Equity Awards Modified In Covered Year [Member] |
|
|
|
|
|
| Pay vs Performance Disclosure |
|
|
|
|
|
| Adjustment to Compensation, Amount |
737,591
|
|
|
|
|
| Non-PEO NEO |
|
|
|
|
|
| Pay vs Performance Disclosure |
|
|
|
|
|
| Adjustment to Compensation, Amount |
829,094
|
|
|
|
|
| Non-PEO NEO | Aggregate Grant Date Fair Value of Equity Award Amounts Reported in Summary Compensation Table |
|
|
|
|
|
| Pay vs Performance Disclosure |
|
|
|
|
|
| Adjustment to Compensation, Amount |
(7,499,526)
|
|
|
|
|
| Non-PEO NEO | Year-end Fair Value of Equity Awards Granted in Covered Year that are Outstanding and Unvested |
|
|
|
|
|
| Pay vs Performance Disclosure |
|
|
|
|
|
| Adjustment to Compensation, Amount |
7,525,908
|
|
|
|
|
| Non-PEO NEO | Year-over-Year Change in Fair Value of Equity Awards Granted in Prior Years That are Outstanding and Unvested |
|
|
|
|
|
| Pay vs Performance Disclosure |
|
|
|
|
|
| Adjustment to Compensation, Amount |
14,456
|
|
|
|
|
| Non-PEO NEO | Vesting Date Fair Value of Equity Awards Granted and Vested in Covered Year |
|
|
|
|
|
| Pay vs Performance Disclosure |
|
|
|
|
|
| Adjustment to Compensation, Amount |
665,998
|
|
|
|
|
| Non-PEO NEO | Change in Fair Value as of Vesting Date of Prior Year Equity Awards Vested in Covered Year |
|
|
|
|
|
| Pay vs Performance Disclosure |
|
|
|
|
|
| Adjustment to Compensation, Amount |
$ 122,258
|
|
|
|
|