| Year | Summary Compensation Table Total for PEO (Current)(1) ($) | Compensation Actually Paid to PEO (Current)(2) ($) | Summary Compensation Table Total for PEO (Former)(1) ($) | Compensation Actually Paid to PEO (Former)(2) ($) | Average Summary Compensation Table Total for Non-PEO NEOs(3) ($) | Average Compensation Actually Paid to Non-PEO NEOs(2)(3) ($) | Value of Initial Fixed $100 Investment based on TSR(4) ($) | Net Loss(5) ($) | ||||||||||||||||||||||||
| 2025 | 2,306,511 | 1,520,277 | 585,479 | 450,151 | 740,235 | 571,477 | 51.32 | (37,562,606 | ) | |||||||||||||||||||||||
| 2024 | - | - | 1,693,865 | 1,168,356 | 523,739 | 455,023 | 112.35 | (9,664,547 | ) | |||||||||||||||||||||||
| 2023 | - | - | 909,645 | 784,310 | 707,875 | 657,924 | 82.36 | (4,303,197 | ) | |||||||||||||||||||||||
| 2025 | 2024 | 2023 | ||||||||||||||||||||||||||||||
| PEO | Former PEO | Non-PEO NEOs | PEO | Former PEO | Non-PEO NEOs | PEO | Non-PEO NEOs | |||||||||||||||||||||||||
| Summary Compensation Table Total ($) | 2,306,511 | 585,479 | 740,235 | 855,758 | 838,107 | 523,739 | 909,645 | 707,875 | ||||||||||||||||||||||||
| Adjustments | ||||||||||||||||||||||||||||||||
| Stock Awards ($) | (1,318,742 | ) | (262,485 | ) | (596,767 | ) | (338,091 | ) | (467,483 | ) | (271,267 | ) | (362,046 | ) | (175,006 | ) | ||||||||||||||||
| Fair Value of Equity Awards ($) | ||||||||||||||||||||||||||||||||
| Year-End Fair Value of Outstanding and Unvested Equity Awards Granted in the Covered Year | 880,575 | 175,919 | 330,916 | 358,958 | 210,687 | 257,333 | 287,207 | 173,319 | ||||||||||||||||||||||||
| Change in Fair Value of Outstanding and Unvested Equity Awards Granted in the Prior Year | (320,539 | ) | (43,205 | ) | (39,460 | ) | (61,098 | ) | (23,764 | ) | ||||||||||||||||||||||
| Change in Fair Value of Prior Year Equity Awards Vested in the Covered Year | (27,528 | ) | (48,762 | ) | (5,921 | ) | (21,640 | ) | (15,322 | ) | (53,960 | ) | (24,500 | ) | ||||||||||||||||||
| Fair Value on Vesting Date of Equity Awards Granted and Vested in the Covered Year | 103,014 | 64,562 | ||||||||||||||||||||||||||||||
| Fair Value of Equity Awards Granted in any Prior Year that Failed to Meet Vesting Conditions | (224,735 | ) | ||||||||||||||||||||||||||||||
| Total Adjustments for Fair Value of Equity Awards ($) | 532,508 | 127,157 | 428,009 | 358,958 | (78,893 | ) | 202,551 | 236,711 | 125,055 | |||||||||||||||||||||||
| Compensation Actually Paid ($) | 1,520,277 | 450,151 | 571,477 | 876,625 | 291,731 | 455,023 | 784,310 | 657,924 | ||||||||||||||||||||||||
| (3) | The dollar amounts reported in this column represent the average of the amounts reported for our NEOs as a group (excluding Messrs. Yon, Nixon and Fleming) in the “Total” column of the Summary Compensation Table in each applicable year. The names of each of the NEOs (excluding Messrs. Yon, Nixon and Fleming) included for purposes of calculating the average amounts in each applicable year are as follows: for 2025, Ms. Taylor and Messrs. Waldrop and Muppalla, for 2024, Messrs. McNeil and Waldrop, for 2023, Mr. McNeil. | |
| (4) | The amounts reported in this column reflect our cumulative total shareholder return (“TSR”) as of December 31 of each year presented, assuming an initial fixed $100 investment on December 30, 2022. Cumulative TSR is calculated by dividing the sum of the cumulative amount of dividends for the measurement period, assuming dividend reinvestment, and the difference between the Company’s share price at the end and the beginning of the measurement period by the Company’s share price at the beginning of the measurement period. No dividends were paid on stock or option awards in 2025, 2024 or 2023. | |
| (5) | The dollar amounts reported represent the amount of net loss attributable to the Company’s shareholders as reflected in our consolidated audited financial statements for the applicable year. |
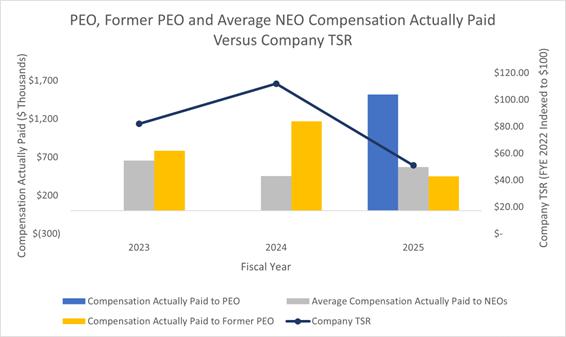
The following chart sets forth the relationship between compensation actually paid to our current PEO and former PEOs, the average of compensation actually paid to our non-PEO NEOs, and the Company’s cumulative TSR over the three most recently completed fiscal years.
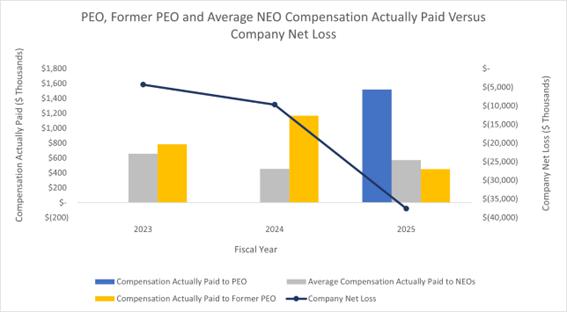
Compensation Actually Paid and Net Loss
The following chart sets forth the relationship between compensation actually paid to our current PEO and former PEOs, the average of compensation actually paid to our non-PEO NEOs, and our net loss during the three most recently completed fiscal years.
| [1] | The dollar amounts reported in this column represent the average of the amounts reported for our NEOs as a group (excluding Messrs. Yon, Nixon and Fleming) in the “Total” column of the Summary Compensation Table in each applicable year. The names of each of the NEOs (excluding Messrs. Yon, Nixon and Fleming) included for purposes of calculating the average amounts in each applicable year are as follows: for 2025, Ms. Taylor and Messrs. Waldrop and Muppalla, for 2024, Messrs. McNeil and Waldrop, for 2023, Mr. McNeil. |
| [2] | The dollar amounts reported in this column represent the amount of “compensation actually paid” to our current and former PEOs and our other NEOs (on average), as computed in accordance with Item 402(v) of Regulation S-K. “Compensation actually paid” is computed by subtracting the amounts in the “Stock Awards” column of the Summary Compensation Table for the applicable year from the “Total” column of the Summary Compensation Table for the applicable year and then, as applicable: (i) adding the fair value as of the end of the reported year of all awards granted during the reporting year that are outstanding and unvested as of the end of the reporting year; (ii) adding the amount equal to the change as of the end of the reporting year (from the end of the prior year) in fair value (whether positive or negative) of any awards granted in any prior year that are outstanding and unvested as of the end of the reporting year; (iii) adding, for awards that are granted and vest in the reporting year, the fair value as of the vesting date; (iv) adding the amount equal to the change as of the vesting date (from the end of the prior fiscal year) in fair value (whether positive or negative) of any awards granted in any prior year for which all applicable vesting conditions were satisfied at the end of or during the reporting year; (v) subtracting, for any awards granted in any prior year that fail to meet the applicable vesting conditions during the reporting year, the amount equal to the fair value at the end of the prior year and (vi) adding the dollar value of any dividends or other earnings paid on stock or option awards in the applicable year prior to the vesting date that are not otherwise reflected in the fair value of such award or included in any other component of total compensation for the applicable year. The following table reflects the adjustments made to compute “compensation actually paid”: |
| [3] | The amounts reported in this column reflect our cumulative total shareholder return (“TSR”) as of December 31 of each year presented, assuming an initial fixed $100 investment on December 30, 2022. Cumulative TSR is calculated by dividing the sum of the cumulative amount of dividends for the measurement period, assuming dividend reinvestment, and the difference between the Company’s share price at the end and the beginning of the measurement period by the Company’s share price at the beginning of the measurement period. No dividends were paid on stock or option awards in 2025, 2024 or 2023. |
| [4] | The dollar amounts reported represent the amount of net loss attributable to the Company’s shareholders as reflected in our consolidated audited financial statements for the applicable year. |
| [5] | The dollar amounts reported in this column are the amounts of total compensation reported in the “Total” column of the Summary Compensation Table for the 2023, 2024 and 2025 fiscal years for the persons who served as our principal executive officer (“PEO”) for the applicable year. Zachary B. Fleming served as our PEO from January 2022 to May 2024, and Mr. Nixon served as our PEO from May 2024 until his resignation in September 2025. Mr. Fleming’s compensation information for 2023 and 2024 and Mr. Nixon’s compensation information for 2024 and 2025 are included in this table as former PEOs in accordance with Item 402(v) of Regulation S-K. Effective September 2025, Mr. Yon was appointed as President and Chief Executive Officer, and since such date, has performed the duties of PEO. For additional information, see “Executive Compensation—Summary Compensation Table.” |