Pay vs Performance Disclosure
Dec. 31, 2025
USD ($)
Dec. 31, 2024
USD ($)
Dec. 31, 2023
USD ($)
Dec. 31, 2022
USD ($)
Dec. 31, 2021
USD ($)
| Value of Initial Fixed $100 Investment Based On: | ||||||||||||||||||||||||||||||||||||||||||||||||||
| Year (1)(2) | Summary Compensation Table Total for CEO | Compensation Actually Paid to CEO (3) | Average Summary Compensation Table Total for Non-CEO NEOs | Average Compensation Actually Paid to Non-CEO NEOs (3) | ZLAB TSR (4) | Peer Group TSR (4) | Net Income (Loss) (in millions) | Revenue Growth (5) | ||||||||||||||||||||||||||||||||||||||||||
| $ | $ | $ | $ | $ | $ | $ | % | |||||||||||||||||||||||||||||||||||||||||||
2025 | 10,677,221 | 1,862,002 | 3,795,163 | 637,778 | 13.03 | 124.75 | (175.5) | 15 | ||||||||||||||||||||||||||||||||||||||||||
| 2024 | 9,079,948 | 12,068,380 | 3,622,883 | 4,795,968 | 19.35 | 93.49 | (257.1) | 50 | ||||||||||||||||||||||||||||||||||||||||||
| 2023 | 12,042,285 | 7,520,941 | 3,887,222 | 2,298,340 | 20.19 | 94.03 | (334.6) | 24 | ||||||||||||||||||||||||||||||||||||||||||
| 2022 | 20,212,141 | 739,598 | 6,838,043 | 3,550,025 | 22.68 | 89.90 | (443.3) | 49 | ||||||||||||||||||||||||||||||||||||||||||
| 2021 | 15,315,579 | (30,500,547) | 6,176,702 | (4,953,682) | 46.44 | 100.02 | (704.5) | 195 | ||||||||||||||||||||||||||||||||||||||||||
2025: Yajing Chen, Rafael Amado, F. Ty Edmonson, and Josh Smiley;
2024: Yajing Chen, Rafael Amado, F. Ty Edmonson, and Josh Smiley;
2023: Yajing Chen, Rafael Amado, Harald Reinhart, Josh Smiley, and Billy Cho;
2022: Billy Cho, Rafael Amado, Harald Reinhart, Alan Bart Sandler, and Josh Smiley; and
2021: Billy Cho, F. Ty Edmondson, Harald Reinhart, and Alan Bart Sandler.
CEO | ||||||||||||||||||||||||||||||||
| 2025 | 2024 | 2023 | 2022 | 2021 | ||||||||||||||||||||||||||||
| $ | $ | $ | $ | $ | ||||||||||||||||||||||||||||
Summary Compensation Table Total | 10,677,221 | 9,079,948 | 12,042,285 | 20,212,141 | 15,315,579 | |||||||||||||||||||||||||||
Adjustments for Stock and Option Awards* | ||||||||||||||||||||||||||||||||
Adjustment for grant date fair values in the Summary Compensation Table | (9,055,813) | (7,319,338) | (10,343,463) | (18,545,040) | (13,672,864) | |||||||||||||||||||||||||||
Year-end fair value of unvested awards granted in the covered fiscal year | 3,775,382 | 12,936,922 | 7,756,321 | 13,913,094 | 3,708,060 | |||||||||||||||||||||||||||
Year-over-year difference of year-end fair values for unvested awards granted in prior years that remained outstanding at the covered fiscal year end | (7,373,436) | (458,907) | (2,184,985) | (10,827,207) | (36,638,677) | |||||||||||||||||||||||||||
Fair values at vest date for awards granted and vested in covered fiscal year | — | — | — | — | — | |||||||||||||||||||||||||||
Difference in fair values between prior year-end fair values and vest date fair values for awards granted in prior years and vesting in the covered fiscal year | 3,838,648 | (2,170,245) | 250,783 | (4,013,390) | 787,355 | |||||||||||||||||||||||||||
Forfeitures during covered year equal to prior year-end fair value | — | — | — | — | — | |||||||||||||||||||||||||||
Incremental fair value resulting from modifications of stock options and RSUs in the covered fiscal year not reflected in the other rows | — | — | — | — | — | |||||||||||||||||||||||||||
Compensation Actually Paid (as calculated) | 1,862,002 | 12,068,380 | 7,520,941 | 739,598 | (30,500,547) | |||||||||||||||||||||||||||
Average Non-CEO NEO | ||||||||||||||||||||||||||||||||
| 2025 | 2024 | 2023 | 2022 | 2021 | ||||||||||||||||||||||||||||
| $ | $ | $ | $ | $ | ||||||||||||||||||||||||||||
Summary Compensation Table Total | 3,795,163 | 3,622,883 | 3,887,222 | 6,838,043 | 6,176,702 | |||||||||||||||||||||||||||
Adjustments for Stock and Option Awards* | ||||||||||||||||||||||||||||||||
Adjustment for grant date fair values in the Summary Compensation Table | (2,899,972) | (2,681,878) | (2,879,951) | (6,059,426) | (5,279,647) | |||||||||||||||||||||||||||
Year-end fair value of unvested awards granted in the covered fiscal year | 1,186,372 | 4,416,161 | 1,764,936 | 4,783,831 | 1,299,614 | |||||||||||||||||||||||||||
Year-over-year difference of year-end fair values for unvested awards granted in prior years that remained outstanding at the covered fiscal year end | (2,289,089) | (119,636) | (462,102) | (1,408,060) | (7,338,300) | |||||||||||||||||||||||||||
Fair values at vest date for awards granted and vested in covered fiscal year | — | — | — | — | 259,613 | |||||||||||||||||||||||||||
Difference in fair values between prior year-end fair values and vest date fair values for awards granted in prior years and vesting in the covered fiscal year | 845,304 | (441,562) | (42,600) | (604,363) | (71,664) | |||||||||||||||||||||||||||
Forfeitures during covered fiscal year equal to prior year-end fair value | — | — | (419,154) | — | — | |||||||||||||||||||||||||||
Incremental fair value resulting from modifications of stock options and RSUs in the covered fiscal year not reflected in the other rows | — | — | 449,989 | — | — | |||||||||||||||||||||||||||
Compensation Actually Paid (as calculated) | 637,778 | 4,795,968 | 2,298,340 | 3,550,025 | (4,953,682) | |||||||||||||||||||||||||||
*Adjustments are calculated using the same methodology as used in the Company’s financial statements under generally accepted accounting principles and, for awards subject to performance-based vesting conditions, based on the probable outcome of such performance-based vesting conditions as of the last day of the applicable fiscal year.
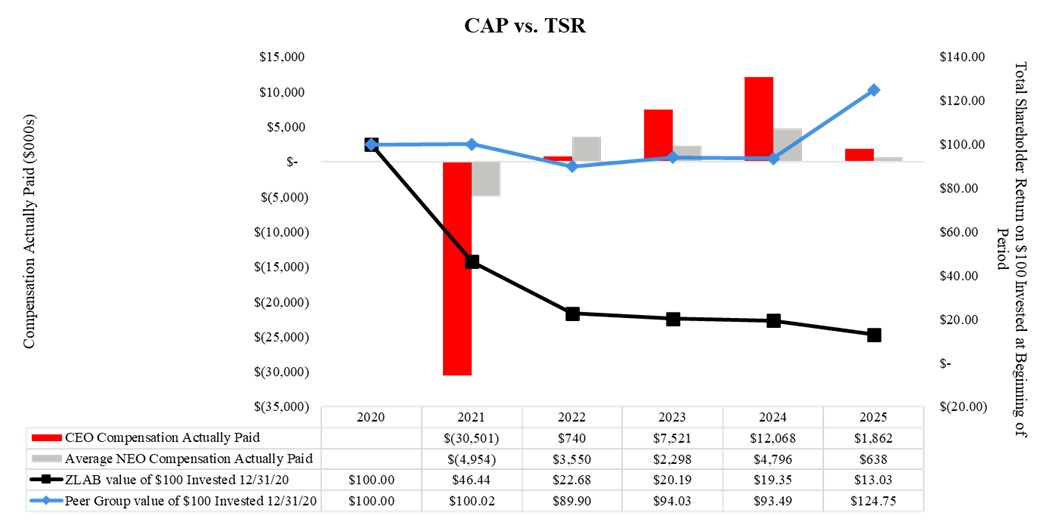
The illustrations below provide a graphical description of CAP (as calculated in accordance with the SEC rules) compared to: (1) our cumulative TSR and the cumulative TSR of the Peer Group, (2) our net income, and (3) revenue growth. Since a significant portion of compensation for our CEO and other named executive officers consists of equity awards, the change in value of Compensation Actually Paid is directionally aligned with changes in our TSR, net income, and revenue growth.
CAP Versus Cumulative TSR for the Company and Cumulative TSR of the Peer Group
The illustrations below provide a graphical description of CAP (as calculated in accordance with the SEC rules) compared to: (1) our cumulative TSR and the cumulative TSR of the Peer Group, (2) our net income, and (3) revenue growth. Since a significant portion of compensation for our CEO and other named executive officers consists of equity awards, the change in value of Compensation Actually Paid is directionally aligned with changes in our TSR, net income, and revenue growth.
CAP Versus Net Income
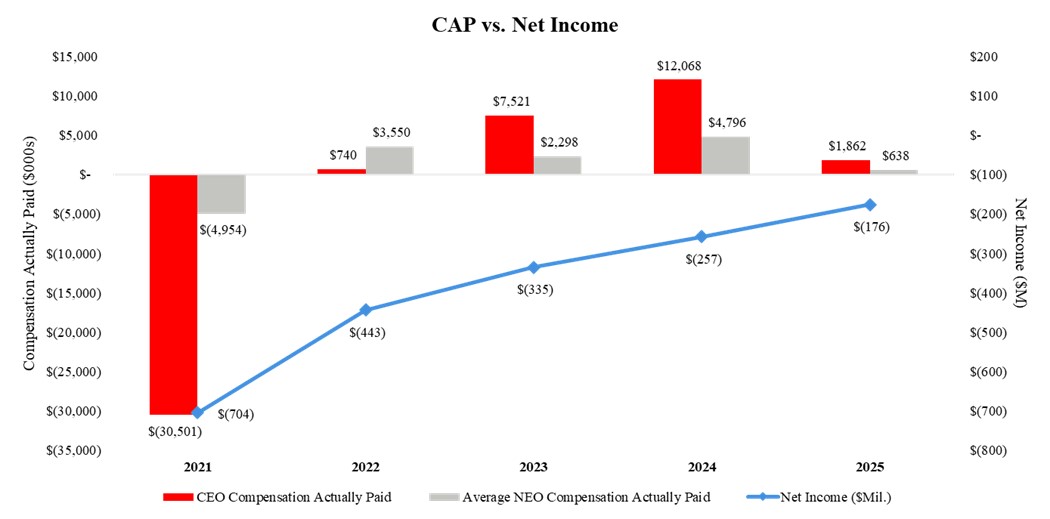
The illustrations below provide a graphical description of CAP (as calculated in accordance with the SEC rules) compared to: (1) our cumulative TSR and the cumulative TSR of the Peer Group, (2) our net income, and (3) revenue growth. Since a significant portion of compensation for our CEO and other named executive officers consists of equity awards, the change in value of Compensation Actually Paid is directionally aligned with changes in our TSR, net income, and revenue growth.
CAP Versus Revenue Growth
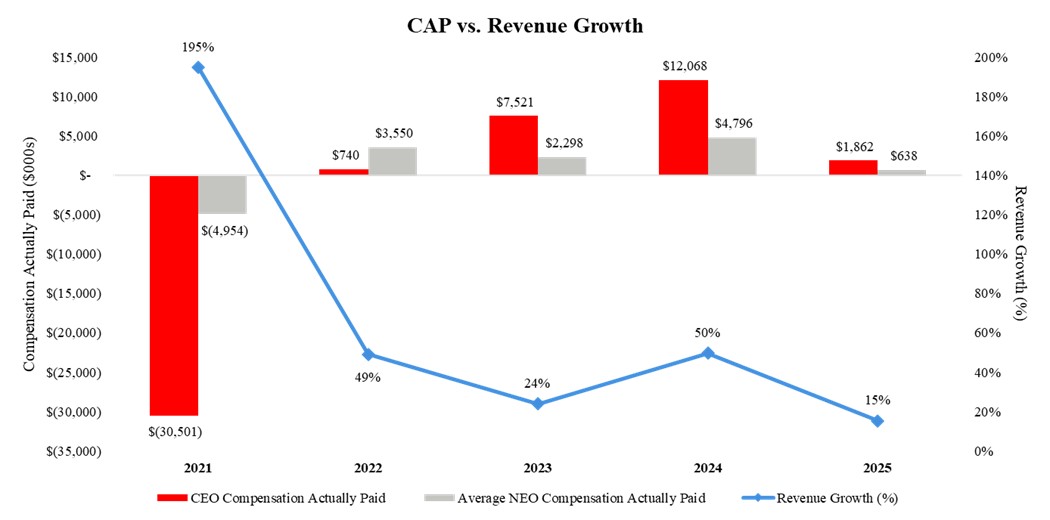
The illustrations below provide a graphical description of CAP (as calculated in accordance with the SEC rules) compared to: (1) our cumulative TSR and the cumulative TSR of the Peer Group, (2) our net income, and (3) revenue growth. Since a significant portion of compensation for our CEO and other named executive officers consists of equity awards, the change in value of Compensation Actually Paid is directionally aligned with changes in our TSR, net income, and revenue growth.
CAP Versus Cumulative TSR for the Company and Cumulative TSR of the Peer Group
•Product revenues
•Operating Profit (Loss)