Pay vs Performance Disclosure
pure in Millions
pure in Millions
Dec. 31, 2025
USD ($)
Dec. 31, 2024
USD ($)
Dec. 31, 2023
USD ($)
Dec. 31, 2022
USD ($)
Dec. 31, 2021
USD ($)
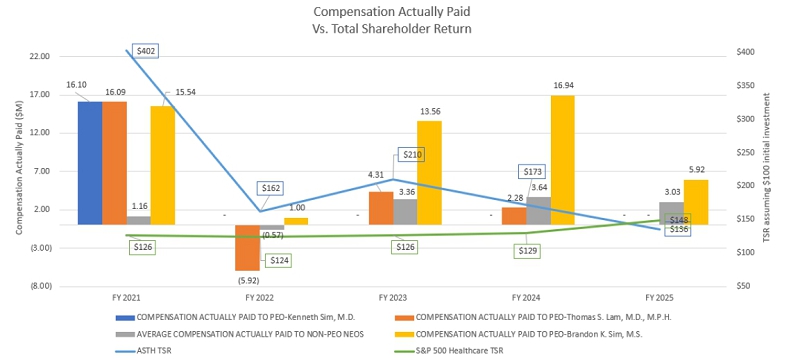
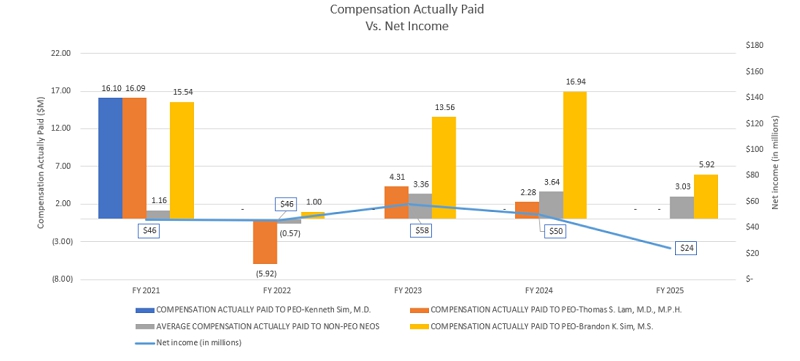
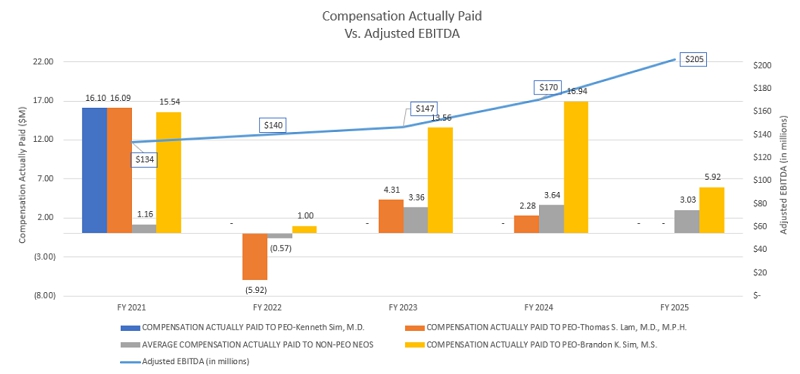
| SCT Total For PEO #1 | CAP to PEO #1 | SCT Total For PEO #2 | CAP to PEO #2 | SCT Total For PEO #3 | CAP to PEO #3 | Average SCT | Average | Value of Initial Fixed $100 Investment Based on TSR of: | Net Income | Adjusted EBITDA (6) | ||||||||||||||
| Year | Brandon K. Sim, M.S.(1)(2) ($) | Thomas S. Lam, M.D., M.P.H (1)(2) ($) | Kenneth Sim, M.D.(1)(2) ($) | Total For Non-PEO NEOs(3) ($) | CAP To Non-PEO NEOs(2)(3) ($) | ASTH(4) ($) | S&P 500 Healthcare Index(4)(5) ($) | ($) (in millions) | ||||||||||||||||
| 2025 | 14,930,231 | 5,919,557 | 3,074,981 | 3,027,816 | 136 | 148 | 24 | 205 | ||||||||||||||||
| 2024 | 18,242,585 | 16,942,570 | 2,843,062 | 2,279,000 | 6,666,617 | 3,644,213 | 173 | 129 | 50 | 170 | ||||||||||||||
| 2023 | 14,311,250 | 13,561,755 | 5,217,562 | 4,314,127 | 3,827,960 | 3,356,039 | 210 | 126 | 58 | 147 | ||||||||||||||
| 2022 | 15,302,775 | 997,261 | 1,487,709 | (5,920,199) | 1,667,352 | (574,925) | 162 | 124 | 46 | 140 | ||||||||||||||
| 2021 | 9,006,157 | 15,536,119 | 6,857,194 | 16,090,110 | 6,863,527 | 16,096,441 | 688,309 | 1,155,454 | 402 | 126 | 46 | 134 | ||||||||||||
| (1) | The PEOs shown in the table above for each applicable fiscal year are as follows: |
| Year | PEOs | |
| 2025 | Brandon K. Sim, M.S. | |
| 2024 | Brandon K. Sim, M.S. and Thomas Lam, M.D., M.P.H | |
| 2023 | Brandon K. Sim, M.S. and Thomas Lam, M.D., M.P.H | |
| 2022 | Brandon K. Sim, M.S. and Thomas Lam, M.D., M.P.H | |
| 2021 | Kenneth Sim, M.D., Brandon K. Sim, M.S., and Thomas Lam, M.D., M.P.H. |
| (2) | As the valuation methods for compensation actually paid (“CAP”) required by the SEC differ from those required in the Summary Compensation Table (“SCT”), the tables below provide a reconciliation of the SCT amounts to the CAP amounts in the Pay Versus Performance table for the PEOs and Non-PEO NEOs for each of the last five fiscal years. |
| (3) | The Non-PEO NEOs shown in the table above for each applicable fiscal year are as follows: |
| Year | Non-PEO NEOs | |
| 2025 | Kenneth Sim, M.D., Chandan Basho, M.B.A., and Dinesh Kumar, M.D. | |
| 2024 | Kenneth Sim, M.D., Chandan Basho, M.B.A., Dinesh Kumar, M.D., and Albert Young, M.D., M.P.H. | |
| 2023 | Kenneth Sim, M.D., Chandan Basho, M.B.A., and Albert Young, M.D., M.P.H. | |
| 2022 | Kenneth Sim, M.D., Chandan Basho, M.B.A., Albert Young, M.D., M.P.H., and Eric Chin | |
| 2021 | Eric Chin and Albert Young, M.D., M.P.H. |
| (4) | Pursuant to the SEC rules, total stockholder return, or TSR, reflects an initial investment of $100 on December 31, 2020. |
| (5) | The peer group of the listed fiscal year consists of the S&P 500 Healthcare Index. |
| (6) | The company selected measure is Adjusted EBITDA. |
Summary Compensation Table to Compensation Actually Paid Reconciliation Table
| PEO #1 Brandon K. Sim, M.S. | ||||||||||||||
| 2025 | 2024 | 2023 | 2022 | 2021 | ||||||||||
| Total Reported in Summary Compensation Table (SCT) | $ | 14,930,231 | $ | 18,242,585 | $ | 14,311,250 | $ | 15,302,775 | $ | 9,006,157 | ||||
| Less, Value of Stock & Option Awards Reported in SCT(1) | (11,999,980) | (15,893,226) | (12,499,943) | (13,567,843) | (7,816,831) | |||||||||
| Plus, Year-End Value of Awards Granted in Fiscal Year That Are Unvested and Outstanding | 3,161,712 | 7,192,781 | 9,243,092 | 6,778,744 | 13,976,639 | |||||||||
| Plus, Change in Fair Value of Prior Year Awards That Are Outstanding and Unvested | 1,163,625 | 5,477,073 | 1,821,347 | (5,032,202) | ||||||||||
| Plus, FMV of Awards Granted this Year That Vested This Year | 540,689 | 826,136 | 527,597 | |||||||||||
| Plus, Change in Fair Value (from Prior Year-End) of Prior Year Awards That Vested This Year | (1,876,720) | 1,097,221 | 158,412 | (2,484,213) | 370,154 | |||||||||
| Less, Prior Year Fair Value of Prior Year Awards That Failed to Vest this Year | ||||||||||||||
| Plus, Dividends or Earnings Paid on Awards Not Otherwise Reflected in Fair Value | ||||||||||||||
| Compensation Actually Paid | $ | 5,919,557 | $ | 16,942,570 | $ | 13,561,755 | $ | 997,261 | $ | 15,536,119 | ||||
| PEO #2 Thomas S. Lam, M.D., M.P.H. | |||||||||||
| 2024 | 2023 | 2022 | 2021 | ||||||||
| Total Reported in Summary Compensation Table (SCT) | $ | 2,843,062 | $ | 5,217,562 | $ | 1,487,709 | $ | 6,857,194 | |||
| Less, Value of Stock & Option Awards Reported in SCT(1) | (1,878,400) | (3,253,500) | (5,777,307) | ||||||||
| Plus, Year-End Value of Awards Granted in Fiscal Year That Are Unvested and Outstanding | 420,389 | 2,298,000 | 5,875,821 | ||||||||
| Plus, Change in Fair Value of Prior Year Awards That Are Outstanding and Unvested | 539,700 | 171,330 | (3,852,379) | 4,920,552 | |||||||
| Plus, FMV of Awards Granted this Year That Vested this Year | |||||||||||
| Plus, Change in Fair Value (from Prior Year-End) of Prior Year Awards That Vested This Year | 354,249 | (119,265) | (3,555,529) | 4,213,850 | |||||||
| Less, Prior Year Fair Value of Prior Year Awards That Failed to Vest This Year | |||||||||||
| Plus, Dividends or Earnings Paid on Awards not Otherwise Reflected in Fair Value | |||||||||||
| Compensation Actually Paid | $ | 2,279,000 | $ | 4,314,127 | $ | (5,920,199) | $ | 16,090,110 | |||
| PEO #3 Kenneth Sim, M.D. | ||
| 2021 | ||
| Total Reported in Summary Compensation Table (SCT) | $ | 6,863,527 |
| Less, Value of Stock & Option Awards Reported in SCT(1) | (5,777,307) | |
| Plus, Year-End Value of Awards Granted in Fiscal Year That Are Unvested and Outstanding | 5,875,819 | |
| Plus, Change in Fair Value of Prior Year Awards That Are Outstanding and Unvested | 4,920,552 | |
| Plus, FMV of Awards Granted this Year That Vested This Year | ||
| Plus, Change in Fair Value (from Prior Year-End) of Prior Year Awards That Vested This Year | 4,213,850 | |
| Less, Prior Year Fair Value of Prior Year Awards That Failed to Vest This Year | ||
| Plus, Dividends or Earnings Paid on Awards not Otherwise Reflected in Fair Value | ||
| Compensation Actually Paid | $ | 16,096,441 |
| Average NEOs | ||||||||||||||
| 2025 | 2024 | 2023 | 2022 | 2021 | ||||||||||
| Total Reported in Summary Compensation Table (SCT) | $ | 3,074,981 | $ | 6,666,617 | $ | 3,827,960 | $ | 1,667,352 | $ | 688,309 | ||||
| Less, Value of Stock & Option Awards Reported in SCT(1) | (1,466,665) | (5,573,539) | (2,617,300) | (880,452) | (205,730) | |||||||||
| Plus, Year-End Value of Awards Granted in Fiscal Year That Are Unvested and Outstanding | 386,441 | 2,299,412 | 1,818,867 | 524,690 | 652,802 | |||||||||
| Plus, Change in Fair Value of Prior Year Awards That Are Outstanding and Unvested | 1,050,971 | 25,600 | 180,624 | (956,215) | 17,308 | |||||||||
| Plus, FMV of Awards Granted This Year That Vested This Year | 66,073 | 93,191 | 155,544 | 77,967 | ||||||||||
| Plus, Change in Fair Value (from Prior Year-End) of Prior Year Awards That Vested This year | (83,985) | 132,932 | (9,656) | (1,008,267) | 2,765 | |||||||||
| Less, Prior Year Fair Value of Prior Year Awards That Failed to Vest This Year | ||||||||||||||
| Plus, Dividends or Earnings Paid on Awards Not Otherwise Reflected in Fair Value | ||||||||||||||
| Compensation Actually Paid | $ | 3,027,816 | $ | 3,644,213 | $ | 3,356,039 | $ | (574,925) | $ | 1,155,454 | ||||
| (1) | Stock option fair values are calculated at each measurement date using a Black-Scholes valuation model, consistent with the approach used to value the awards at the grant date. Stock option fair values as of each measurement date were determined using updated assumptions (the closing stock price of our common stock as of the measurement date, risk-free interest rate, expected life, expected volatility of the price of our common stock, and expected dividend yield) and fair value increases are primarily driven by an increase in the price of the Company’s common stock. |
| (1) | The PEOs shown in the table above for each applicable fiscal year are as follows: |
| Year | PEOs | |
| 2025 | Brandon K. Sim, M.S. | |
| 2024 | Brandon K. Sim, M.S. and Thomas Lam, M.D., M.P.H | |
| 2023 | Brandon K. Sim, M.S. and Thomas Lam, M.D., M.P.H | |
| 2022 | Brandon K. Sim, M.S. and Thomas Lam, M.D., M.P.H | |
| 2021 | Kenneth Sim, M.D., Brandon K. Sim, M.S., and Thomas Lam, M.D., M.P.H. |
| (3) | The Non-PEO NEOs shown in the table above for each applicable fiscal year are as follows: |
| Year | Non-PEO NEOs | |
| 2025 | Kenneth Sim, M.D., Chandan Basho, M.B.A., and Dinesh Kumar, M.D. | |
| 2024 | Kenneth Sim, M.D., Chandan Basho, M.B.A., Dinesh Kumar, M.D., and Albert Young, M.D., M.P.H. | |
| 2023 | Kenneth Sim, M.D., Chandan Basho, M.B.A., and Albert Young, M.D., M.P.H. | |
| 2022 | Kenneth Sim, M.D., Chandan Basho, M.B.A., Albert Young, M.D., M.P.H., and Eric Chin | |
| 2021 | Eric Chin and Albert Young, M.D., M.P.H. |
| (5) | The peer group of the listed fiscal year consists of the S&P 500 Healthcare Index. |
| (1) | The PEOs shown in the table above for each applicable fiscal year are as follows: |
| Year | PEOs | |
| 2025 | Brandon K. Sim, M.S. | |
| 2024 | Brandon K. Sim, M.S. and Thomas Lam, M.D., M.P.H | |
| 2023 | Brandon K. Sim, M.S. and Thomas Lam, M.D., M.P.H | |
| 2022 | Brandon K. Sim, M.S. and Thomas Lam, M.D., M.P.H | |
| 2021 | Kenneth Sim, M.D., Brandon K. Sim, M.S., and Thomas Lam, M.D., M.P.H. |
Summary Compensation Table to Compensation Actually Paid Reconciliation Table
| PEO #1 Brandon K. Sim, M.S. | ||||||||||||||
| 2025 | 2024 | 2023 | 2022 | 2021 | ||||||||||
| Total Reported in Summary Compensation Table (SCT) | $ | 14,930,231 | $ | 18,242,585 | $ | 14,311,250 | $ | 15,302,775 | $ | 9,006,157 | ||||
| Less, Value of Stock & Option Awards Reported in SCT(1) | (11,999,980) | (15,893,226) | (12,499,943) | (13,567,843) | (7,816,831) | |||||||||
| Plus, Year-End Value of Awards Granted in Fiscal Year That Are Unvested and Outstanding | 3,161,712 | 7,192,781 | 9,243,092 | 6,778,744 | 13,976,639 | |||||||||
| Plus, Change in Fair Value of Prior Year Awards That Are Outstanding and Unvested | 1,163,625 | 5,477,073 | 1,821,347 | (5,032,202) | ||||||||||
| Plus, FMV of Awards Granted this Year That Vested This Year | 540,689 | 826,136 | 527,597 | |||||||||||
| Plus, Change in Fair Value (from Prior Year-End) of Prior Year Awards That Vested This Year | (1,876,720) | 1,097,221 | 158,412 | (2,484,213) | 370,154 | |||||||||
| Less, Prior Year Fair Value of Prior Year Awards That Failed to Vest this Year | ||||||||||||||
| Plus, Dividends or Earnings Paid on Awards Not Otherwise Reflected in Fair Value | ||||||||||||||
| Compensation Actually Paid | $ | 5,919,557 | $ | 16,942,570 | $ | 13,561,755 | $ | 997,261 | $ | 15,536,119 | ||||
| PEO #2 Thomas S. Lam, M.D., M.P.H. | |||||||||||
| 2024 | 2023 | 2022 | 2021 | ||||||||
| Total Reported in Summary Compensation Table (SCT) | $ | 2,843,062 | $ | 5,217,562 | $ | 1,487,709 | $ | 6,857,194 | |||
| Less, Value of Stock & Option Awards Reported in SCT(1) | (1,878,400) | (3,253,500) | (5,777,307) | ||||||||
| Plus, Year-End Value of Awards Granted in Fiscal Year That Are Unvested and Outstanding | 420,389 | 2,298,000 | 5,875,821 | ||||||||
| Plus, Change in Fair Value of Prior Year Awards That Are Outstanding and Unvested | 539,700 | 171,330 | (3,852,379) | 4,920,552 | |||||||
| Plus, FMV of Awards Granted this Year That Vested this Year | |||||||||||
| Plus, Change in Fair Value (from Prior Year-End) of Prior Year Awards That Vested This Year | 354,249 | (119,265) | (3,555,529) | 4,213,850 | |||||||
| Less, Prior Year Fair Value of Prior Year Awards That Failed to Vest This Year | |||||||||||
| Plus, Dividends or Earnings Paid on Awards not Otherwise Reflected in Fair Value | |||||||||||
| Compensation Actually Paid | $ | 2,279,000 | $ | 4,314,127 | $ | (5,920,199) | $ | 16,090,110 | |||
| PEO #3 Kenneth Sim, M.D. | ||
| 2021 | ||
| Total Reported in Summary Compensation Table (SCT) | $ | 6,863,527 |
| Less, Value of Stock & Option Awards Reported in SCT(1) | (5,777,307) | |
| Plus, Year-End Value of Awards Granted in Fiscal Year That Are Unvested and Outstanding | 5,875,819 | |
| Plus, Change in Fair Value of Prior Year Awards That Are Outstanding and Unvested | 4,920,552 | |
| Plus, FMV of Awards Granted this Year That Vested This Year | ||
| Plus, Change in Fair Value (from Prior Year-End) of Prior Year Awards That Vested This Year | 4,213,850 | |
| Less, Prior Year Fair Value of Prior Year Awards That Failed to Vest This Year | ||
| Plus, Dividends or Earnings Paid on Awards not Otherwise Reflected in Fair Value | ||
| Compensation Actually Paid | $ | 16,096,441 |
| (1) | Stock option fair values are calculated at each measurement date using a Black-Scholes valuation model, consistent with the approach used to value the awards at the grant date. Stock option fair values as of each measurement date were determined using updated assumptions (the closing stock price of our common stock as of the measurement date, risk-free interest rate, expected life, expected volatility of the price of our common stock, and expected dividend yield) and fair value increases are primarily driven by an increase in the price of the Company’s common stock. |
| (3) | The Non-PEO NEOs shown in the table above for each applicable fiscal year are as follows: |
| Year | Non-PEO NEOs | |
| 2025 | Kenneth Sim, M.D., Chandan Basho, M.B.A., and Dinesh Kumar, M.D. | |
| 2024 | Kenneth Sim, M.D., Chandan Basho, M.B.A., Dinesh Kumar, M.D., and Albert Young, M.D., M.P.H. | |
| 2023 | Kenneth Sim, M.D., Chandan Basho, M.B.A., and Albert Young, M.D., M.P.H. | |
| 2022 | Kenneth Sim, M.D., Chandan Basho, M.B.A., Albert Young, M.D., M.P.H., and Eric Chin | |
| 2021 | Eric Chin and Albert Young, M.D., M.P.H. |
| Average NEOs | ||||||||||||||
| 2025 | 2024 | 2023 | 2022 | 2021 | ||||||||||
| Total Reported in Summary Compensation Table (SCT) | $ | 3,074,981 | $ | 6,666,617 | $ | 3,827,960 | $ | 1,667,352 | $ | 688,309 | ||||
| Less, Value of Stock & Option Awards Reported in SCT(1) | (1,466,665) | (5,573,539) | (2,617,300) | (880,452) | (205,730) | |||||||||
| Plus, Year-End Value of Awards Granted in Fiscal Year That Are Unvested and Outstanding | 386,441 | 2,299,412 | 1,818,867 | 524,690 | 652,802 | |||||||||
| Plus, Change in Fair Value of Prior Year Awards That Are Outstanding and Unvested | 1,050,971 | 25,600 | 180,624 | (956,215) | 17,308 | |||||||||
| Plus, FMV of Awards Granted This Year That Vested This Year | 66,073 | 93,191 | 155,544 | 77,967 | ||||||||||
| Plus, Change in Fair Value (from Prior Year-End) of Prior Year Awards That Vested This year | (83,985) | 132,932 | (9,656) | (1,008,267) | 2,765 | |||||||||
| Less, Prior Year Fair Value of Prior Year Awards That Failed to Vest This Year | ||||||||||||||
| Plus, Dividends or Earnings Paid on Awards Not Otherwise Reflected in Fair Value | ||||||||||||||
| Compensation Actually Paid | $ | 3,027,816 | $ | 3,644,213 | $ | 3,356,039 | $ | (574,925) | $ | 1,155,454 | ||||
| (1) | Stock option fair values are calculated at each measurement date using a Black-Scholes valuation model, consistent with the approach used to value the awards at the grant date. Stock option fair values as of each measurement date were determined using updated assumptions (the closing stock price of our common stock as of the measurement date, risk-free interest rate, expected life, expected volatility of the price of our common stock, and expected dividend yield) and fair value increases are primarily driven by an increase in the price of the Company’s common stock. |
| Most Important Financial Performance Measures |
| Adjusted EBITDA |
| Revenue |
| (6) | The company selected measure is Adjusted EBITDA. |