Pay vs Performance Disclosure - USD ($)
Dec. 31, 2025
Dec. 31, 2024
Dec. 31, 2023
Dec. 31, 2022
Dec. 31, 2021
| Year | Summary compensation table total for Current PEO ($)(1) | Compensation actually paid to Current PEO ($)(2) | Summary compensation table total for Former PEO ($)(1) | Compensation actually paid to Former PEO ($)(2) | Average summary compensation table total for non-PEO NEOs ($)(3) | Average compensation actually paid to non-PEO NEOs ($)(4) | Value of initial fixed $100 investment based on: | Net (loss) income ($ millions)(7) | Company selected measure Adjusted EBITDA ($ millions)(8) | |||||||||||||||||||||||
TSR ($)(5) | Line of Business Index ($)(6) | |||||||||||||||||||||||||||||||
| 2025 | 8,037,750 | 47,911,574 | N/A | N/A | 1,974,405 | 15,045,819 | 229.42 | 126.74 | (206.4) | 331.7 | ||||||||||||||||||||||
| 2024 | 4,104,027 | 21,856,327 | N/A | N/A | 2,110,263 | 9,321,753 | 106.50 | 110.66 | (5.9) | 280.3 | ||||||||||||||||||||||
| 2023 | 9,422,241 | 4,722,241 | 1,093,432 | (5,729,362) | 511,969 | (111,428) | 38.33 | 109.55 | 67.5 | 96.8 | ||||||||||||||||||||||
| 2022 | N/A | N/A | 1,796,098 | (7,811,044) | 1,410,613 | (4,958,666) | 76.17 | 91.30 | 91.8 | 125.4 | ||||||||||||||||||||||
| 2021 | N/A | N/A | 19,707,358 | 22,167,685 | 7,728,776 | 8,195,588 | 115.75 | 97.22 | (661.5) | 141.4 | ||||||||||||||||||||||
| Year | Summary compensation table total for PEO ($) | Less | Reported Value of Equity Awards ($)(a) | Plus | Equity Awards Adjustment ($)(b) | Equals | CAP for PEO ($) | ||||||||||||||||
| 2025 (Current PEO) | 8,037,750 | - | 6,267,300 | + | 46,141,124 | = | 47,911,574 | ||||||||||||||||
| 2024 (Current PEO) | 4,104,027 | - | 2,580,000 | + | 20,332,300 | = | 21,856,327 | ||||||||||||||||
| 2023 (Current PEO) | 9,422,241 | - | 8,440,000 | + | 3,740,000 | = | 4,722,241 | ||||||||||||||||
| 2023 (Former PEO) | 1,093,432 | - | — | + | (6,822,794) | = | (5,729,362) | ||||||||||||||||
| 2022 (Former PEO) | 1,796,098 | - | — | + | (9,607,142) | = | (7,811,044) | ||||||||||||||||
| 2021 (Former PEO) | 19,707,358 | - | 18,990,125 | + | 21,450,452 | = | 22,167,685 | ||||||||||||||||
(a)The dollar amounts reported represent the grant date fair value of equity awards as reported in the “Option Awards” column of the SCT in each applicable year.
(b)The equity award adjustments were calculated in accordance with Item 402(v) of Regulation S-K and include: (i) the year-end fair value of any equity awards granted in the applicable year that are outstanding and unvested as of the end of the year; (ii) the amount of change as of the end of the applicable year (from the end of the prior year) in fair value of any awards granted in prior years that are outstanding and unvested as of the end of the applicable year; and (iii) for awards granted in prior years that vest in the applicable year, the amount equal to the change as of the vesting date (from the end of the prior
year) in fair value. No dividends or other earnings were paid on awards in any applicable year. The amounts deducted or added in calculating the equity award adjustments for Mr. Khouri and Mr. Goldberg, respectively, are as follows:
| Year | Year End Fair Value of Equity Awards Granted in the Year and Outstanding and Unvested at Year End ($) | Year End Fair Value of Equity Awards Granted in the Year that Vested in the Year ($) | Year over Year Change in Fair Value of Outstanding and Unvested Equity Awards ($) | Change in Fair Value as of the Vesting date of Equity Awards Granted in Prior Years that Vested in the Year ($) | Fair Value at the End of the Prior Year of Equity Awards that Failed to Meet Vesting Conditions in the Year ($) | Total Equity Award Adjustments ($) | ||||||||||||||
| 2025 (Current PEO) | 16,280,647 | 1,908,177 | 20,429,000 | 7,523,300 | — | 46,141,124 | ||||||||||||||
| 2024 (Current PEO) | 7,164,000 | 1,017,900 | 6,516,000 | 5,634,400 | — | 20,332,300 | ||||||||||||||
| 2023 (Current PEO) | 3,740,000 | — | — | — | — | 3,740,000 | ||||||||||||||
| 2023 (Former PEO) | — | — | (6,822,794) | — | — | (6,822,794) | ||||||||||||||
| 2022 (Former PEO) | — | — | (9,368,938) | (238,204) | — | (9,607,142) | ||||||||||||||
| 2021 (Former PEO) | 21,450,452 | — | — | — | — | 21,450,452 | ||||||||||||||
| Year | Average Reported Summary compensation table total for Non-PEO NEOs ($) | Less | Average Reported Value of Equity Awards ($)(a) | Plus | Average Equity Awards Adjustment ($)(b) | Equals | Average CAP for Non-PEO NEOs ($) | ||||||||||||||||
| 2025 | 1,974,405 | - | 1,110,970 | + | 14,182,384 | = | 15,045,819 | ||||||||||||||||
| 2024 | 2,110,263 | - | 1,304,100 | + | 8,515,590 | = | 9,321,753 | ||||||||||||||||
| 2023 | 511,969 | - | 40,600 | + | (582,797) | = | (111,428) | ||||||||||||||||
| 2022 | 1,410,613 | - | 384,000 | + | (5,985,279) | = | (4,958,666) | ||||||||||||||||
| 2021 | 7,728,776 | - | 7,151,274 | + | 7,618,086 | = | 8,195,588 | ||||||||||||||||
(a)The dollar amounts reported represent the grant date fair value of equity awards as reported in the “Option Awards” column of the SCT in each applicable year.
(b)The equity award adjustments for the Company’s NEOs as a group (excluding Mr. Goldberg or Mr. Khouri, as applicable) were calculated in accordance with Item 402(v) of Regulation S-K and include: (i) the average year-end fair value of any equity awards granted in the applicable year that are outstanding and unvested as of the end of the year; (ii) the average year-end fair value of any equity awards granted in the applicable year that are vested in the year; (iii) the average amount of change as of the end of the applicable year (from the end of the prior year) in fair value of any awards granted in prior years that are outstanding and unvested as of the end of the applicable year; (iv) for awards granted in prior years that vest in the applicable year, the average amount equal to the change as of the vesting date (from the end of the prior year) in fair value; and (v) for awards granted in prior years that are determined to fail to meet the applicable vesting conditions during the applicable year, a deduction for the average amount equal to the fair value at the end of the prior year. No dividends or other earnings were paid on awards in any applicable year. The amounts deducted or added in calculating the equity award adjustments for the Company’s NEOs as a group (excluding Mr. Goldberg or Mr. Khouri, as applicable) are as follows:
| Year | Average Year End Fair Value of Equity Awards Granted in the Year and Outstanding and Unvested at Year End ($) | Average Year End Fair Value of Equity Awards Granted in the Year that Vested in the Year ($) | Year over Year Average Change in Fair Value of Outstanding and Unvested Equity Awards ($) | Average Change in Fair Value as of the Vesting date of Equity Awards Granted in Prior Years that Vested in the Year ($) | Average Fair Value at the End of the Prior Year of Equity Awards that Failed to Meet Vesting Conditions in the Year ($) | Total Average Equity Award Adjustments ($) | ||||||||||||||
| 2025 | 3,021,264 | 171,736 | 5,910,560 | 5,078,824 | — | 14,182,384 | ||||||||||||||
| 2024 | 2,865,000 | 357,113 | 1,629,000 | 3,664,477 | — | 8,515,590 | ||||||||||||||
| 2023 | 49,000 | — | (324,969) | — | 306,828 | (582,797) | ||||||||||||||
| 2022 | — | — | (3,122,979) | (79,402) | 2,782,898 | (5,985,279) | ||||||||||||||
| 2021 | 7,150,153 | — | — | 467,933 | — | 7,618,086 | ||||||||||||||
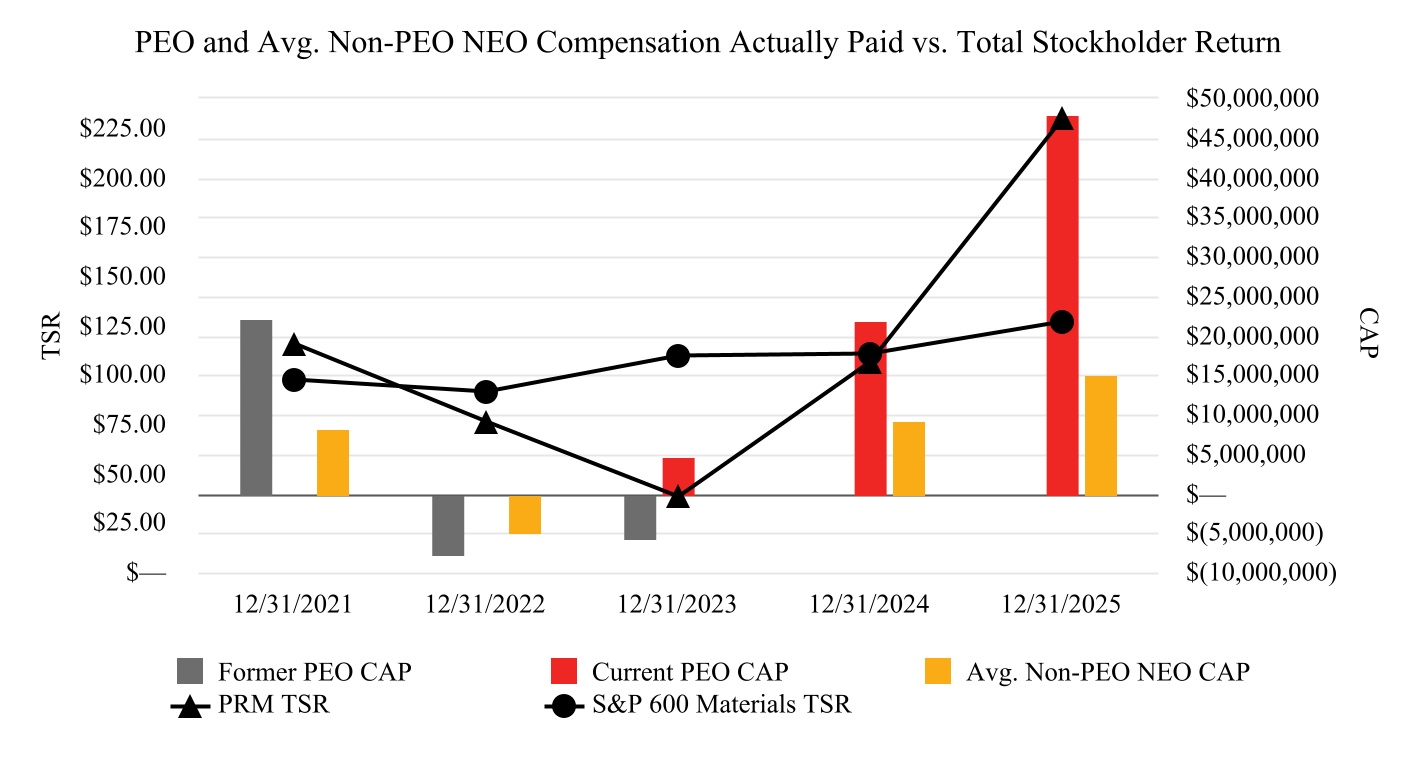
The CAP for Mr. Goldberg and Mr. Khouri (as applicable as PEO) and the average CAP for the Company’s other NEOs as a group (excluding Mr. Goldberg or Mr. Khouri, as applicable) for 2021, 2022, 2023, 2024, and 2025 is presented in comparison to the Company’s cumulative TSR and the S&P SmallCap 600 Materials Index (the peer group presented for this purpose) over such periods in the table below.
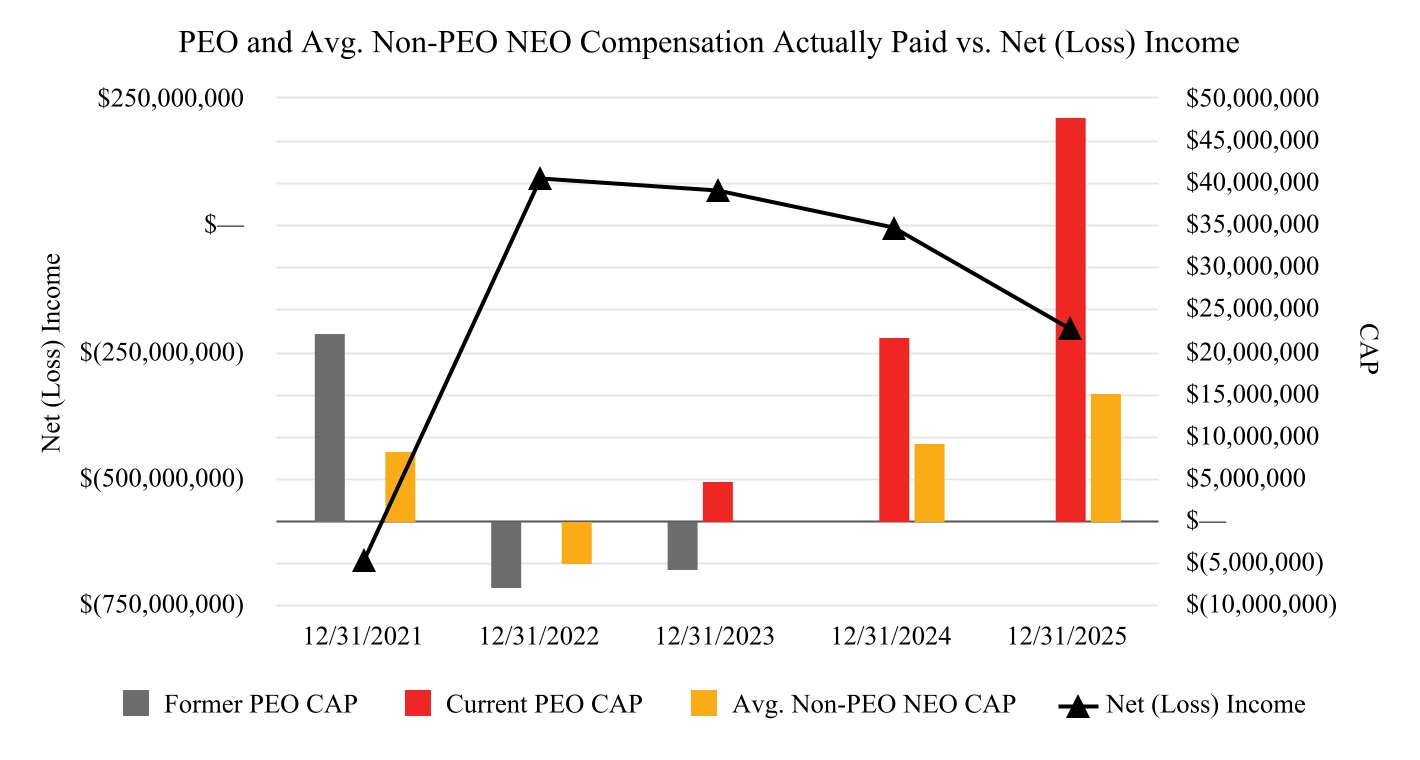
The CAP for Mr. Goldberg and Mr. Khouri (as applicable as PEO) and the average CAP for the Company’s other NEOs as a group (excluding Mr. Goldberg or Mr. Khouri, as applicable) for 2021, 2022, 2023, 2024 and 2025 is presented in comparison to the Company’s net (loss) income over such periods in the table below. All of the fixed and variable founder advisory amounts vested on November 9, 2021, the date of the business combination, because the Company believes that, as a result of the consummation of the business combination, it has incurred an obligation equal to the present value of the fixed and variable founder advisory amounts. The expense related to the fixed and variable founder advisory amounts of $653.0 million recognized by the Company resulted in a net loss of $661.5 million as of December 31, 2021. The expense related to the fixed and variable founder advisory amounts of $435.2 million recognized by the Company resulted in a net loss of $206.4 million as of December 31, 2025.
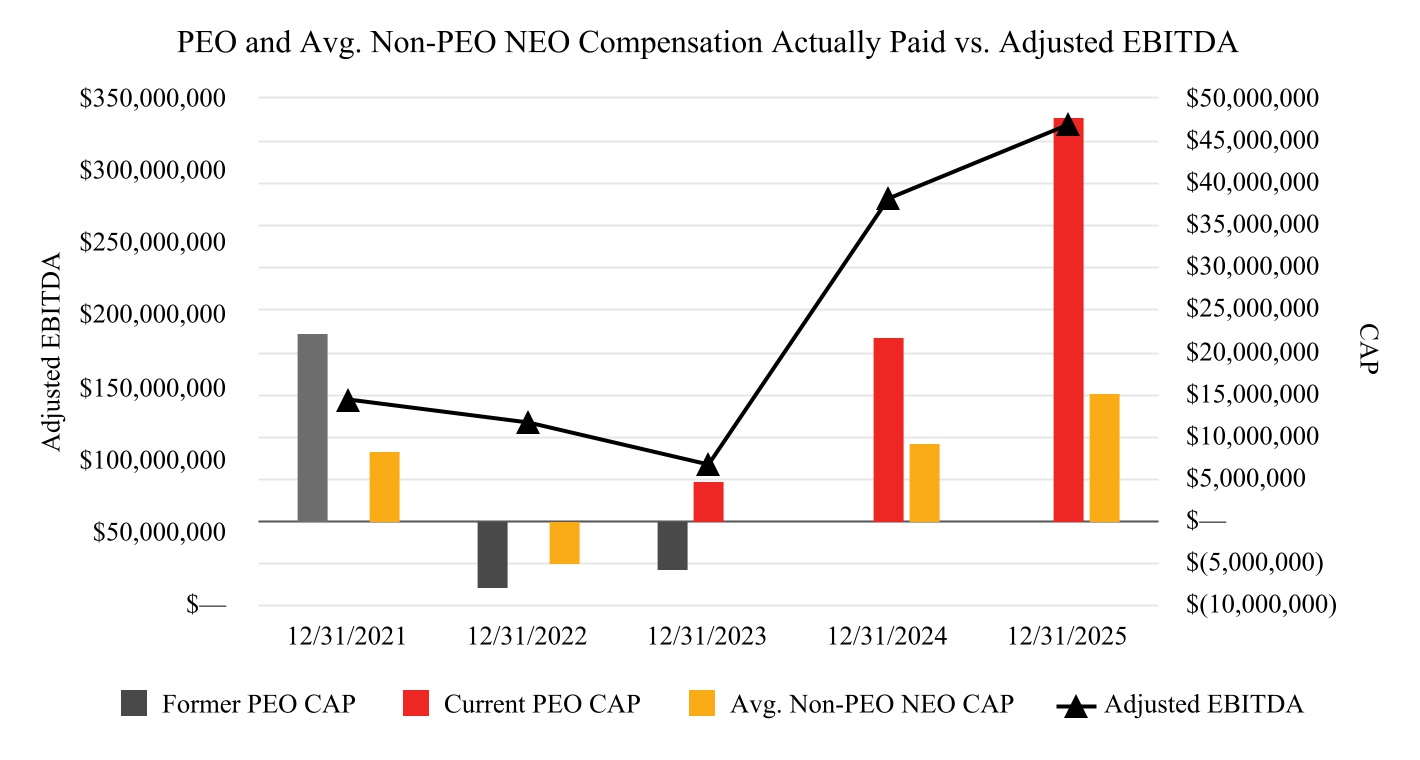
The CAP for Mr. Goldberg and Mr. Khouri (as applicable as PEO) and the average CAP for the Company’s other NEOs as a group (excluding Mr. Goldberg or Mr. Khouri, as applicable) for 2021, 2022, 2023, 2024 and 2025 is presented in comparison to the Company’s Adjusted EBITDA over such periods in the table below.
The CAP for Mr. Goldberg and Mr. Khouri (as applicable as PEO) and the average CAP for the Company’s other NEOs as a group (excluding Mr. Goldberg or Mr. Khouri, as applicable) for 2021, 2022, 2023, 2024, and 2025 is presented in comparison to the Company’s cumulative TSR and the S&P SmallCap 600 Materials Index (the peer group presented for this purpose) over such periods in the table below.
We are providing the following information about the relationship between executive compensation actually paid (“CAP”) and certain financial performance of the Company as required by SEC rules. Please see “Compensation Discussion and Analysis” for discussion of our compensation philosophy and how the Compensation Committee structures our compensation program to motivate and reward the achievement of performance-based financial and other goals that align with our operational and strategic objectives. The SEC-defined CAP data set forth in the table below does not reflect amounts actually realized by our NEOs, and the Compensation Committee has not used or considered CAP previously in establishing the NEO compensation program. A significant portion of the CAP amounts shown relate to changes in values of unvested awards over the course of the reporting year. The fair value as of December 31, 2025 for the equity awards adjustment shown below was calculated using the Hull-White model as this model considers the future movement in the price of Common Stock and option holders’ behavior with respect to option exercises. The Hull-White model requires us to make assumptions and judgments about the variables used in the calculation, including the sub-optimal exercise factor, drift rate, the blended volatility based on the Company’s trading history of its Common Stock, risk-free interest rate, and expected dividends. These unvested awards remain subject to significant risk from forfeiture conditions and possible future declines in value based on changes in the price of our Common Stock. The ultimate values actually realized by our NEOs from unvested equity awards, if any, will not be determined until the awards fully vest.
The dollar amounts reported represent the amount of CAP to Mr. Khouri and Mr. Goldberg, as applicable, as computed in accordance with Item 402(v) of Regulation S-K. The dollar amounts do not reflect the actual amount of compensation earned by or paid to Mr. Khouri and Mr. Goldberg during the applicable year. The adjustments below were made to the total compensation for Mr. Khouri and Mr. Goldberg, as applicable, for each year to determine the CAP for such year in accordance with the requirements of Item 402(v) of Regulation S-K. No amounts were reported in the “Change in Pension and Nonqualified Deferred Compensation” column of the Summary Compensation Table for any applicable year, so no defined benefit and actuarial pension plan adjustments were made for any applicable year.The dollar amounts reported represent the average of the amounts reported for the Company’s NEOs as a group (excluding Mr. Goldberg or Mr. Khouri, as applicable) in the “Total” column of the SCT in each applicable year. The names of each of the NEOs (excluding Mr. Goldberg and Mr. Khouri, as applicable) included for purposes of calculating the average amounts in each applicable year are as follows: (i) for 2025, Kyle Sable, Jeffrey Emery, Grant Bowman, Noriko Yokozuka and Edward Goldberg; (ii) for 2024, Kyle Sable, Edward Goldberg, Jeffrey Emery and Grant Bowman; (iii) for 2023, Kyle Sable, Charles Kropp, Jeffrey Emery, Shannon Horn, and Noriko Yokozuka; (iv) for 2022, Charles Kropp, Barry Lederman, Noriko Yokozuka, Shannon Horn, and Ernest Kremling; and (v) for 2021, Barry Lederman, Noriko Yokozuka, Shannon Horn, and Ernest Kremling.The dollar amounts reported represent the amount of CAP for the Company’s NEOs as a group (excluding Mr. Goldberg or Mr. Khouri, as applicable) as computed in accordance with Item 402(v) of Regulation S-K. The dollar amounts do not reflect an average of the actual amount of compensation earned by or paid to the Company’s NEOs as a group (excluding Mr. Goldberg or Mr. Khouri, as applicable) during the applicable year. The adjustments below were made to the average total compensation for the Company’s NEOs as a group (excluding Mr. Goldberg or Mr. Khouri, as applicable) for each year to determine the CAP for such year in accordance with the requirements of Item 402(v) of Regulation S-K. No amounts were reported in the “Change in Pension and Nonqualified Deferred Compensation” column of the Summary Compensation Table for any applicable year, so no defined benefit and actuarial pension plan adjustments were made for any applicable year.TSR is calculated by dividing the sum of the cumulative amount of dividends for the measurement period, assuming dividend reinvestment, and the difference between the Company’s share price at the end and the beginning of the measurement period by the Company’s share price at the beginning of the measurement period.The dollar amounts reported represent the amount of net (loss) income reflected in the Company’s audited financial statements for the applicable year.We have presented Adjusted EBITDA as the Company-selected measure in the table above in accordance with Item 402(v) of Regulation S-K. While the Company uses financial and non-financial performance measures for the purpose of evaluating performance for the Company’s compensation programs, the Company has determined that Adjusted EBITDA is the financial performance measure that, in the Company’s assessment, represents the most important performance measure used by the Company to link CAP for the Company’s NEOs to Company performance for the most recently completed year that is not otherwise required to be disclosed in the pay versus performance table above.
As described in “Compensation Discussion and Analysis,” a significant portion of the NEO pay is performance-based and at-risk, consistent with the compensation philosophy established by the Compensation Committee. Our NEO compensation program rewards the achievement of specific short-term (annual) and long-term financial and other goals, which are aligned with our operational and strategic goals. The most important financial performance measure used by the Company to link CAP for the Company’s NEOs to the Company’s performance for the most recently completed year is Adjusted EBITDA.
The Company is providing the following graphs regarding the relationships between information presented in the pay versus performance table, including CAP, as required by Item 402(v) of Regulation S-K. The Compensation Committee utilizes several performance measures to align executive compensation with Company performance, and only some of those Company measures are presented in the pay versus performance table above and the graphs below. The Compensation Committee has not used or considered CAP previously as computed in accordance with Item 402(v) of Regulation S-K to set target compensation amounts or align our NEO compensation to Company performance. See “Compensation Discussion and Analysis” for a discussion of how the Compensation Committee designs our compensation program and sets target compensation amounts.