On April 17, 2026, all of the assets of a separately managed account (the “Predecessor Account”), which had been managed by Milliman since April 22, 2024, and had investment policies, objectives, guidelines and restrictions that were in all material respects equivalent to those of the Fund, were transferred to the Fund in a tax-free transaction (the “Transaction”). Performance shown for periods prior to the date of the Transaction represents the performance of the Predecessor Account. Prior to the date of the Transaction, the Fund had not commenced investment operations. The Predecessor Account was not registered under the 1940 Act and therefore was not subject to certain investment restrictions that are imposed by the 1940 Act on registered investment companies. If the Predecessor Account had been registered under the 1940 Act, the Predecessor Account’s performance may have been adversely affected.
The bar chart and performance table below provide an indication of the risks of investing in the Fund. The bar chart shows changes in the Fund’s and Predecessor Account’s performance from year to year as of December 31. The performance table compares the Fund’s and Predecessor Account’s performance to that of a broad-based securities market benchmark and an additional benchmark. The Fund’s and Predecessor Account’s past performance is not necessarily an indication of its future performance. The Predecessor Account’s performance shown below has been recalculated using the Fund’s management fee, which has the effect of reducing the Predecessor Account’s performance. In addition, the Predecessor Account did not pay dividends and distributions. As a result, there are no after-tax returns for the Predecessor Account. Updated performance information is available online at www.millimanfunds.com.
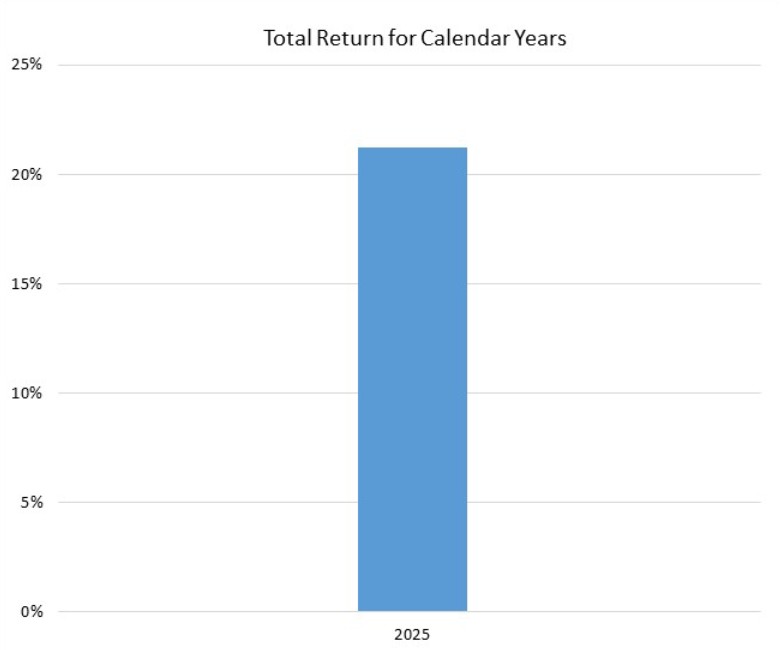
| Return | Quarter/Year | |
| Highest Return/Best Quarter | 7.19% | |
| Lowest Return/Worst Quarter | 0.90% |
| Milliman Healthcare Inflation Guard ETF | 1 Year | Since Inception (4/22/2024)(1) |
| Return Before Taxes | 21.23% | 15.00% |
| Return After Taxes on Distributions | N/A | N/A |
| Return After Taxes on Distributions and Sale of Shares | N/A | N/A |
| Bloomberg US Aggregate Bond Index (reflects no deduction for fees, expenses or taxes) | 7.30% | 6.97% |
| S&P 500 Index (reflects no deduction for fees, expenses or taxes) | 23.31% | 21.21% |
| (1) | The Predecessor Account commenced investment operations on April 22, 2024. |
After-tax returns are calculated using the historical highest individual federal marginal income tax rates during the period covered by the table above and do not reflect the impact of state and local taxes. Actual after-tax returns depend on an investor’s tax situation and may differ from those shown. After-tax returns shown are not relevant to investors who hold their Shares through tax-advantaged arrangements such as an individual retirement account (“IRA”) or other tax-advantaged accounts.
As of the date of this Prospectus, the Fund is new and therefore does not have a performance history for a full calendar year. Once available, the Fund’s performance information will be accessible online at www.millimanfunds.com and will provide some indication of the risks of investing in the Fund.