Pay vs Performance Disclosure - USD ($)
Dec. 31, 2022
Aug. 07, 2022
Dec. 31, 2025
Dec. 31, 2024
Dec. 31, 2023
Dec. 31, 2022
Dec. 31, 2021
Pay Versus Performance
As discussed in “Executive and Director Compensation—Compensation Discussion and Analysis,” the goal of our compensation program for our executive officers is the same as our goal for operating the Company—to create long-term value for our stockholders. The following tables and related disclosures provide information about (i) the “total compensation” of our principal executive officers (the “PEOs”) and our other named executive officers (the
“Non-PEO
Named Executive Officers”) as presented in the Summary Compensation Table on page 39 (the “SCT Amounts”), (ii) the “compensation actually paid” to our PEOs and our Non-PEO
Named Executive Officers, as calculated pursuant to the SEC’s pay-versus-performance
rules (the “CAP Amounts”), (iii) certain financial performance measures, and (iv) the relationship of the CAP Amounts to those financial performance measures. This disclosure has been prepared in accordance with Item 402(v) of Regulation
S-K
under the Exchange Act and does not necessarily reflect value actually realized by the executives or how our Compensation Committee makes compensation decisions in light of Company or individual performance. For discussion of how our Compensation Committee makes
compensation decisions, please see “Executive and Director Compensation—Compensation Discussion and Analysis.” Pay Versus Performance
Year |
Summary Compen- sation Table Total for First PEO (Saylor) (1) ($) |
Summary Compen- sation Table Total for Second PEO (Le) (1) ($) |
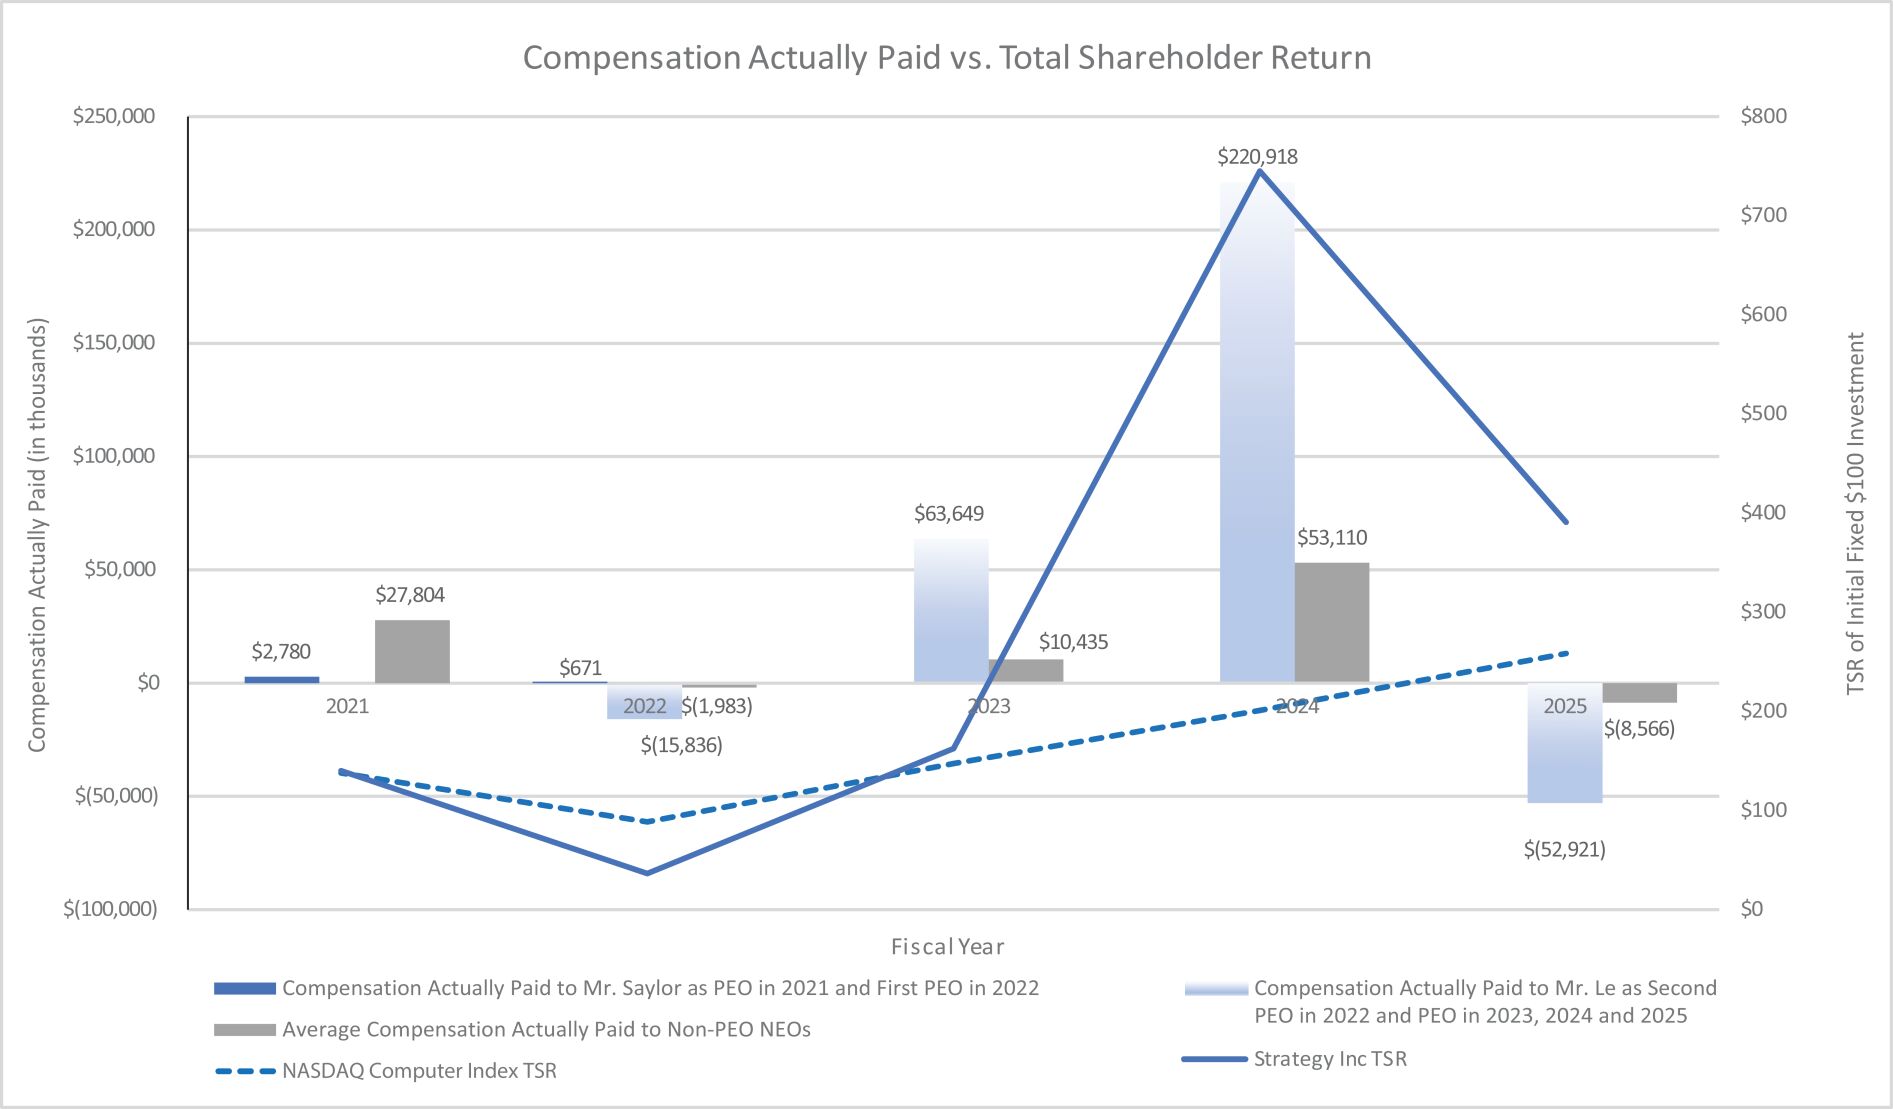
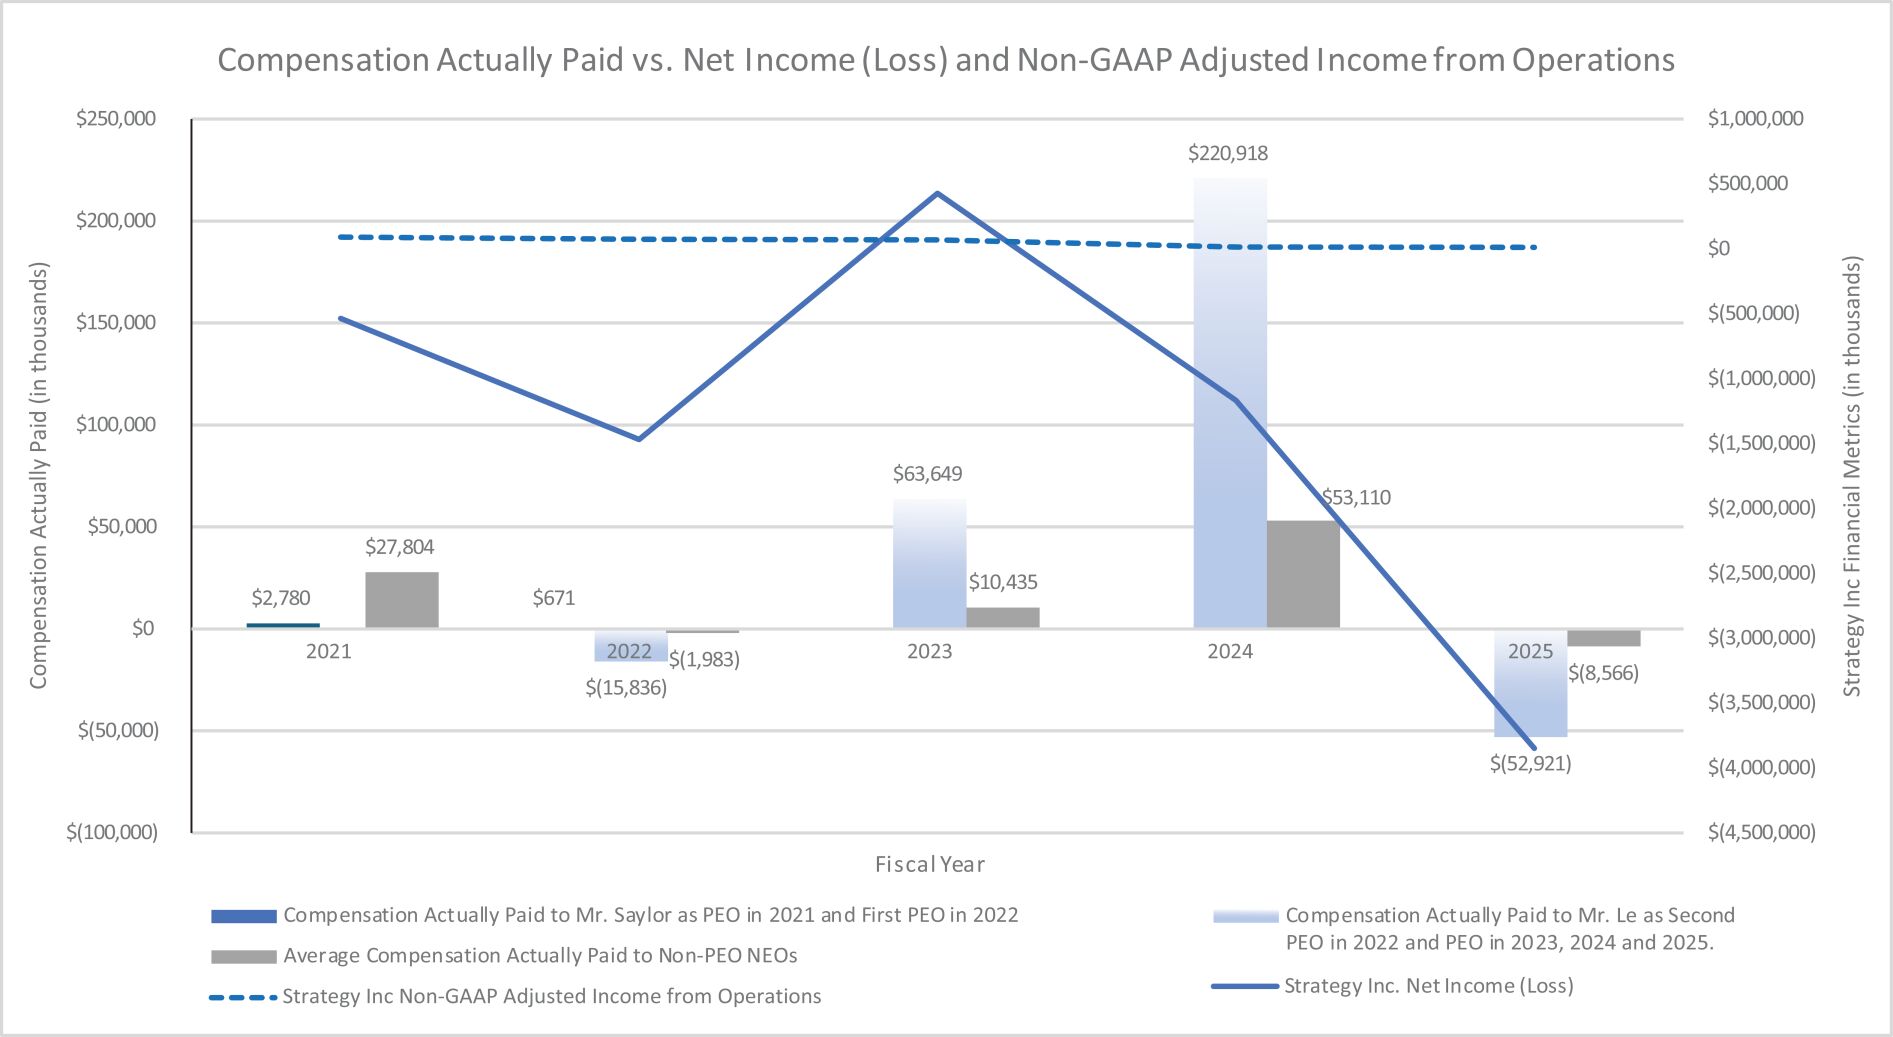
Compen- sation Actually Paid to First PEO (Saylor) (2) ($) |
Compen- sation Actually Paid to Second PEO (Le) (2) ($) |
Average Summary Compen- sation Table Total for Non-PEO Named Executive Officers (3) ($) |
Average Compen- sation Actually Paid to Non-PEO Named Executive Officers (2) ($) |
Value of Initial Fixed $100 Investment Based on: |
Net Income (Loss) ($) (in thousands) (6) |
Non-GAAP Adjusted Income from Operations ($) (in thousands) (7) |
|||||||||||||||||||||||||||||||
Total Shareholder Return (4) ($) |
Peer Group Total Shareholder Return (5) ($) |
|||||||||||||||||||||||||||||||||||||||
2025 |
N/A |
13,784,204 |
N/A |
(52,921,044 |
) |
3,730,086 |
(8,565,894 |
) |
391 |
258 |
(3,848,153 |
) |
12,459 |
|||||||||||||||||||||||||||
2024 |
N/A |
15,736,147 |
N/A |
220,918,429 |
(8) |
4,959,596 |
53,110,328 |
(8) |
745 |
201 |
(1,166,661 |
) |
14,008 |
|||||||||||||||||||||||||||
2023 |
N/A |
8,028,255 |
N/A |
63,649,217 |
2,420,954 |
10,435,349 |
163 |
147 |
429,121 |
70,375 |
||||||||||||||||||||||||||||||
2022 |
670,812 |
20,174,360 |
670,812 |
(15,836,288 |
) |
6,282,443 |
(1,983,026 |
) |
36 |
89 |
(1,469,797 |
) |
74,163 |
|||||||||||||||||||||||||||
2021 |
2,780,241 |
N/A |
2,780,241 |
N/A |
12,152,910 |
27,803,878 |
140 |
138 |
(535,480 |
) |
90,220 |
|||||||||||||||||||||||||||||
| (1) | Mr. Saylor (our “First PEO”) served as our PEO in 2021 and until August 7, 2022. Mr. Le (our “Second PEO”) is the current PEO and has served as our PEO since August 8, 2022. The amounts reported under Summary Compensation Table Total for First PEO and Summary Compensation Table Total for Second PEO reflect the total compensation amounts reported in the “Summary Compensation Table” for our First PEO and our Second PEO, respectively, for each respective year in which such individual served as PEO for any portion of the year. |
| (2) | The following table describes the adjustments, each of which is prescribed by SEC rule, to calculate the CAP Amounts from the SCT Amounts. The SCT Amounts and the CAP Amounts do not reflect the actual amounts of compensation earned by or paid to the executives during the applicable years, but rather are amounts determined in accordance with Item 402 of Regulation S-K under the Exchange Act. |
2025 |
2024 |
2023 |
2022 |
2021 |
||||||||||||||||||||||||||||||||||||||||
Adjustments |
PEO ($) |
Non-PEO Named Executive Officers* ($) |
PEO ($) |
Non-PEO Named Executive Officers* ($) |
PEO ($) |
Non-PEO Named Executive Officers* ($) |
First PEO ($) |
Second PEO ($) |
Non-PEO Named Executive Officers* ($) |
PEO ($) |
Non-PEO Named Executive Officers* ($) |
|||||||||||||||||||||||||||||||||
SCT Total Compensation |
13,784,204 |
3,730,086 |
15,736,147 |
4,959,596 |
8,028,255 |
2,420,954 |
670,812 |
20,174,360 |
6,282,443 |
2,780,241 |
12,152,910 |
|||||||||||||||||||||||||||||||||
Less: Aggregate value for stock awards and option awards included in SCT Amounts for the covered fiscal year |
(11,173,323 |
) |
(2,826,577) |
(13,383,342 |
) |
(3,859,026 |
) |
(5,954,383 |
) |
(1,544,782 |
) |
— |
(18,324,800 |
) |
(5,204,525 |
) |
— |
(10,158,133 |
) | |||||||||||||||||||||||||
Plus: Fair value at year end of awards granted during the covered fiscal year that were outstanding and unvested at the covered fiscal year end |
5,994,481 |
1,794,885 |
25,445,612 |
7,218,919 |
14,378,619 |
3,063,917 |
— |
8,087,752 |
2,363,133 |
— |
6,768,250 |
|||||||||||||||||||||||||||||||||
Year-over-year change in fair value at covered fiscal year end of awards granted in any prior fiscal year that were outstanding and unvested at the covered fiscal year end |
(74,621,662 |
) |
(13,167,439 |
) |
178,734,562 |
** |
39,351,469 |
** |
35,805,915 |
5,448,715 |
— |
(14,730,642 |
) |
(3,518,449 |
) |
— |
6,072,885 |
|||||||||||||||||||||||||||
Change as of the vesting date (from the end of the prior fiscal year) in fair value of awards granted in any prior fiscal year for which vesting conditions were satisfied during the covered fiscal year |
13,095,256 |
1,903,151 |
14,385,451 |
5,439,370 |
11,390,811 |
1,481,456 |
— |
(11,042,958 |
) |
(1,905,628 |
) |
— |
12,967,966 |
|||||||||||||||||||||||||||||||
Less: Fair value at end of prior fiscal year of awards granted in any prior fiscal year that failed to meet the applicable vesting conditions during the covered fiscal year |
— |
— |
— |
— |
— |
(434,911 |
) |
— |
— |
— |
— |
— |
||||||||||||||||||||||||||||||||
CAP Amounts (as calculated) |
(52,921,044 |
) |
(8,565,894 |
) |
220,918,429 |
** |
53,110,328 |
** |
63,649,217 |
10,435,349 |
670,812 |
(15,836,288 |
) |
(1,983,026 |
) |
2,780,241 |
27,803,878 |
|||||||||||||||||||||||||||
| * | Amounts presented are averages for the entire group of Non-PEO Named Executive Officers in each respective year. |
| ** | Reflects a correction from the amount disclosed in the proxy statement for our 2025 annual meeting of stockholders. |
Stock option grant date fair values were calculated based on the Black-Scholes valuation model as of the grant date. The calculations of stock option fair values as of each measurement date were made using the Black-Scholes valuation model, using the stock price as of the measurement date with updated assumptions (i.e., expected term, volatility, and risk free rates) as of the measurement date. In updating the expected term assumptions as of each measurement date, we considered the passage of time, exercise history, and “in-the-money” year-end and as of each date of vesting were calculated using the stock price as of the applicable date. All of our PSUs include a market condition such that vesting is subject to the Company’s achievement of a relative total shareholder return performance goal over a three-year performance period. The number of PSUs that will vest will be based on the percentile ranking of the Company’s TSR over the three-year performance period as compared to the TSR of the members of the Nasdaq Composite Index over the same period, with the payout factor ranging from 0% to 200% of the number of PSUs granted. The PSU grant date fair values were calculated using a Monte Carlo simulation as of the grant date. The calculations of unvested PSU fair values as of year-end were made using a Monte Carlo simulation, using the stock price as of year-end with updated assumptions (i.e., expected term, volatility, risk free rates, actual TSR from date of grant to year-end) as of the measurement date. |
| (3) | The amounts reported under Average Summary Compensation Table Total for Non-PEO Named Executive Officers reflect the average of the total compensation amounts reported in the “Summary Compensation Table” for the Non-PEO Named Executive Officers for each respective year. The Non-PEO Named Executive Officers were: |
| • | For 2025, Messrs. Saylor, Kang, Chow and Shao; |
| • | For 2024, Messrs. Saylor, Kang, and Shao; |
| • | For 2023, Messrs. Saylor, Adkisson, Kang, and Shao; |
| • | For 2022, Messrs. Adkisson, Kang, Lang, and Shao; |
| • | For 2021, Messrs. Lang, Le, and Shao; |
| (4) | For the fiscal years ended December 31, 2025, 2024, 2023, 2022, 2021, represents the cumulative total shareholder return (“TSR”) of our Class A Stock (“Strategy TSR”) for the measurement periods beginning as of market close on December 31, 2020 and ending on December 31, 2025, 2024, 2023, 2022, and 2021, respectively. |
| (5) | For the fiscal years ended December 31, 2025, 2024, 2023, 2022, and 2021, represents the cumulative TSR of the Nasdaq Computer Index (“Peer Group TSR”) for the measurement periods beginning as of market close on December 31, 2020 and ending on December 31 of each of 2025, 2024, 2023, 2022, and 2021, respectively. The Nasdaq Computer Index is the peer group used by the Company for purposes of Item 201(e) of Regulation S-K under the Exchange Act in the Company’s Annual Report on Form 10-K for the fiscal year ended December 31, 2025. |
| (6) | Reflects “Net Income (Loss)” for the fiscal years ended December 31, 2025, 2024, and 2023 included in the Company’s Consolidated Statements of Operations included in the Company’s Annual Report on Form 10-K for the fiscal year ended December 31, 2025, and “Net Income (Loss)” for the fiscal years ended December 31, 2022 and 2021 included in the Company’s Consolidated Statements of Operations included in the Company’s Annual Report on Form 10-K for the fiscal year ended December 31, 2023. |
| (7) | Non-GAAP Adjusted Income from Operations is a non-GAAP financial measure calculated by (i) for 2025, adjusting loss from operations to exclude unrealized gains or losses on digital assets and share-based compensation expense and (ii) for 2021 to 2024, adjusting loss from operations to exclude digital asset impairment losses and share-based compensation expense. The difference between (i) and (ii) reflects our adoption of Accounting Standards Update No. 2023-08, Intangibles—Goodwill and Other—Crypto Assets (Subtopic 350-60): Accounting for and Disclosure of Crypto Assets (“ASU 2023-08”), effective January 1, 2025, which requires fair value accounting for digital assets with changes recognized in net income, whereas prior periods were accounted for under a cost-less-impairment model and therefore did not include unrealized gains or losses. ASU 2023-08 was adopted using a modified retrospective method, with a cumulative-effect adjustment recorded to opening retained earnings and no restatement of prior periods. |
| (8) | Reflects a correction from the amount disclosed in the proxy statement for our 2025 annual meeting of stockholders. |
| (3) | The amounts reported under Average Summary Compensation Table Total for Non-PEO Named Executive Officers reflect the average of the total compensation amounts reported in the “Summary Compensation Table” for the Non-PEO Named Executive Officers for each respective year. The Non-PEO Named Executive Officers were: |
| • | For 2025, Messrs. Saylor, Kang, Chow and Shao; |
| • | For 2024, Messrs. Saylor, Kang, and Shao; |
| • | For 2023, Messrs. Saylor, Adkisson, Kang, and Shao; |
| • | For 2022, Messrs. Adkisson, Kang, Lang, and Shao; |
| • | For 2021, Messrs. Lang, Le, and Shao; |
S-K
under the Exchange Act in the Company’s Annual Report on Form 10-K
for the fiscal year ended December 31, 2025.
| (2) | The following table describes the adjustments, each of which is prescribed by SEC rule, to calculate the CAP Amounts from the SCT Amounts. The SCT Amounts and the CAP Amounts do not reflect the actual amounts of compensation earned by or paid to the executives during the applicable years, but rather are amounts determined in accordance with Item 402 of Regulation S-K under the Exchange Act. |
2025 |
2024 |
2023 |
2022 |
2021 |
||||||||||||||||||||||||||||||||||||||||
Adjustments |
PEO ($) |
Non-PEO Named Executive Officers* ($) |
PEO ($) |
Non-PEO Named Executive Officers* ($) |
PEO ($) |
Non-PEO Named Executive Officers* ($) |
First PEO ($) |
Second PEO ($) |
Non-PEO Named Executive Officers* ($) |
PEO ($) |
Non-PEO Named Executive Officers* ($) |
|||||||||||||||||||||||||||||||||
SCT Total Compensation |
13,784,204 |
3,730,086 |
15,736,147 |
4,959,596 |
8,028,255 |
2,420,954 |
670,812 |
20,174,360 |
6,282,443 |
2,780,241 |
12,152,910 |
|||||||||||||||||||||||||||||||||
Less: Aggregate value for stock awards and option awards included in SCT Amounts for the covered fiscal year |
(11,173,323 |
) |
(2,826,577) |
(13,383,342 |
) |
(3,859,026 |
) |
(5,954,383 |
) |
(1,544,782 |
) |
— |
(18,324,800 |
) |
(5,204,525 |
) |
— |
(10,158,133 |
) | |||||||||||||||||||||||||
Plus: Fair value at year end of awards granted during the covered fiscal year that were outstanding and unvested at the covered fiscal year end |
5,994,481 |
1,794,885 |
25,445,612 |
7,218,919 |
14,378,619 |
3,063,917 |
— |
8,087,752 |
2,363,133 |
— |
6,768,250 |
|||||||||||||||||||||||||||||||||
Year-over-year change in fair value at covered fiscal year end of awards granted in any prior fiscal year that were outstanding and unvested at the covered fiscal year end |
(74,621,662 |
) |
(13,167,439 |
) |
178,734,562 |
** |
39,351,469 |
** |
35,805,915 |
5,448,715 |
— |
(14,730,642 |
) |
(3,518,449 |
) |
— |
6,072,885 |
|||||||||||||||||||||||||||
Change as of the vesting date (from the end of the prior fiscal year) in fair value of awards granted in any prior fiscal year for which vesting conditions were satisfied during the covered fiscal year |
13,095,256 |
1,903,151 |
14,385,451 |
5,439,370 |
11,390,811 |
1,481,456 |
— |
(11,042,958 |
) |
(1,905,628 |
) |
— |
12,967,966 |
|||||||||||||||||||||||||||||||
Less: Fair value at end of prior fiscal year of awards granted in any prior fiscal year that failed to meet the applicable vesting conditions during the covered fiscal year |
— |
— |
— |
— |
— |
(434,911 |
) |
— |
— |
— |
— |
— |
||||||||||||||||||||||||||||||||
CAP Amounts (as calculated) |
(52,921,044 |
) |
(8,565,894 |
) |
220,918,429 |
** |
53,110,328 |
** |
63,649,217 |
10,435,349 |
670,812 |
(15,836,288 |
) |
(1,983,026 |
) |
2,780,241 |
27,803,878 |
|||||||||||||||||||||||||||
| * | Amounts presented are averages for the entire group of Non-PEO Named Executive Officers in each respective year. |
| ** | Reflects a correction from the amount disclosed in the proxy statement for our 2025 annual meeting of stockholders. |
Stock option grant date fair values were calculated based on the Black-Scholes valuation model as of the grant date. The calculations of stock option fair values as of each measurement date were made using the Black-Scholes valuation model, using the stock price as of the measurement date with updated assumptions (i.e., expected term, volatility, and risk free rates) as of the measurement date. In updating the expected term assumptions as of each measurement date, we considered the passage of time, exercise history, and “in-the-money” year-end and as of each date of vesting were calculated using the stock price as of the applicable date. All of our PSUs include a market condition such that vesting is subject to the Company’s achievement of a relative total shareholder return performance goal over a three-year performance period. The number of PSUs that will vest will be based on the percentile ranking of the Company’s TSR over the three-year performance period as compared to the TSR of the members of the Nasdaq Composite Index over the same period, with the payout factor ranging from 0% to 200% of the number of PSUs granted. The PSU grant date fair values were calculated using a Monte Carlo simulation as of the grant date. The calculations of unvested PSU fair values as of year-end were made using a Monte Carlo simulation, using the stock price as of year-end with updated assumptions (i.e., expected term, volatility, risk free rates, actual TSR from date of grant to year-end) as of the measurement date. |
The following table lists the five financial and
non-financial
performance measures that, in our assessment, represent the most important performance measures that our Compensation Committee assessed to link the CAP Amounts for our named executive officers for 2025 (our most recently completed fiscal year), to Company performance. Measure |
Nature |
Explanation | ||
Revenue |
Financial Measure |
Revenue generated by our business intelligence operating strategy in 2025 | ||
Non-GAAP Adjusted Income from Operations |
Financial Measure |
A non-GAAP financial measure calculated by (i) for 2025, adjusting loss from operations to exclude unrealized gains or losses on digital assets and share-based compensation expense and (ii) for 2021 to 2024, adjusting loss from operations to exclude digital asset impairment losses and share-based compensation expense. | ||
Non-GAAP Operating Margin |
Financial Measure |
The ratio of Non-GAAP Adjusted Income from Operations to Total Revenue | ||
Total Stockholder Return |
Financial Measure |
Total returns on an investment in shares of Class A Stock | ||
Bitcoin-Related Initiatives |
Non-Financial Measure |
Subjective evaluation of the effectiveness of the execution of our strategy to acquire and hold bitcoin to create shareholder value. | ||
Non-GAAP
Adjusted Income from Operations is a non-GAAP
financial measure calculated by (i) for 2025, adjusting loss from operations to exclude unrealized gains or losses on digital assets and share-based compensation expense and (ii) for 2021 to 2024, adjusting loss from operations to exclude digital asset impairment losses and share-based compensation expense. The difference between (i) and (ii) reflects our adoption of Accounting Standards Update No. 2023-08,
Intangibles—Goodwill and Other—Crypto Assets (Subtopic 350-60):
Accounting for and Disclosure of Crypto Assets (“ASU 2023-08”),
effective January 1, 2025, which requires fair value accounting for digital assets with changes recognized in net income, whereas prior periods were accounted for under a cost-less-impairment model and therefore did not include unrealized gains or losses. ASU 2023-08
was adopted using a modified retrospective method, with a cumulative-effect adjustment recorded to opening retained earnings and no restatement of prior periods.