Pay Versus Performance
As required by Item 402(v) of SEC Regulation S-K, the following information is presented to disclose the relationship between executive compensation actually paid (“CAP”), as calculated under the applicable SEC rules, and the Company’s financial performance for the last three (3) fiscal years. As required by SEC rules, as it applies to smaller reporting companies, the table presented below discloses CAP for (i) our principal executive officer (“PEO”) and (ii) our named executive officers other than the PEO (the “Non-PEO NEOs”), on an average basis.
The methodology for calculating amounts presented in the columns “CAP to PEO” and “Average CAP to Non-PEO NEOs,” including details regarding the amounts that were deducted from, and added to, the Summary Compensation Table totals to arrive at the values presented for CAP, are provided in the footnotes to the table.
The calculations and analysis below do not necessarily reflect the Company’s approach to aligning executive compensation with performance. For information concerning the Company’s compensation philosophy and how the Company aligns executive compensation with financial performance, refer to the Executive Compensation discussion beginning on page 41 of this proxy statement.
Pay Versus Performance Table
In accordance with applicable SEC rules, the following table sets forth information concerning Summary Compensation Table (“SCT”) Total Compensation and CAP for the Company’s PEO and Non-PEO NEOs for fiscal years 2025, 2024 and 2023 and the corresponding financial performance in each year.
| Year | SCT | CAP – PEO | Average | Average | Value of | Net Income | |||||||
| 2025 | 6,101,176 | 8,865,811 | 3,754,799 | 5,017,334 | 275.59 | 163,055 |
| ||||||
| 2024 | 2,359,908 | 5,387,597 | 1,111,699 | 1,909,687 | 191.94 | (17,930 | ) | ||||||
| 2023 | 2,459,432 | 1,867,545 | 1,175,436 | 792,784 | 89.10 | (46,339 | ) | ||||||
(1) The Company’s Non-PEO NEOs for the applicable years are as follows:
(a) 2025: Elizabeth Hurlburt and Beth Zelnick Kaufman.
(b) 2024: Matthew David and Elizabeth Hurlburt.
(c) 2023: Matthew David, Phoebe Mounts and Erin Mistry.
(2) The dollar amounts reported in this column are the amounts of total compensation reported for the PEO for each corresponding fiscal year in the “Total” column of the SCT. Refer to the SCT as set forth on page 41 of this proxy statement.
(3) The dollar amounts shown for CAP are computed in accordance with Item 402(v) of Regulation S-K and do not reflect the cash and/or equity value transferred to the PEO or Non-PEO NEOs during the applicable year. These amounts reflect total compensation as reported in the SCT with certain adjustments as described below:
| Year | Reported | Reported | Equity Award | CAP | |||||
| 2025 Todisco | 6,101,176 | (4,492,500 | ) | 7,257,135 | 8,865,811 | ||||
| 2024 Todisco | 2,359,908 | (1,208,454 | ) | 4,236,143 | 5,387,597 | ||||
| 2023 Todisco | 2,459,432 | (1,388,400 | ) | 796,513 | 1,867,545 | ||||
(a) The grant date fair value of equity awards represents the total of the amounts reported in the “Stock Awards” and “Option Awards” columns in the SCT for the applicable year.
(b) The equity award adjustments for each covered fiscal year include the addition (or subtraction, as applicable) of the following, as applicable: (i) the year-end fair value of any equity awards granted during the covered fiscal year that are outstanding and unvested as of the end of the covered fiscal year; (ii) the amount of change as of the end of the covered fiscal year (from the end of the prior fiscal year) in fair value of any awards granted in prior years that are outstanding and unvested as of the end of the covered fiscal year; (iii) for awards that are granted and vest in same year, the fair value as of the vesting date; (iv) for awards granted in any prior fiscal year that vest at the end of or during the covered fiscal year, the amount equal to the change as of the vesting date (from the end of the prior fiscal year) in fair value; (v) for awards granted in any prior fiscal year that are determined to fail to meet the applicable vesting conditions during the covered fiscal year, a deduction for the amount equal to the fair value at the end of the prior fiscal year; and (vi) the dollar value of any dividends or other earnings paid on stock or option awards in the covered fiscal year prior to the vesting date that are not otherwise
reflected in the fair value of such award or included in any other component of total compensation for the covered fiscal year. The valuation assumptions used to calculate fair values did not materially differ from those disclosed at the time of grant. The amounts deducted or added in calculating the equity award adjustments are as follows:
| Year | Year End | Year over | Fair Value | Year over Year Change in Fair Value of Equity Awards Granted in Prior Fiscal Year(s) that Vested in Covered Fiscal Year | Fair Value at the End of the Prior Fiscal Year of Equity Awards that Failed to Meet Vesting Conditions in Covered Fiscal Year | Value of Dividends or other Earnings Paid on Stock or Option Awards not Otherwise Reflected in Fair Value or Total Compensation for Covered Fiscal Year | Total Equity Award Adjustments ($) | ||||||||
| 2025 Todisco | 3,986,546 | 1,422,390 |
| 570,469 | 1,277,730 |
|
| 7,257,135 | |||||||
| 2024 Todisco | 2,150,287 | 1,596,149 |
| 302,110 | 187,597 |
|
| 4,236,143 | |||||||
| 2023 Todisco | 737,490 | (349,287 | ) | 347,100 | 61,210 |
|
| 796,513 | |||||||
| Year | Average Reported SCT | Average Reported Value of Equity Awards(a) | Average Equity Award Adjustments(b) | Average Compensation Actually Paid to Non-PEO NEOs | |||||
| 2025 | 3,754,799 | (2,784,318 | ) | 4,046,853 | 5,017,334 | ||||
| 2024 | 1,111,699 | (453,170 | ) | 1,251,158 | 1,909,687 | ||||
| 2023 | 1,175,436 | (520,650 | ) | 137,998 | 792,784 | ||||
(a) The grant date fair value of equity awards represents the total of the amounts reported in the “Stock Awards” and “Option Awards” columns in the SCT for the applicable year.
(b) The equity award adjustments for each covered fiscal year include the addition (or subtraction, as applicable) of the following, as applicable: (i) the year-end fair value of any equity awards granted during the covered fiscal year that are outstanding and unvested as of the end of the covered fiscal year; (ii) the amount of change as of the end of the covered fiscal year (from the end of the prior fiscal year) in fair value of any awards granted in prior years that are outstanding and unvested as of the end of the covered fiscal year; (iii) for awards that are granted and vest in same year, the fair value as of the vesting date; (iv) for awards granted in any prior fiscal year that vest at the end of or during the covered fiscal year, the amount equal to the change as of the vesting date (from the end of the prior fiscal year) in fair value; (v) for awards granted in any prior fiscal year that are determined to fail to meet the applicable vesting conditions during the covered fiscal year, a deduction for the amount equal to the fair value at the end of the prior fiscal year; and (vi) the dollar value of any dividends or other earnings paid on stock or option awards in the covered fiscal year prior to the vesting date that are not otherwise reflected in the fair value of such award or included in any other component of total compensation for the covered fiscal year. The valuation assumptions used to calculate fair values did not materially differ from those disclosed at the time of grant. The amounts deducted or added in calculating the equity award adjustments are as follows:
| Year | Year End Fair Value of Outstanding and Unvested Equity Awards Granted in Covered Fiscal Year | Year over Year Change in Fair Value of Outstanding and Unvested Equity Awards Granted in Prior Fiscal Year(s) | Fair Value as of Vesting Date of Equity Awards Granted and Vested in the Same Year | Year over Year Change in Fair Value of Equity Awards Granted in Prior Fiscal Year(s) that Vested in Covered Fiscal | Fair Value at the End of the Prior Fiscal Year of Equity Awards that Failed to Meet Vesting Conditions in Covered Fiscal Year | Value of Dividends or other Earnings Paid on Stock or Option Awards not Otherwise Reflected in Fair Value or Total Compensation for Covered Fiscal Year | Total Equity | ||||||||||
| 2025 | 2,468,228 | 889,400 |
| 438,166 | 251,058 |
|
|
|
| 4,046,852 | |||||||
| 2024 | 806,355 | 272,320 |
| 113,293 | 59,190 |
|
|
|
| 1,251,158 | |||||||
| 2023 | 199,737 | (67,328 | ) | 139,017 | (90,437 | ) | (42,991 | ) |
| 137,998 | |||||||
(4) The dollar amounts reported in this column are the average amounts of total compensation reported for the Non-PEO NEOs for each corresponding fiscal year in the “Total” column of the SCT. Refer to the SCT as set forth on page 41 of this proxy statement.
(5) Total Shareholder Return shown in this table assumes $100 was invested for the period starting December 31, 2022 through December 31 of the applicable fiscal year in the Company’s common stock as traded under ticker CRMD on Nasdaq. The historical stock price performance of our common stock shown is not necessarily indicative of future stock price performance.
(1) The Company’s Non-PEO NEOs for the applicable years are as follows:
(a) 2025: Elizabeth Hurlburt and Beth Zelnick Kaufman.
(b) 2024: Matthew David and Elizabeth Hurlburt.
(c) 2023: Matthew David, Phoebe Mounts and Erin Mistry.
| Year | Reported | Reported | Equity Award | CAP | |||||
| 2025 Todisco | 6,101,176 | (4,492,500 | ) | 7,257,135 | 8,865,811 | ||||
| 2024 Todisco | 2,359,908 | (1,208,454 | ) | 4,236,143 | 5,387,597 | ||||
| 2023 Todisco | 2,459,432 | (1,388,400 | ) | 796,513 | 1,867,545 | ||||
(a) The grant date fair value of equity awards represents the total of the amounts reported in the “Stock Awards” and “Option Awards” columns in the SCT for the applicable year.
(b) The equity award adjustments for each covered fiscal year include the addition (or subtraction, as applicable) of the following, as applicable: (i) the year-end fair value of any equity awards granted during the covered fiscal year that are outstanding and unvested as of the end of the covered fiscal year; (ii) the amount of change as of the end of the covered fiscal year (from the end of the prior fiscal year) in fair value of any awards granted in prior years that are outstanding and unvested as of the end of the covered fiscal year; (iii) for awards that are granted and vest in same year, the fair value as of the vesting date; (iv) for awards granted in any prior fiscal year that vest at the end of or during the covered fiscal year, the amount equal to the change as of the vesting date (from the end of the prior fiscal year) in fair value; (v) for awards granted in any prior fiscal year that are determined to fail to meet the applicable vesting conditions during the covered fiscal year, a deduction for the amount equal to the fair value at the end of the prior fiscal year; and (vi) the dollar value of any dividends or other earnings paid on stock or option awards in the covered fiscal year prior to the vesting date that are not otherwise
reflected in the fair value of such award or included in any other component of total compensation for the covered fiscal year. The valuation assumptions used to calculate fair values did not materially differ from those disclosed at the time of grant. The amounts deducted or added in calculating the equity award adjustments are as follows:
| Year | Year End | Year over | Fair Value | Year over Year Change in Fair Value of Equity Awards Granted in Prior Fiscal Year(s) that Vested in Covered Fiscal Year | Fair Value at the End of the Prior Fiscal Year of Equity Awards that Failed to Meet Vesting Conditions in Covered Fiscal Year | Value of Dividends or other Earnings Paid on Stock or Option Awards not Otherwise Reflected in Fair Value or Total Compensation for Covered Fiscal Year | Total Equity Award Adjustments ($) | ||||||||
| 2025 Todisco | 3,986,546 | 1,422,390 |
| 570,469 | 1,277,730 |
|
| 7,257,135 | |||||||
| 2024 Todisco | 2,150,287 | 1,596,149 |
| 302,110 | 187,597 |
|
| 4,236,143 | |||||||
| 2023 Todisco | 737,490 | (349,287 | ) | 347,100 | 61,210 |
|
| 796,513 | |||||||
| Year | Average Reported SCT | Average Reported Value of Equity Awards(a) | Average Equity Award Adjustments(b) | Average Compensation Actually Paid to Non-PEO NEOs | |||||
| 2025 | 3,754,799 | (2,784,318 | ) | 4,046,853 | 5,017,334 | ||||
| 2024 | 1,111,699 | (453,170 | ) | 1,251,158 | 1,909,687 | ||||
| 2023 | 1,175,436 | (520,650 | ) | 137,998 | 792,784 | ||||
(a) The grant date fair value of equity awards represents the total of the amounts reported in the “Stock Awards” and “Option Awards” columns in the SCT for the applicable year.
(b) The equity award adjustments for each covered fiscal year include the addition (or subtraction, as applicable) of the following, as applicable: (i) the year-end fair value of any equity awards granted during the covered fiscal year that are outstanding and unvested as of the end of the covered fiscal year; (ii) the amount of change as of the end of the covered fiscal year (from the end of the prior fiscal year) in fair value of any awards granted in prior years that are outstanding and unvested as of the end of the covered fiscal year; (iii) for awards that are granted and vest in same year, the fair value as of the vesting date; (iv) for awards granted in any prior fiscal year that vest at the end of or during the covered fiscal year, the amount equal to the change as of the vesting date (from the end of the prior fiscal year) in fair value; (v) for awards granted in any prior fiscal year that are determined to fail to meet the applicable vesting conditions during the covered fiscal year, a deduction for the amount equal to the fair value at the end of the prior fiscal year; and (vi) the dollar value of any dividends or other earnings paid on stock or option awards in the covered fiscal year prior to the vesting date that are not otherwise reflected in the fair value of such award or included in any other component of total compensation for the covered fiscal year.reflected in the fair value of such award or included in any other component of total compensation for the covered fiscal year. The valuation assumptions used to calculate fair values did not materially differ from those disclosed at the time of grant. The amounts deducted or added in calculating the equity award adjustments are as follows:
| Year | Year End | Year over | Fair Value | Year over Year Change in Fair Value of Equity Awards Granted in Prior Fiscal Year(s) that Vested in Covered Fiscal Year | Fair Value at the End of the Prior Fiscal Year of Equity Awards that Failed to Meet Vesting Conditions in Covered Fiscal Year | Value of Dividends or other Earnings Paid on Stock or Option Awards not Otherwise Reflected in Fair Value or Total Compensation for Covered Fiscal Year | Total Equity Award Adjustments ($) | ||||||||
| 2025 Todisco | 3,986,546 | 1,422,390 |
| 570,469 | 1,277,730 |
|
| 7,257,135 | |||||||
| 2024 Todisco | 2,150,287 | 1,596,149 |
| 302,110 | 187,597 |
|
| 4,236,143 | |||||||
| 2023 Todisco | 737,490 | (349,287 | ) | 347,100 | 61,210 |
|
| 796,513 | |||||||
| Year | Average Reported SCT | Average Reported Value of Equity Awards(a) | Average Equity Award Adjustments(b) | Average Compensation Actually Paid to Non-PEO NEOs | |||||
| 2025 | 3,754,799 | (2,784,318 | ) | 4,046,853 | 5,017,334 | ||||
| 2024 | 1,111,699 | (453,170 | ) | 1,251,158 | 1,909,687 | ||||
| 2023 | 1,175,436 | (520,650 | ) | 137,998 | 792,784 | ||||
(a) The grant date fair value of equity awards represents the total of the amounts reported in the “Stock Awards” and “Option Awards” columns in the SCT for the applicable year.
(b) The equity award adjustments for each covered fiscal year include the addition (or subtraction, as applicable) of the following, as applicable: (i) the year-end fair value of any equity awards granted during the covered fiscal year that are outstanding and unvested as of the end of the covered fiscal year; (ii) the amount of change as of the end of the covered fiscal year (from the end of the prior fiscal year) in fair value of any awards granted in prior years that are outstanding and unvested as of the end of the covered fiscal year; (iii) for awards that are granted and vest in same year, the fair value as of the vesting date; (iv) for awards granted in any prior fiscal year that vest at the end of or during the covered fiscal year, the amount equal to the change as of the vesting date (from the end of the prior fiscal year) in fair value; (v) for awards granted in any prior fiscal year that are determined to fail to meet the applicable vesting conditions during the covered fiscal year, a deduction for the amount equal to the fair value at the end of the prior fiscal year; and (vi) the dollar value of any dividends or other earnings paid on stock or option awards in the covered fiscal year prior to the vesting date that are not otherwise reflected in the fair value of such award or included in any other component of total compensation for the covered fiscal year. The valuation assumptions used to calculate fair values did not materially differ from those disclosed at the time of grant. The amounts deducted or added in calculating the equity award adjustments are as follows:
| Year | Year End Fair Value of Outstanding and Unvested Equity Awards Granted in Covered Fiscal Year | Year over Year Change in Fair Value of Outstanding and Unvested Equity Awards Granted in Prior Fiscal Year(s) | Fair Value as of Vesting Date of Equity Awards Granted and Vested in the Same Year | Year over Year Change in Fair Value of Equity Awards Granted in Prior Fiscal Year(s) that Vested in Covered Fiscal | Fair Value at the End of the Prior Fiscal Year of Equity Awards that Failed to Meet Vesting Conditions in Covered Fiscal Year | Value of Dividends or other Earnings Paid on Stock or Option Awards not Otherwise Reflected in Fair Value or Total Compensation for Covered Fiscal Year | Total Equity | ||||||||||
| 2025 | 2,468,228 | 889,400 |
| 438,166 | 251,058 |
|
|
|
| 4,046,852 | |||||||
| 2024 | 806,355 | 272,320 |
| 113,293 | 59,190 |
|
|
|
| 1,251,158 | |||||||
| 2023 | 199,737 | (67,328 | ) | 139,017 | (90,437 | ) | (42,991 | ) |
| 137,998 | |||||||
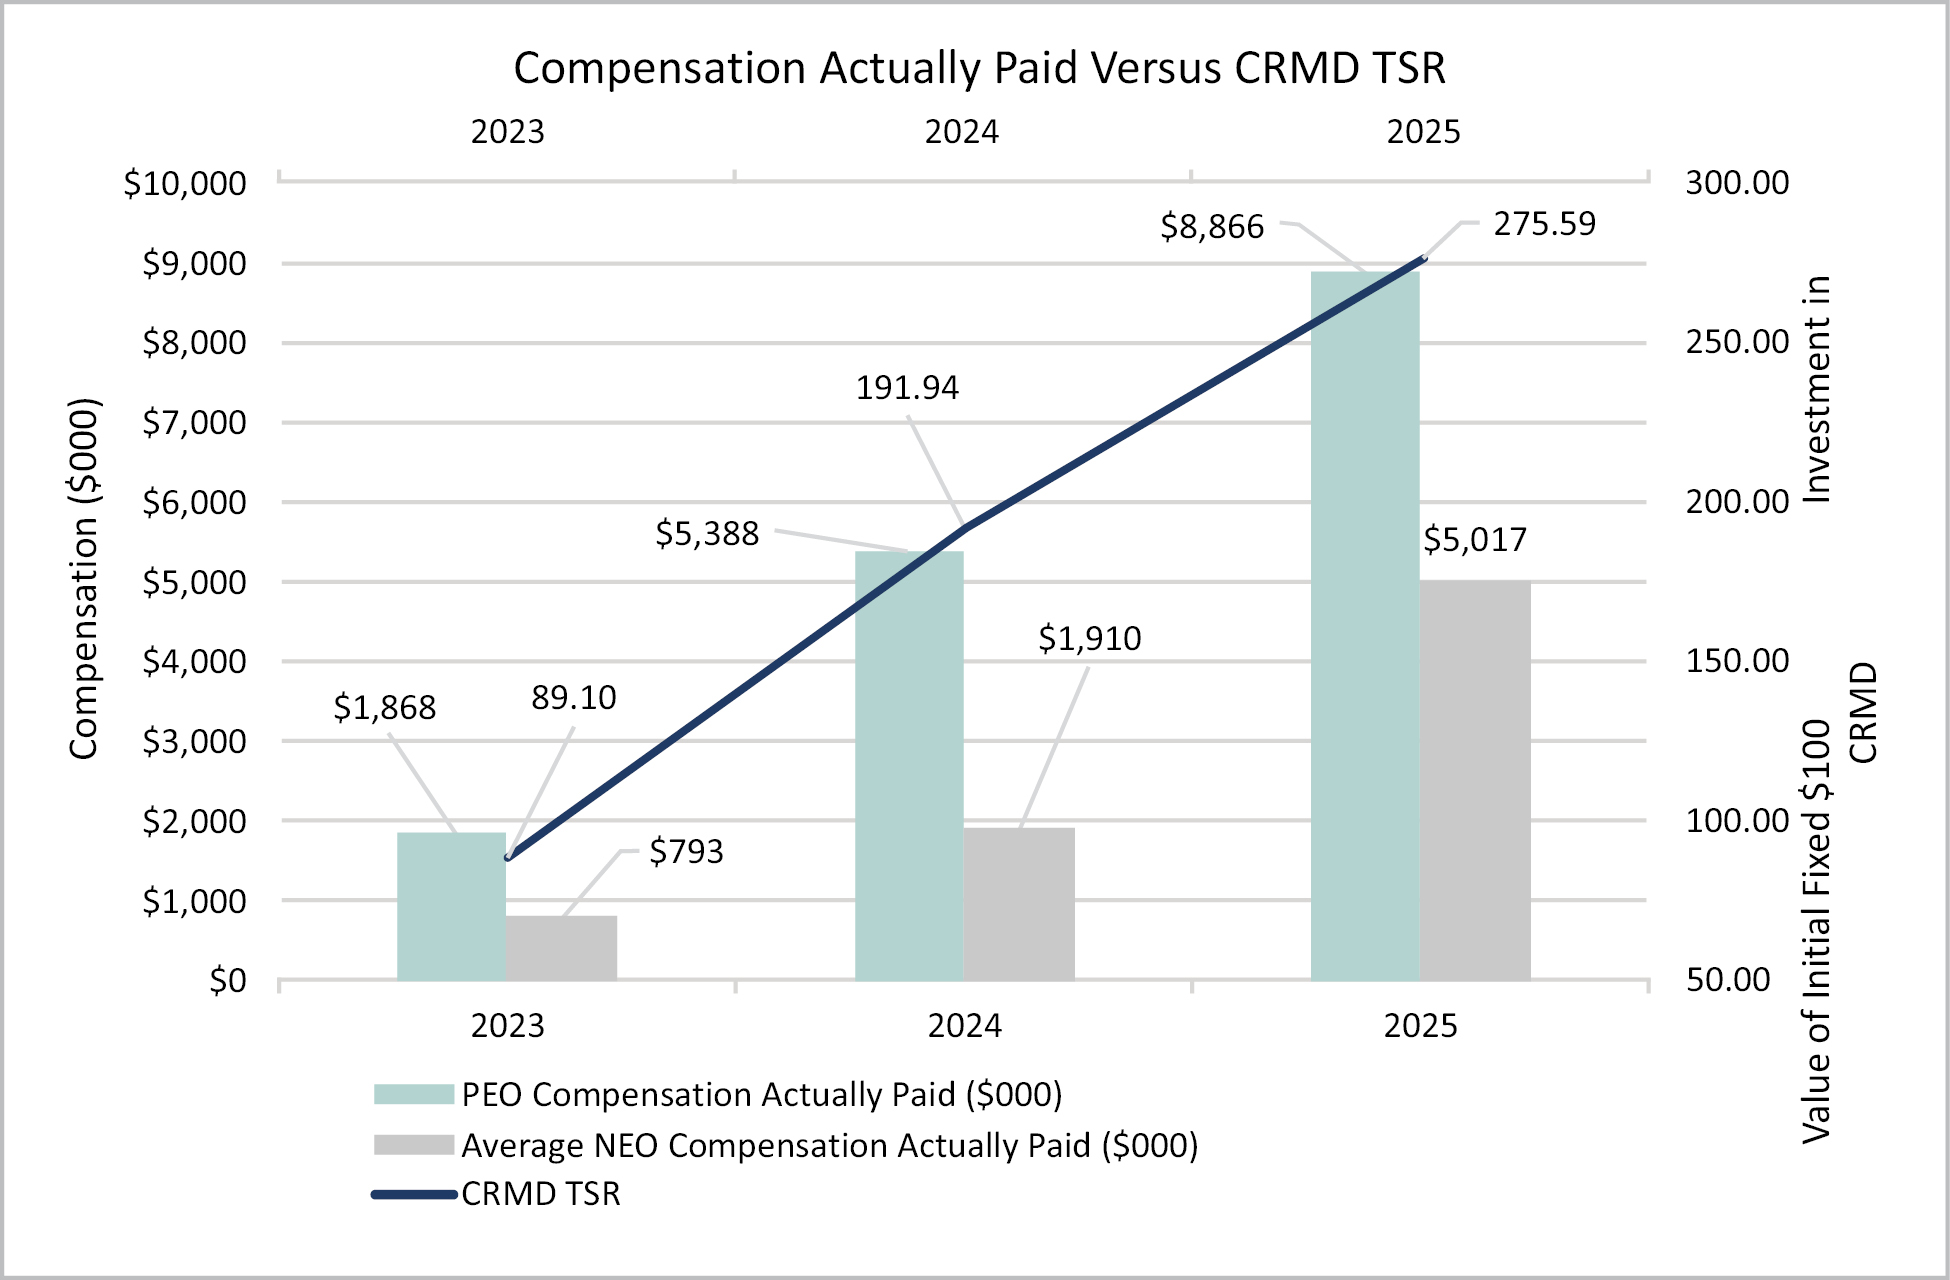
CAP v. TSR
The following graph illustrates a comparison of CAP to our PEOs, the average CAP to our Non-PEO NEOs and the Company’s cumulative TSR over the three-year period from 2023 through 2025.
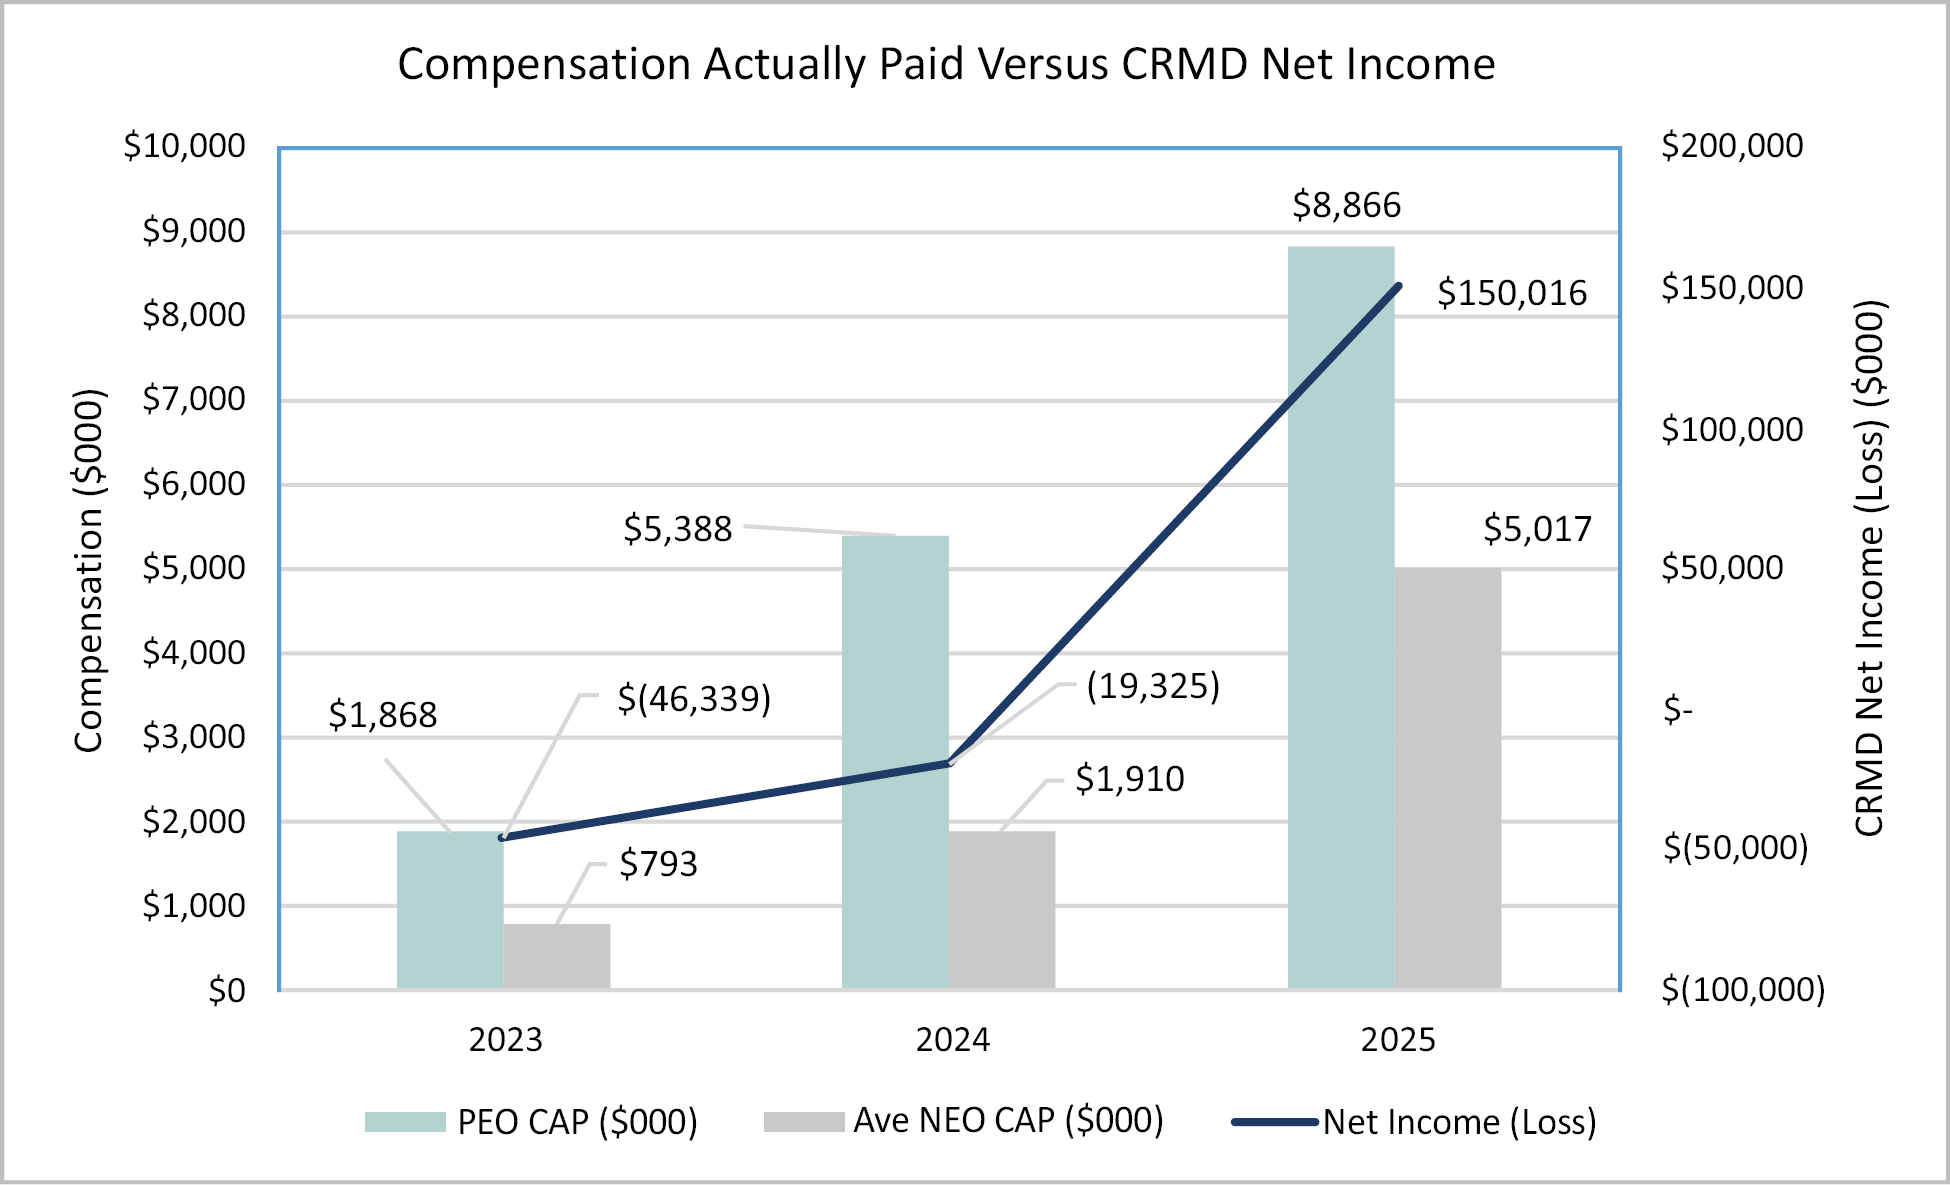
CAP v. Net Income
The following graph illustrates a comparison of CAP to our PEOs, the average CAP to our Non-PEO NEOs and the Company’s Net Income over the three-year period from 2023 through 2025.
| [1] | (1) The Company’s Non-PEO NEOs for the applicable years are as follows: (a) 2025: Elizabeth Hurlburt and Beth Zelnick Kaufman. (b) 2024: Matthew David and Elizabeth Hurlburt. (c) 2023: Matthew David, Phoebe Mounts and Erin Mistry. |
||||||||||||||||||||||||||||||||||||||||||||||||||||||||||||||||||||||||||||||||||||||||||||||||||||||||||||||||||||||||||||||||||||||||||||||||||||||||||||||||||||||||||||||||||||||||||||||||||||||||||||||||||||||||
| [2] | The dollar amounts reported in this column are the average amounts of total compensation reported for the Non-PEO NEOs for each corresponding fiscal year in the “Total” column of the SCT. Refer to the SCT as set forth on page 41 of this proxy statement. | ||||||||||||||||||||||||||||||||||||||||||||||||||||||||||||||||||||||||||||||||||||||||||||||||||||||||||||||||||||||||||||||||||||||||||||||||||||||||||||||||||||||||||||||||||||||||||||||||||||||||||||||||||||||||
| [3] | The dollar amounts shown for CAP are computed in accordance with Item 402(v) of Regulation S-K and do not reflect the cash and/or equity value transferred to the PEO or Non-PEO NEOs during the applicable year. These amounts reflect total compensation as reported in the SCT with certain adjustments as described below:
(a) The grant date fair value of equity awards represents the total of the amounts reported in the “Stock Awards” and “Option Awards” columns in the SCT for the applicable year. (b) The equity award adjustments for each covered fiscal year include the addition (or subtraction, as applicable) of the following, as applicable: (i) the year-end fair value of any equity awards granted during the covered fiscal year that are outstanding and unvested as of the end of the covered fiscal year; (ii) the amount of change as of the end of the covered fiscal year (from the end of the prior fiscal year) in fair value of any awards granted in prior years that are outstanding and unvested as of the end of the covered fiscal year; (iii) for awards that are granted and vest in same year, the fair value as of the vesting date; (iv) for awards granted in any prior fiscal year that vest at the end of or during the covered fiscal year, the amount equal to the change as of the vesting date (from the end of the prior fiscal year) in fair value; (v) for awards granted in any prior fiscal year that are determined to fail to meet the applicable vesting conditions during the covered fiscal year, a deduction for the amount equal to the fair value at the end of the prior fiscal year; and (vi) the dollar value of any dividends or other earnings paid on stock or option awards in the covered fiscal year prior to the vesting date that are not otherwise reflected in the fair value of such award or included in any other component of total compensation for the covered fiscal year. The valuation assumptions used to calculate fair values did not materially differ from those disclosed at the time of grant. The amounts deducted or added in calculating the equity award adjustments are as follows:
(a) The grant date fair value of equity awards represents the total of the amounts reported in the “Stock Awards” and “Option Awards” columns in the SCT for the applicable year. (b) The equity award adjustments for each covered fiscal year include the addition (or subtraction, as applicable) of the following, as applicable: (i) the year-end fair value of any equity awards granted during the covered fiscal year that are outstanding and unvested as of the end of the covered fiscal year; (ii) the amount of change as of the end of the covered fiscal year (from the end of the prior fiscal year) in fair value of any awards granted in prior years that are outstanding and unvested as of the end of the covered fiscal year; (iii) for awards that are granted and vest in same year, the fair value as of the vesting date; (iv) for awards granted in any prior fiscal year that vest at the end of or during the covered fiscal year, the amount equal to the change as of the vesting date (from the end of the prior fiscal year) in fair value; (v) for awards granted in any prior fiscal year that are determined to fail to meet the applicable vesting conditions during the covered fiscal year, a deduction for the amount equal to the fair value at the end of the prior fiscal year; and (vi) the dollar value of any dividends or other earnings paid on stock or option awards in the covered fiscal year prior to the vesting date that are not otherwise reflected in the fair value of such award or included in any other component of total compensation for the covered fiscal year. The valuation assumptions used to calculate fair values did not materially differ from those disclosed at the time of grant. The amounts deducted or added in calculating the equity award adjustments are as follows:
|
||||||||||||||||||||||||||||||||||||||||||||||||||||||||||||||||||||||||||||||||||||||||||||||||||||||||||||||||||||||||||||||||||||||||||||||||||||||||||||||||||||||||||||||||||||||||||||||||||||||||||||||||||||||||
| [4] | Total Shareholder Return shown in this table assumes $100 was invested for the period starting December 31, 2022 through December 31 of the applicable fiscal year in the Company’s common stock as traded under ticker CRMD on Nasdaq. The historical stock price performance of our common stock shown is not necessarily indicative of future stock price performance. | ||||||||||||||||||||||||||||||||||||||||||||||||||||||||||||||||||||||||||||||||||||||||||||||||||||||||||||||||||||||||||||||||||||||||||||||||||||||||||||||||||||||||||||||||||||||||||||||||||||||||||||||||||||||||
| [5] | The dollar amounts reported in this column are the amounts of total compensation reported for the PEO for each corresponding fiscal year in the “Total” column of the SCT. Refer to the SCT as set forth on page 41 of this proxy statement. | ||||||||||||||||||||||||||||||||||||||||||||||||||||||||||||||||||||||||||||||||||||||||||||||||||||||||||||||||||||||||||||||||||||||||||||||||||||||||||||||||||||||||||||||||||||||||||||||||||||||||||||||||||||||||
| [6] | The equity award adjustments for each covered fiscal year include the addition (or subtraction, as applicable) of the following, as applicable: (i) the year-end fair value of any equity awards granted during the covered fiscal year that are outstanding and unvested as of the end of the covered fiscal year; (ii) the amount of change as of the end of the covered fiscal year (from the end of the prior fiscal year) in fair value of any awards granted in prior years that are outstanding and unvested as of the end of the covered fiscal year; (iii) for awards that are granted and vest in same year, the fair value as of the vesting date; (iv) for awards granted in any prior fiscal year that vest at the end of or during the covered fiscal year, the amount equal to the change as of the vesting date (from the end of the prior fiscal year) in fair value; (v) for awards granted in any prior fiscal year that are determined to fail to meet the applicable vesting conditions during the covered fiscal year, a deduction for the amount equal to the fair value at the end of the prior fiscal year; and (vi) the dollar value of any dividends or other earnings paid on stock or option awards in the covered fiscal year prior to the vesting date that are not otherwise reflected in the fair value of such award or included in any other component of total compensation for the covered fiscal year. The valuation assumptions used to calculate fair values did not materially differ from those disclosed at the time of grant. The amounts deducted or added in calculating the equity award adjustments are as follows:
(a) The grant date fair value of equity awards represents the total of the amounts reported in the “Stock Awards” and “Option Awards” columns in the SCT for the applicable year. (b) The equity award adjustments for each covered fiscal year include the addition (or subtraction, as applicable) of the following, as applicable: (i) the year-end fair value of any equity awards granted during the covered fiscal year that are outstanding and unvested as of the end of the covered fiscal year; (ii) the amount of change as of the end of the covered fiscal year (from the end of the prior fiscal year) in fair value of any awards granted in prior years that are outstanding and unvested as of the end of the covered fiscal year; (iii) for awards that are granted and vest in same year, the fair value as of the vesting date; (iv) for awards granted in any prior fiscal year that vest at the end of or during the covered fiscal year, the amount equal to the change as of the vesting date (from the end of the prior fiscal year) in fair value; (v) for awards granted in any prior fiscal year that are determined to fail to meet the applicable vesting conditions during the covered fiscal year, a deduction for the amount equal to the fair value at the end of the prior fiscal year; and (vi) the dollar value of any dividends or other earnings paid on stock or option awards in the covered fiscal year prior to the vesting date that are not otherwise reflected in the fair value of such award or included in any other component of total compensation for the covered fiscal year. The valuation assumptions used to calculate fair values did not materially differ from those disclosed at the time of grant. The amounts deducted or added in calculating the equity award adjustments are as follows: Year Year End Fair Value of Outstanding and Unvested Equity Awards Granted in Covered Fiscal Year Year over Year Change in Fair Value of Outstanding and Unvested Equity Awards Granted in Prior Fiscal Year(s) Fair Value as of Vesting Date of Equity Awards Granted and Vested in the Same Year Year over Year Change in Fair Value of Equity Awards Granted in Prior Fiscal Year(s) that Vested in Covered Fiscal Fair Value at the End of the Prior Fiscal Year of Equity Awards that Failed to Meet Vesting Conditions in Covered Fiscal Year Value of Dividends or other Earnings Paid on Stock or Option Awards not Otherwise Reflected in Fair Value or Total Compensation for Covered Fiscal Year Total Equity |
||||||||||||||||||||||||||||||||||||||||||||||||||||||||||||||||||||||||||||||||||||||||||||||||||||||||||||||||||||||||||||||||||||||||||||||||||||||||||||||||||||||||||||||||||||||||||||||||||||||||||||||||||||||||
| [7] | The grant date fair value of equity awards represents the total of the amounts reported in the “Stock Awards” and “Option Awards” columns in the SCT for the applicable year. | ||||||||||||||||||||||||||||||||||||||||||||||||||||||||||||||||||||||||||||||||||||||||||||||||||||||||||||||||||||||||||||||||||||||||||||||||||||||||||||||||||||||||||||||||||||||||||||||||||||||||||||||||||||||||
| [8] | The grant date fair value of equity awards represents the total of the amounts reported in the “Stock Awards” and “Option Awards” columns in the SCT for the applicable year. | ||||||||||||||||||||||||||||||||||||||||||||||||||||||||||||||||||||||||||||||||||||||||||||||||||||||||||||||||||||||||||||||||||||||||||||||||||||||||||||||||||||||||||||||||||||||||||||||||||||||||||||||||||||||||
| [9] | The equity award adjustments for each covered fiscal year include the addition (or subtraction, as applicable) of the following, as applicable: (i) the year-end fair value of any equity awards granted during the covered fiscal year that are outstanding and unvested as of the end of the covered fiscal year; (ii) the amount of change as of the end of the covered fiscal year (from the end of the prior fiscal year) in fair value of any awards granted in prior years that are outstanding and unvested as of the end of the covered fiscal year; (iii) for awards that are granted and vest in same year, the fair value as of the vesting date; (iv) for awards granted in any prior fiscal year that vest at the end of or during the covered fiscal year, the amount equal to the change as of the vesting date (from the end of the prior fiscal year) in fair value; (v) for awards granted in any prior fiscal year that are determined to fail to meet the applicable vesting conditions during the covered fiscal year, a deduction for the amount equal to the fair value at the end of the prior fiscal year; and (vi) the dollar value of any dividends or other earnings paid on stock or option awards in the covered fiscal year prior to the vesting date that are not otherwise reflected in the fair value of such award or included in any other component of total compensation for the covered fiscal year. The valuation assumptions used to calculate fair values did not materially differ from those disclosed at the time of grant. The amounts deducted or added in calculating the equity award adjustments are as follows:
|
||||||||||||||||||||||||||||||||||||||||||||||||||||||||||||||||||||||||||||||||||||||||||||||||||||||||||||||||||||||||||||||||||||||||||||||||||||||||||||||||||||||||||||||||||||||||||||||||||||||||||||||||||||||||