Pay vs Performance Disclosure - USD ($)
|
12 Months Ended |
Dec. 31, 2025 |
Dec. 31, 2024 |
Dec. 31, 2023 |
Dec. 31, 2022 |
Dec. 31, 2021 |
| Pay vs Performance Disclosure |
|
|
|
|
|
| Pay vs Performance Disclosure, Table |
| | | | | | | | | | | | | | | | | | | | | | | | | | | | | | | | | | | | | | | | | | | | | | | | | | | | | | | | | | | | | | | | | | | | | Year | Summary Compensation Table Total for PEO(1) ($) | | Compensation Actually Paid to PEO(1)(3) ($) | | Avg. Summary Compensation Table Total for Non-PEO NEOs(2) ($) | | Avg. Compensation Actually Paid to Non-PEO NEOs(2)(3) ($) | | Value of Initial Fixed $100 Investment Based on: | | Net Income(5) ($) | | Adjusted EBITDA(6) ($) | | | | | | Total Shareholder Return
($) | | Peer Group(4) Total Shareholder Return ($) | | | | | | | | | | | | | | | | | | | | | | 2025 | 10,635,556 | | 9,268,574 | | 2,841,642 | | 2,612,200 | | 211.10 | | 88.64 | | 188,545 | | 410,406 | | | 2024 | 9,741,876 | | 11,904,788 | | 3,021,796 | | 3,394,172 | | 185.64 | | 96.47 | | 214,298 | | 404,448 | | | 2023 | 8,838,717 | | 17,884,184 | | 3,659,197 | | 5,189,793 | | 162.88 | | 102.52 | | 198,429 | | 376,138 | | | 2022 | 6,251,475 | | 3,428,881 | | 1,867,745 | | 1,166,106 | | 107.86 | | 86.44 | | 199,278 | | 338,408 | | | 2021 | 8,092,225 | | 22,206,757 | | 2,288,230 | | 5,171,829 | | 132.69 | | 122.35 | | 178,873 | | 328,337 | |
|
|
|
|
|
| Company Selected Measure Name |
Adjusted EBITDA
|
|
|
|
|
| Named Executive Officers, Footnote |
David Maher was the principal executive officer ("PEO") for all five years in the table.The Non-PEO NEOs for whom the Summary Compensation Table total average compensation is presented are: for 2025 and 2024, Sean Sullivan, Mary Louise Bohn, Steven Pelisek and Christopher Lindner; for 2023, Sean Sullivan, Thomas Pacheco, Mary Louise Bohn, Steven Pelisek and Christopher Lindner; and for 2022 and 2021, Thomas Pacheco, Mary Louise Bohn, Steven Pelisek and Christopher Lindner.
|
|
|
|
|
| Peer Group Issuers, Footnote |
The selected peer group, the S&P 500 Consumer Durables & Apparel Index (the "PVP Peer Group"), is the same peer group used for performance comparisons under Item 201(e) of Regulation S-K in our Annual Report on Form 10-K for the fiscal year ended December 31, 2025.
|
|
|
|
|
| PEO Total Compensation Amount |
$ 10,635,556
|
$ 9,741,876
|
$ 8,838,717
|
$ 6,251,475
|
$ 8,092,225
|
| PEO Actually Paid Compensation Amount |
$ 9,268,574
|
11,904,788
|
17,884,184
|
3,428,881
|
22,206,757
|
| Adjustment To PEO Compensation, Footnote |
Amounts deducted from the Summary Compensation Table (“SCT”) total to calculate CAP to the PEO and the Non-PEO NEOs, respectively, for the years 2025, 2024, 2023, 2022 and 2021 are set forth in the tables below. The dollar amount of CAP is determined under SEC rules and does not reflect the actual amount of compensation earned by or paid to our PEO, or our Non-PEO NEOs as a group, for the applicable year. | | | | | | | | | | | | | | | | | | | | | | | | | | | | | | | | | | | | | | | | a | | b | | c | | d | | e | | | | | Year | Summary Compensation Table Total
($) | | Summary Compensation
Table Value of Equity Awards
($) | | Summary Compensation Table Change in Pension Value
($) | | Change in Value of Equity Awards
($) | | Pension Service Cost
($) | | PEO CAP
(a-b-c+d+e)
($) | | | | | | | | | | | | | | | | | | | | | | 2025 | 10,635,556 | | -6,500,072 | | -1,404,125 | | 6,186,980 | | 350,235 | | 9,268,574 | | | 2024 | 9,741,876 | | -5,750,032 | | -1,240,517 | | 8,826,251 | | 327,210 | | 11,904,788 | | | 2023 | 8,838,717 | | -5,000,048 | | -965,037 | | 14,694,656 | | 315,896 | | 17,884,184 | | | 2022 | 6,251,475 | | -4,000,052 | | — | | 748,854 | | 428,603 | | 3,428,881 | | | 2021 | 8,092,225 | | -3,500,068 | | -1,444,372 | | 18,717,572 | | 341,399 | | 22,206,757 | |
| | | | | | | | | | | | | | | | | | | | | | | | | | | | | | | | | | | | | | | | | | | | | | | | | Year | | 2021
($) | | 2022
($) | | 2023
($) | | 2024
($) | | 2025
($) | | | | | | | | | | | | | | | SCT Total Compensation | | 8,092,225 | | 6,251,475 | | 8,838,717 | | 9,741,876 | | 10,635,556 | | | Less: Stock Award Values Reported in SCT for Covered Year | | -3,500,068 | | -4,000,052 | | -5,000,048 | | -5,750,032 | | -6,500,072 | | | Plus: Fair Value of Stock Granted in Covered Year | | 6,617,006 | | 3,909,144 | | 7,727,472 | | 6,613,339 | | 7,004,016 | | | Change in Fair Value of Outstanding Unvested Stock Awards from Prior Years | | 5,858,498 | | -2,888,558 | | 4,970,862 | | 1,826,915 | | -192,934 | | | Change in Fair Value of Outstanding Unvested Stock Awards from Prior Years that Vested in Covered Year | | 6,242,069 | | -271,731 | | 1,996,322 | | 385,997 | | -624,102 | | | Less: Change in Value of Pension Benefits in Covered Year | | -1,444,372 | | — | | -965,037 | | -1,240,517 | | -1,404,125 | | | Plus: Pension Service Cost for Covered Year | | 341,399 | | 428,603 | | 315,896 | | 327,210 | | 350,235 | | | Compensation Actually Paid | | 22,206,757 | | 3,428,881 | | 17,884,184 | | 11,904,788 | | 9,268,574 | |
|
|
|
|
|
| Non-PEO NEO Average Total Compensation Amount |
$ 2,841,642
|
3,021,796
|
3,659,197
|
1,867,745
|
2,288,230
|
| Non-PEO NEO Average Compensation Actually Paid Amount |
$ 2,612,200
|
3,394,172
|
5,189,793
|
1,166,106
|
5,171,829
|
| Adjustment to Non-PEO NEO Compensation Footnote |
Amounts deducted from the Summary Compensation Table (“SCT”) total to calculate CAP to the PEO and the Non-PEO NEOs, respectively, for the years 2025, 2024, 2023, 2022 and 2021 are set forth in the tables below. The dollar amount of CAP is determined under SEC rules and does not reflect the actual amount of compensation earned by or paid to our PEO, or our Non-PEO NEOs as a group, for the applicable year. | | | | | | | | | | | | | | | | | | | | | | | | | | | | | | | | | | | | | | | | a | | b | | c | | d | | e | | | | | Year | Summary Compensation Table Total
($) | | Summary Compensation
Table Value of Equity Awards
($) | | Summary Compensation Table Change in Pension Value
($) | | Change in Value of Equity Awards
($) | | Pension Service Cost
($) | | Non-PEO
NEO CAP
(a-b-c+d+e)
($) | | | | | | | | | | | | | | | | | | | | | | 2025 | 2,841,642 | | -1,437,560 | | -214,073 | | 1,366,903 | | 55,288 | | 2,612,200 | | | 2024 | 3,021,796 | | -1,375,061 | | -508,886 | | 2,201,477 | | 54,846 | | 3,394,172 | | | 2023 | 3,659,197 | | -2,186,108 | | -200,810 | | 3,873,869 | | 43,644 | | 5,189,793 | | | 2022 | 1,867,745 | | -950,053 | | — | | 180,126 | | 68,287 | | 1,166,106 | | | 2021 | 2,288,230 | | -787,552 | | -320,089 | | 3,914,662 | | 76,578 | | 5,171,829 | |
| | | | | | | | | | | | | | | | | | | | | | | | | | | | | | | | | | | | | | | | | | | | | | | | | Year | | 2021
($) | | 2022
($) | | 2023
($) | | 2024
($) | | 2025
($) | | | | | | | | | | | | | | | SCT Total Compensation | | 2,288,230 | | 1,867,745 | | 3,659,197 | | 3,021,796 | | 2,841,642 | | | Less: Stock Award Values Reported in SCT for Covered Year | | -787,552 | | -950,053 | | -2,186,108 | | -1,375,061 | | -1,437,560 | | | Plus: Fair Value of Stock Granted in Covered Year | | 1,484,634 | | 921,700 | | 2,662,937 | | 1,586,063 | | 1,544,712 | | | Change in Fair Value of Outstanding Unvested Stock Awards from Prior Years | | 1,330,225 | | -682,305 | | 810,215 | | 495,906 | | -53,933 | | | Change in Fair Value of Outstanding Unvested Stock Awards from Prior Years that Vested in Covered Year | | 1,099,802 | | -59,269 | | 400,718 | | 119,507 | | -123,877 | | | Less: Change in Value of Pension Benefits in Covered Year | | -320,089 | | — | | -200,810 | | -508,886 | | -214,073 | | | Plus: Pension Service Cost for Covered Year | | 76,578 | | 68,287 | | 43,644 | | 54,846 | | 55,288 | | | Compensation Actually Paid | | 5,171,829 | | 1,166,106 | | 5,189,793 | | 3,394,172 | | 2,612,200 | |
|
|
|
|
|
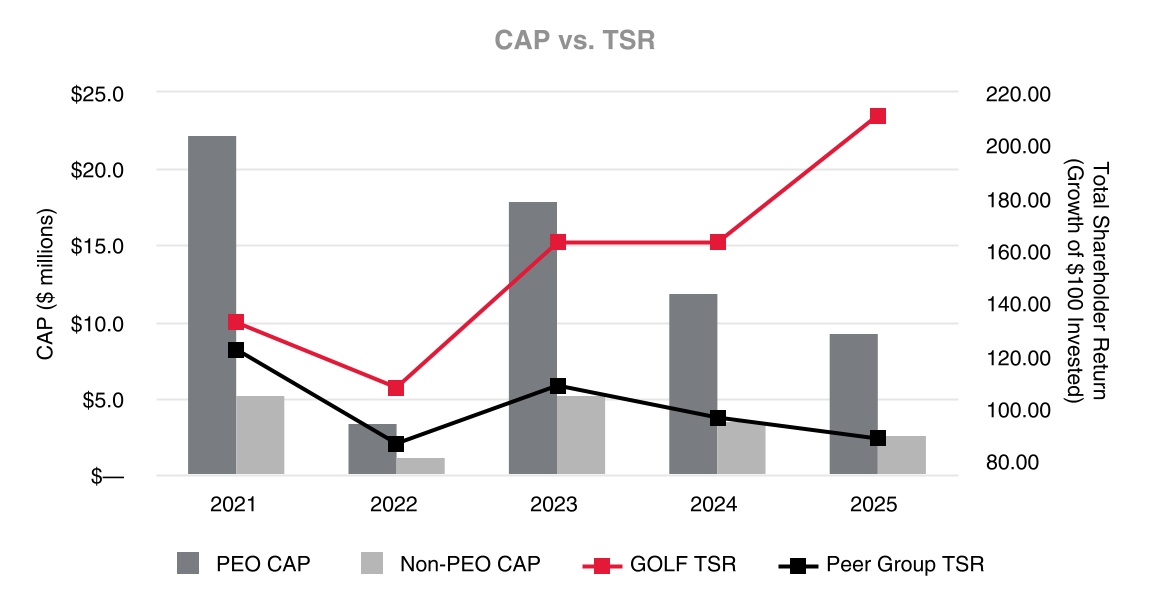
| Compensation Actually Paid vs. Total Shareholder Return |
The graph below compares the CAP to our PEO and the average CAP to our Non-PEO NEOs with our cumulative total shareholder return ("TSR") and the PVP Peer Group's TSR over the five most recently completed fiscal years.
|
|
|
|
|
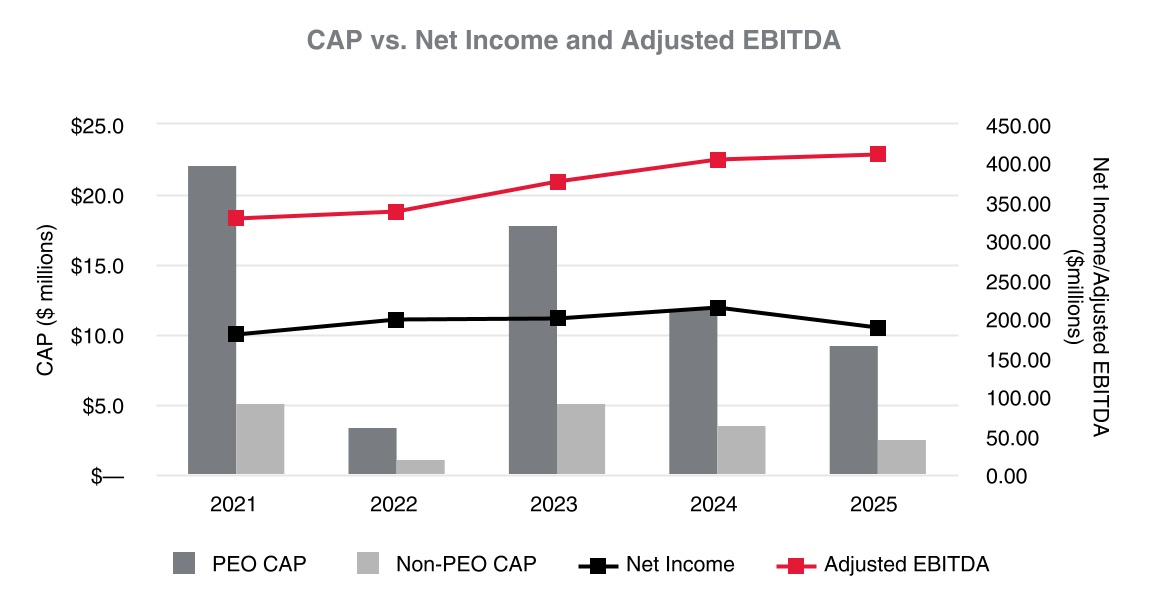
| Compensation Actually Paid vs. Net Income |
The graph below compares the CAP to our PEO and the average CAP to our Non-PEO NEOs with our net income and Adjusted EBITDA over the five most recently completed fiscal years.
|
|
|
|
|
| Compensation Actually Paid vs. Company Selected Measure |
The graph below compares the CAP to our PEO and the average CAP to our Non-PEO NEOs with our net income and Adjusted EBITDA over the five most recently completed fiscal years.
|
|
|
|
|
| Total Shareholder Return Vs Peer Group |
The graph below compares the CAP to our PEO and the average CAP to our Non-PEO NEOs with our cumulative total shareholder return ("TSR") and the PVP Peer Group's TSR over the five most recently completed fiscal years.
|
|
|
|
|
| Tabular List, Table |
| | | | | | | | | Financial Metric | Rationale | | | | Adjusted EBITDA | Measures the Company's profitability | | Operating Income | Measures how profitably management operated the Company over a longer time period and is distinct from the profitability metric used in cash incentive plan | | ROIC | Measures the efficiency of the Company's deployment of capital |
|
|
|
|
|
| Total Shareholder Return Amount |
$ 211.10
|
185.64
|
162.88
|
107.86
|
132.69
|
| Peer Group Total Shareholder Return Amount |
88.64
|
96.47
|
102.52
|
86.44
|
122.35
|
| Net Income (Loss) |
$ 188,545,000
|
$ 214,298,000
|
$ 198,429,000
|
$ 199,278,000
|
$ 178,873,000
|
| Company Selected Measure Amount |
410,406,000
|
404,448,000
|
376,138,000
|
338,408,000
|
328,337,000
|
| PEO Name |
David Maher
|
|
|
|
|
| Additional 402(v) Disclosure |
Reflects the Company's net income (in thousands), as reported in our Annual Report on Form 10-K for the applicable fiscal year.
|
|
|
|
|
| Measure:: 1 |
|
|
|
|
|
| Pay vs Performance Disclosure |
|
|
|
|
|
| Name |
Adjusted EBITDA
|
|
|
|
|
| Non-GAAP Measure Description |
Reflects the Company’s Adjusted EBITDA (in thousands). Adjusted EBITDA is our company-selected measure (“CSM”) because we believe it represents the most important financial performance measure used to link CAP to our NEOs to Company performance. Adjusted EBITDA represents net income (loss) attributable to Acushnet Holdings Corp., adjusted as described in "Management’s Discussion and Analysis of Financial Condition and Results of Operations – Key Performance Measures," Item 7 of Part II to our Annual Report on Form 10-K for the year ended December 31, 2025.
|
|
|
|
|
| Measure:: 2 |
|
|
|
|
|
| Pay vs Performance Disclosure |
|
|
|
|
|
| Name |
Operating Income
|
|
|
|
|
| Measure:: 3 |
|
|
|
|
|
| Pay vs Performance Disclosure |
|
|
|
|
|
| Name |
ROIC
|
|
|
|
|
| PEO | Aggregate Change in Present Value of Accumulated Benefit for All Pension Plans Reported in Summary Compensation Table |
|
|
|
|
|
| Pay vs Performance Disclosure |
|
|
|
|
|
| Adjustment to Compensation, Amount |
$ (1,404,125)
|
$ (1,240,517)
|
$ (965,037)
|
$ 0
|
$ (1,444,372)
|
| PEO | Aggregate Pension Adjustments Service Cost |
|
|
|
|
|
| Pay vs Performance Disclosure |
|
|
|
|
|
| Adjustment to Compensation, Amount |
350,235
|
327,210
|
315,896
|
428,603
|
341,399
|
| PEO | Aggregate Grant Date Fair Value of Equity Award Amounts Reported in Summary Compensation Table |
|
|
|
|
|
| Pay vs Performance Disclosure |
|
|
|
|
|
| Adjustment to Compensation, Amount |
(6,500,072)
|
(5,750,032)
|
(5,000,048)
|
(4,000,052)
|
(3,500,068)
|
| PEO | Equity Awards Adjustments, Excluding Value Reported in Compensation Table |
|
|
|
|
|
| Pay vs Performance Disclosure |
|
|
|
|
|
| Adjustment to Compensation, Amount |
6,186,980
|
8,826,251
|
14,694,656
|
748,854
|
18,717,572
|
| PEO | Year-end Fair Value of Equity Awards Granted in Covered Year that are Outstanding and Unvested |
|
|
|
|
|
| Pay vs Performance Disclosure |
|
|
|
|
|
| Adjustment to Compensation, Amount |
7,004,016
|
6,613,339
|
7,727,472
|
3,909,144
|
6,617,006
|
| PEO | Year-over-Year Change in Fair Value of Equity Awards Granted in Prior Years That are Outstanding and Unvested |
|
|
|
|
|
| Pay vs Performance Disclosure |
|
|
|
|
|
| Adjustment to Compensation, Amount |
(192,934)
|
1,826,915
|
4,970,862
|
(2,888,558)
|
5,858,498
|
| PEO | Change in Fair Value as of Vesting Date of Prior Year Equity Awards Vested in Covered Year |
|
|
|
|
|
| Pay vs Performance Disclosure |
|
|
|
|
|
| Adjustment to Compensation, Amount |
(624,102)
|
385,997
|
1,996,322
|
(271,731)
|
6,242,069
|
| Non-PEO NEO | Aggregate Change in Present Value of Accumulated Benefit for All Pension Plans Reported in Summary Compensation Table |
|
|
|
|
|
| Pay vs Performance Disclosure |
|
|
|
|
|
| Adjustment to Compensation, Amount |
(214,073)
|
(508,886)
|
(200,810)
|
0
|
(320,089)
|
| Non-PEO NEO | Aggregate Pension Adjustments Service Cost |
|
|
|
|
|
| Pay vs Performance Disclosure |
|
|
|
|
|
| Adjustment to Compensation, Amount |
55,288
|
54,846
|
43,644
|
68,287
|
76,578
|
| Non-PEO NEO | Aggregate Grant Date Fair Value of Equity Award Amounts Reported in Summary Compensation Table |
|
|
|
|
|
| Pay vs Performance Disclosure |
|
|
|
|
|
| Adjustment to Compensation, Amount |
(1,437,560)
|
(1,375,061)
|
(2,186,108)
|
(950,053)
|
(787,552)
|
| Non-PEO NEO | Equity Awards Adjustments, Excluding Value Reported in Compensation Table |
|
|
|
|
|
| Pay vs Performance Disclosure |
|
|
|
|
|
| Adjustment to Compensation, Amount |
1,366,903
|
2,201,477
|
3,873,869
|
180,126
|
3,914,662
|
| Non-PEO NEO | Year-end Fair Value of Equity Awards Granted in Covered Year that are Outstanding and Unvested |
|
|
|
|
|
| Pay vs Performance Disclosure |
|
|
|
|
|
| Adjustment to Compensation, Amount |
1,544,712
|
1,586,063
|
2,662,937
|
921,700
|
1,484,634
|
| Non-PEO NEO | Year-over-Year Change in Fair Value of Equity Awards Granted in Prior Years That are Outstanding and Unvested |
|
|
|
|
|
| Pay vs Performance Disclosure |
|
|
|
|
|
| Adjustment to Compensation, Amount |
(53,933)
|
495,906
|
810,215
|
(682,305)
|
1,330,225
|
| Non-PEO NEO | Change in Fair Value as of Vesting Date of Prior Year Equity Awards Vested in Covered Year |
|
|
|
|
|
| Pay vs Performance Disclosure |
|
|
|
|
|
| Adjustment to Compensation, Amount |
$ (123,877)
|
$ 119,507
|
$ 400,718
|
$ (59,269)
|
$ 1,099,802
|