Value of Initial Fixed | ||||||||||||||||||||||||||||||
$100 Investment | ||||||||||||||||||||||||||||||
Average SCT | Average CAP | NASDAQ | Company- | |||||||||||||||||||||||||||
SCT | CAP | SCT | CAP | Compensation | Compensation | Company | Biotech Index | selected | ||||||||||||||||||||||
Compensation | Compensation | Compensation | Compensation | for Other | for Other | Total Share- | Total Share- | Net Loss | Financial Perf. | |||||||||||||||||||||
Year | | for CEO 1 | for CEO 1 | | for CEO 2 | | for CEO 2 | | NEOs | | NEOs | | holder Return | | holder Return | | ($M) | | Measure | |||||||||||
(a) | (b) | (c) | (d) | (e) | (f) | (g) | (h) | (i) | (j) | (k) | ||||||||||||||||||||
2025 | $ | 1,888,175 | $ | (1,619,671) | $ | N/A | $ | N/A | $ | 1,289,268 | $ | 684,323 | $ | 5.88 | $ | 124.75 | $ | (391.0) | $ | — | ||||||||||
2024 | $ | 10,953,192 | $ | 7,048,573 | $ | N/A | $ | N/A | $ | 3,258,633 | $ | 2,925,794 | $ | 26.72 | $ | 118.20 | $ | (372.2) | $ | — | ||||||||||
2023 | $ | 4,794,680 | $ | 5,215,475 | $ | N/A | $ | N/A | $ | 1,689,055 | $ | 1,796,364 | $ | 29.36 | $ | 118.87 | $ | (444.0) | $ | — | ||||||||||
2022 | $ | 5,259,100 | $ | (173,208) | $ | N/A | $ | N/A | $ | 2,159,230 | $ | (50,500) | $ | 23.08 | $ | 113.65 | $ | (395.9) | $ | — | ||||||||||
2021 | $ | 3,216,310 | $ | 3,169,786 | $ | 7,011,698 | $ | (2,484,140) | $ | 3,270,763 | $ | (324,022) | $ | 68.95 | $ | 126.45 | $ | (342.3) | $ | — | ||||||||||
Columns (b), (d) and (f). Reflects compensation amounts reported in the “Summary Compensation Table” (“SCT”) for our CEOs and average amount reported for our non-CEO NEOs, for the respective years shown. Our CEOs and non-CEO NEOs for each of these fiscal years are shown below:
Year | CEO | Non-CEO NEOs |
2025 | Frederick G. Vogt, Ph.D., J.D. | Corleen Roche, Dan Kirby, Igor Bilinsky, Ph.D., Raj Puri, M.D., Ph.D., Jean-Marc Bellemin, Matthew W. Rosinack |
2024 | Frederick G. Vogt, Ph.D., J.D. | Friedrich Graf Finckenstein, M.D., Jean-Marc Bellemin, Igor Bilinsky, Ph.D., Raj Puri, M.D., Ph.D. |
2023 | Frederick G. Vogt, Ph.D., J.D. | Friedrich Graf Finckenstein, M.D., Jean-Marc Bellemin, Igor Bilinsky, Ph.D. |
2022 | Frederick G. Vogt, Ph.D., J.D. | Friedrich Graf Finckenstein, M.D., Jean-Marc Bellemin, Igor Bilinsky, Ph.D. |
2021 | Frederick G. Vogt, Ph.D., J.D. (effective June 10, 2021), Maria Fardis, Ph.D. (until June 10, 2021) | Friedrich Graf Finckenstein, M.D., Jean-Marc Bellemin, Igor Bilinsky, Ph.D., Michael Swartzburg |
Columns (c), (e) and (g). CAP to our CEOs and the average CAP to our non-CEO NEOs for the respective years shown reflect the respective amounts set forth in columns (b), (d) and (f) of the table above, adjusted as determined in accordance with SEC rules and calculation methodology. Adjustments for the fiscal year ended December 31, 2025, are set forth in the table below. The dollar amounts reflected in columns (c), (e) and (g) of the table above do not reflect the actual amount of compensation earned by or paid to our CEOs and non-CEO NEOs during the applicable year. For information regarding the decisions made by our Compensation Committee regarding the CEO’s and average non-CEO NEOs’ compensation for each fiscal year, please see the “Compensation Discussion and Analysis” section in this proxy statement as well as the proxy statements reporting pay for the prior fiscal years covered in these tables.
2025 | ||||||
CAP | Average | |||||
Compensation | CAP | |||||
for | Compensation | |||||
Adjustments | | CEO 1 | | for other NEOs | ||
Reported Summary Compensation Table Total | $ | 1,888,175 | $ | 1,289,268 | ||
Deduction for amounts reported under Stock Awards and Option Awards columns in Summary Compensation Table for applicable fiscal year. | $ | (759,375) | $ | (667,530) | ||
Add back: The year-end fair value of any equity awards granted during the covered fiscal year that are outstanding and unvested as of the end of the fiscal year | $ | 511,873 | $ | 414,854 | ||
The change in fair value of any awards granted in prior years that are outstanding and unvested as of the end of the fiscal year | $ | (1,152,487) | $ | (90,441) | ||
For awards that are granted and vest in the same year, the fair value as of the vesting date | $ | — | $ | — | ||
For awards granted in prior years that vest in the fiscal year, the change in the fair value from the end of the prior fiscal year to the vesting date | $ | (2,107,858) | $ | (261,827) | ||
"Compensation Actually Paid" | (1,619,671) | 684,323 | ||||
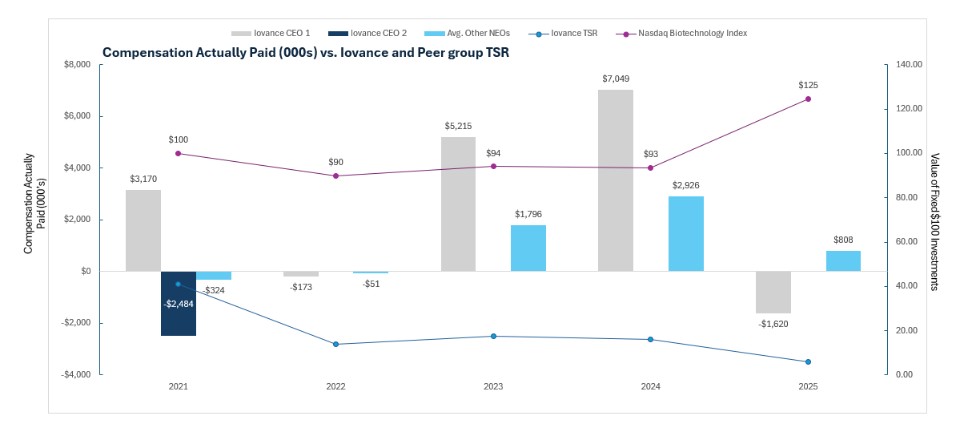
Column (h). Illustrates the value, as of the last day of the indicated fiscal year, of an investment of $100 in the Company’s common stock made on December 31, 2020.
Column (i). Illustrates the value, as of the last day of the indicated fiscal year, of an investment of $100 made on December 31, 2020, in the NASDAQ Biotechnology Index, which is the same peer group used for the Stock Performance Graph included in our Annual Report on Form 10-K for the fiscal year ended December 31, 2025, which was filed with the SEC on February 24, 2026.
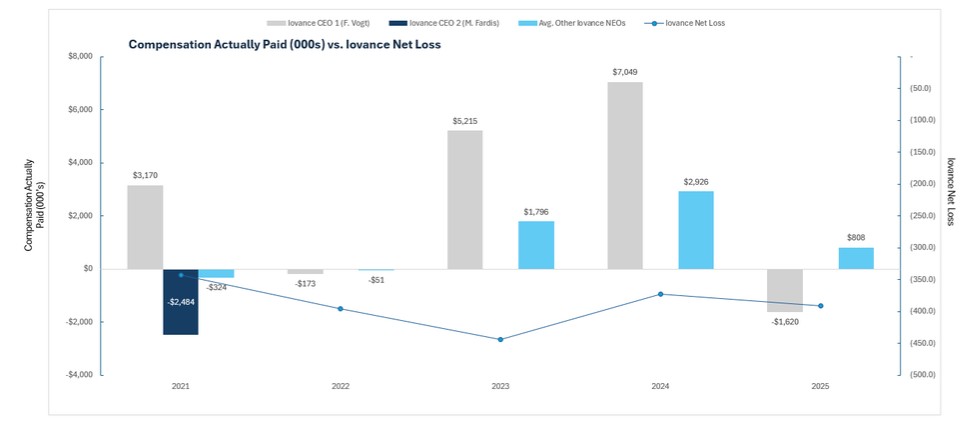
Column (j). Reflects “Net Income” in the Company’s Consolidated Statement of Operations included in the Company’s Annual Reports on Form 10-K for each of the years ended December 31, 2025, 2024, 2023, 2022, and 2021.
Column (k). At this time, given that we have only recently become a commercial company without significant revenue, we do not use any specific company-selected financial measures for purposes of determining “compensation actually paid.” As is the case with many companies in the biotechnology industry, our annual incentive objectives are generally tied to the Company’s strategic and operational goals rather than financial goals. However, our Compensation Committee has approved robust goals and objectives discussed annually in our Compensation Discussion and Analysis section in this proxy statement and the proxy statements reporting pay for the fiscal years covered in these tables. Accordingly, we do not have a financial metric in our executive compensation program that would constitute the Company Selected Measure, as contemplated under the SEC Pay Versus Performance disclosure rules.
Columns (b), (d) and (f). Reflects compensation amounts reported in the “Summary Compensation Table” (“SCT”) for our CEOs and average amount reported for our non-CEO NEOs, for the respective years shown. Our CEOs and non-CEO NEOs for each of these fiscal years are shown below:
Year | CEO | Non-CEO NEOs |
2025 | Frederick G. Vogt, Ph.D., J.D. | Corleen Roche, Dan Kirby, Igor Bilinsky, Ph.D., Raj Puri, M.D., Ph.D., Jean-Marc Bellemin, Matthew W. Rosinack |
2024 | Frederick G. Vogt, Ph.D., J.D. | Friedrich Graf Finckenstein, M.D., Jean-Marc Bellemin, Igor Bilinsky, Ph.D., Raj Puri, M.D., Ph.D. |
2023 | Frederick G. Vogt, Ph.D., J.D. | Friedrich Graf Finckenstein, M.D., Jean-Marc Bellemin, Igor Bilinsky, Ph.D. |
2022 | Frederick G. Vogt, Ph.D., J.D. | Friedrich Graf Finckenstein, M.D., Jean-Marc Bellemin, Igor Bilinsky, Ph.D. |
2021 | Frederick G. Vogt, Ph.D., J.D. (effective June 10, 2021), Maria Fardis, Ph.D. (until June 10, 2021) | Friedrich Graf Finckenstein, M.D., Jean-Marc Bellemin, Igor Bilinsky, Ph.D., Michael Swartzburg |
Column (i). Illustrates the value, as of the last day of the indicated fiscal year, of an investment of $100 made on December 31, 2020, in the NASDAQ Biotechnology Index, which is the same peer group used for the Stock Performance Graph included in our Annual Report on Form 10-K for the fiscal year ended December 31, 2025, which was filed with the SEC on February 24, 2026.
Columns (c), (e) and (g). CAP to our CEOs and the average CAP to our non-CEO NEOs for the respective years shown reflect the respective amounts set forth in columns (b), (d) and (f) of the table above, adjusted as determined in accordance with SEC rules and calculation methodology. Adjustments for the fiscal year ended December 31, 2025, are set forth in the table below. The dollar amounts reflected in columns (c), (e) and (g) of the table above do not reflect the actual amount of compensation earned by or paid to our CEOs and non-CEO NEOs during the applicable year. For information regarding the decisions made by our Compensation Committee regarding the CEO’s and average non-CEO NEOs’ compensation for each fiscal year, please see the “Compensation Discussion and Analysis” section in this proxy statement as well as the proxy statements reporting pay for the prior fiscal years covered in these tables.
2025 | ||||||
CAP | Average | |||||
Compensation | CAP | |||||
for | Compensation | |||||
Adjustments | | CEO 1 | | for other NEOs | ||
Reported Summary Compensation Table Total | $ | 1,888,175 | $ | 1,289,268 | ||
Deduction for amounts reported under Stock Awards and Option Awards columns in Summary Compensation Table for applicable fiscal year. | $ | (759,375) | $ | (667,530) | ||
Add back: The year-end fair value of any equity awards granted during the covered fiscal year that are outstanding and unvested as of the end of the fiscal year | $ | 511,873 | $ | 414,854 | ||
The change in fair value of any awards granted in prior years that are outstanding and unvested as of the end of the fiscal year | $ | (1,152,487) | $ | (90,441) | ||
For awards that are granted and vest in the same year, the fair value as of the vesting date | $ | — | $ | — | ||
For awards granted in prior years that vest in the fiscal year, the change in the fair value from the end of the prior fiscal year to the vesting date | $ | (2,107,858) | $ | (261,827) | ||
"Compensation Actually Paid" | (1,619,671) | 684,323 | ||||