Pay vs Performance Disclosure - USD ($)
Apr. 15, 2025
Apr. 21, 2023
Dec. 31, 2025
Dec. 31, 2023
Dec. 31, 2025
Dec. 31, 2024
Dec. 31, 2023
PAY VERSUS PERFORMANCE
As required by Section 953(a) of the Dodd-Frank Wall Street Reform and Consumer Protection Act and Item 402(v) of Regulation S-K, we are providing the following tables and related disclosure to illustrate the relationship between executive compensation “actually paid” (as calculated herein) and certain measures of our financial performance.
Pay Versus Performance
Year | Compensation Table Total for PEO – Steven A. Sugarman(1) | Compensation Table Total for PEO – David Lowery(1) | Compensation Table Total for PEO – Robert G. Russell(1) | Compensation Actually Paid to PEO – Steven A. Sugarman(1)(3) | Compensation Actually Paid to PEO – David Lowery(1)(3) | Compensation Actually Paid to PEO – Robert G. Russell(1)(3) | Average Summary Compensation Table Total for Non-PEO Named Executive Officers(2) | Average Compensation Actually Paid to Non-PEO Named Executive Officers(2)(3) | Value of Initial Fixed $100 Investment Based On: | Net (loss) Income (thousands) | ||||||||||||||||||||
Total Shareholder Return | ||||||||||||||||||||||||||||||
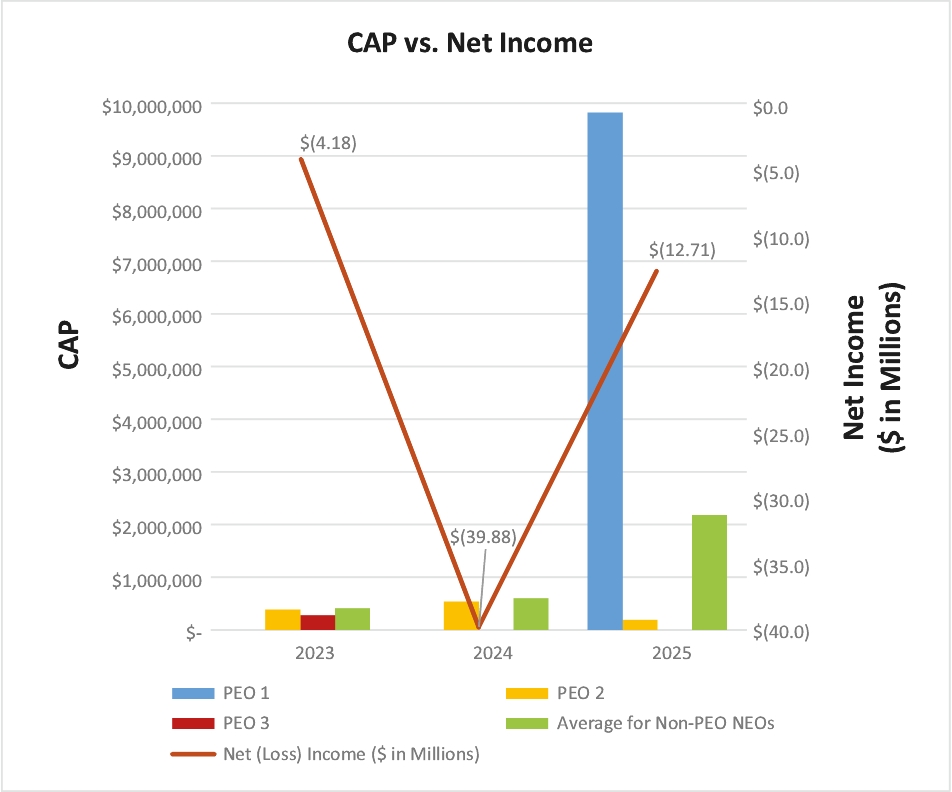
2025 | $7,303,382 | $187,959 | $— | $9,821,089 | $187,959 | $— | $1,357,557 | $2,177,557 | $18.31 | $(12,710) | ||||||||||||||||||||
2024 | $— | $659,887 | $— | $— | $537,816 | $— | $598,579 | $598,579 | $15.20 | $(39,882) | ||||||||||||||||||||
2023 | $— | $434,296 | $274,285 | $— | $384,860 | $274,285 | $409,615 | $409,615 | $26.88 | $(4,179) | ||||||||||||||||||||
(1) | Steven A. Sugarman was appointed President of the Company and a Director on December 30, 2024. On July 2, 2025, he was appointed Chief Executive Officer of the Company, and Chief Executive Officer and President of the Bank and served as Director, President and Chief Executive Officer (PEO) for the remainder of fiscal year ended December 31, 2025. David Lowery served as our Chief Executive Officer (PEO) for the fiscal year ended December 31, 2024. David Lowery resigned as Chief Executive Officer of the Company (PEO), and Chief Executive Officer and President of the Bank effective April 15, 2025. Robert G. Russell served as our Director, President and Chief Executive Officer (PEO) until April 21, 2023 and David Lowery served for the remainder of fiscal year 2023. |
(2) | Carlos P. Salas and William Paul Simmons were our non-PEO NEOs for fiscal year ended December 31, 2025. Joseph D. Perillo and Alfred Botta were our non-PEO NEOs for fiscal year ended December 31, 2024 and December 31, 2023. |
(3) | Compensation “actually paid” is calculated in accordance with Item 402(v) of Regulation S-K. For each of the years presented, the following table sets forth the adjustments made to arrive at compensation “actually paid” to our NEOs during each of the years presented. All amounts are rounded to the nearest dollar. |
Compensation “Actually Paid” Calculation
2025 | 2024 | 2023 | |||||||||||||||||||||||||
Equity Award Adjustments to Determine Compensation “Actually Paid” ($) | PEO – Steven A. Sugarman | PEO – David Lowery | Average Non-PEO NEOs | PEO – David Lowery | PEO – Robert G. Russell | Average Non-PEO NEOs | PEO – David Lowery | PEO – Robert G. Russell | Average Non-PEO NEOs | ||||||||||||||||||
Compensation reported in the Summary Compensation Table (SCT) | $7,303,382 | $187,959 | $1,357,557 | $659,887 | $— | $598,579 | $434,296 | $274,285 | $409,615 | ||||||||||||||||||
(Subtract): value of stock award included in the SCT | (6,382,229) | — | (1,000,000) | (250,002) | — | — | — | — | — | ||||||||||||||||||
Add: fair value of unvested equity awards held as of the end of the covered fiscal year | 3,912,473 | — | 1,820,000 | 133,453 | — | — | — | — | — | ||||||||||||||||||
Add: fair value of granted and vested equity held as of the end of the covered fiscal year | 4,987,463 | — | — | 5,820 | — | — | 11,491 | — | — | ||||||||||||||||||
Add (or Subtract): change in fair value of the unvested equity award from the prior fiscal year to the end of the covered fiscal year | — | — | — | (5,671) | — | — | (40,618) | — | — | ||||||||||||||||||
Add (or Subtract): change in fair value of the vested equity award from the prior fiscal year to the date on which the equity award vested in the covered fiscal year | — | — | — | (5,671) | — | — | (20,309) | — | — | ||||||||||||||||||
Compensation Actually Paid | 9,821,089 | 187,959 | 2,177,557 | 537,816 | — | 598,579 | $384,860 | $274,285 | 409,615 | ||||||||||||||||||