Pay vs Performance Disclosure - USD ($)
|
12 Months Ended |
Dec. 31, 2025 |
Dec. 31, 2024 |
Dec. 31, 2023 |
| Pay vs Performance Disclosure |
|
|
|
| Pay vs Performance Disclosure, Table |
| | | | | | | | | | | | | | | | | | | | | | | | | | | | | | | | | | | | | | | | | | | | | | | | | | | | | Summary Compensation Table Total for PEO (1) | | Compensation Actually Paid to PEO (2) | | | | | | Value of Initial Fixed $100 Investment Based On: | | | | Year | | Mark K. Mason | | C.J. Johnson | | Mark K. Mason | | C.J. Johnson | | Average Summary Compensation Table Total for Non-PEO NEOs | | Average Compensation Actually Paid to Non-PEO NEOs (3) | | Total Shareholder Return | | Net Income (Loss) (in thousands) | | | | | | | | | | | | | | | 2025 | | $ | 6,631,568 | | | $ | — | | | $ | 6,887,819 | | | $ | — | | | $ | 1,800,481 | | | $ | 1,922,671 | | | $ | 55.87 | | | $ | 265,739 | | | 2024 | | $ | 1,983,469 | | | $ | — | | | $ | 2,069,641 | | | $ | — | | | $ | 1,080,710 | | | $ | 1,116,024 | | | $ | 43.76 | | | $ | (144,344) | | | 2023 | | $ | 1,864,109 | | | $ | — | | | $ | 944,692 | | | $ | — | | | $ | 1,081,412 | | | $ | 793,688 | | | $ | 39.70 | | | $ | (27,508) | |
|
|
|
| Named Executive Officers, Footnote |
The amounts included in this column reflect the summary compensation table total for C.J. Johnson and Mark K. Mason for 2025 and for Mark K. Mason for years 2024 and 2023. C.J. Johnson was appointed President and Chief Executive Officer on September 2, 2025, in connection with the closing of the Merger. The following table lists the PEO and non-PEO NEOs for each of fiscal years 2025, 2024 and 2023. | | | | | | | | | | | | | | | Year | | PEO | | Non-PEO NEOs | | | | | | 2025 | | C.J. Johnson and Mark K. Mason | | Nathan Duda, Scott Givans, John M. Michel and William D. Endresen | 2024 | | Mark K. Mason | | John M. Michel and William D. Endresen | 2023 | | Mark K. Mason | | John M. Michel and William D. Endresen |
|
|
|
| Adjustment To PEO Compensation, Footnote |
(2) The dollar amounts reported represent the amount of “compensation actually paid,” as calculated in accordance with the Pay Versus Performance Rules. These dollar amounts do not reflect the actual amounts of compensation earned by or paid to the NEOs during the applicable year. For purposes of calculating “compensation actually paid,” the fair value of equity awards is calculated in accordance with ASC Topic 718 using the same assumption methodologies used to calculate the grant date fair value of awards for purposes of the Summary Compensation Table (refer to “2025 Summary Compensation Table” for additional information). The following table shows the amounts deducted from and added to the Summary Compensation Table total to calculate “compensation actually paid” to Mr. Johnson in 2025 and Mr. Mason in 2023, 2024 and 2025, in accordance with the Pay Versus Performance Rules. | | | | | | | | | | | | | | | | | | | | | | | | | | | | Equity Award Adjustments | | PEO and Year | | Reported Summary Compensation Table Total for PEO | | Less: Reported Value of Equity Awards | | Plus: Equity Award Adjustments | | Compensation Actually Paid to PEO | | | | | | | | | | C.J. Johnson | |
| |
| |
| |
| 2025 | | $ | — | | | $ | — | | | $ | — | | | $ | — | | Mark K. Mason | |
| |
| |
| |
| 2025 | | $ | 6,631,568 | | | $ | — | | | $ | 256,251 | | | $ | 6,887,819 | | 2024 | | 1,983,469 | | | 858,459 | | | 944,631 | | | 2,069,641 | | 2023 | | 1,864,109 | | | 825,697 | | | (93,720) | | | 944,692 | |
|
|
|
| Non-PEO NEO Average Total Compensation Amount |
$ 1,800,481
|
$ 1,080,710
|
$ 1,081,412
|
| Non-PEO NEO Average Compensation Actually Paid Amount |
$ 1,922,671
|
1,116,024
|
793,688
|
| Adjustment to Non-PEO NEO Compensation Footnote |
The following table shows the amounts deducted from and added to the average Summary Compensation Table total compensation to calculate the average “compensation actually paid” to the non-PEO NEOs in accordance with the Pay Versus Performance Rules for 2023, 2024 and 2025: | | | | | | | | | | | | | | | | | | | | | | | | | | | | Year | | Average Reported Summary Compensation Table Total for Non-PEO NEOs | | Less: Average Reported Value of Equity Awards | | Plus: Average Equity Award Adjustments (4) | | Average Compensation Actually Paid to Non-PEO NEOs | | | | | | | | | | 2025 | | $ | 1,800,481 | | | $ | 281,250 | | | $ | 403,440 | | | $ | 1,922,671 | | 2024 | | 1,080,710 | | | 300,519 | | | 335,833 | | | 1,116,024 | | 2023 | | 1,081,412 | | | 245,630 | | | (42,094) | | | 793,688 | |
(4) For 2025, this includes the change in value of Incentive Units and RSUs that were assumed on 9/2/2025 from the date of the Merger.
|
|
|
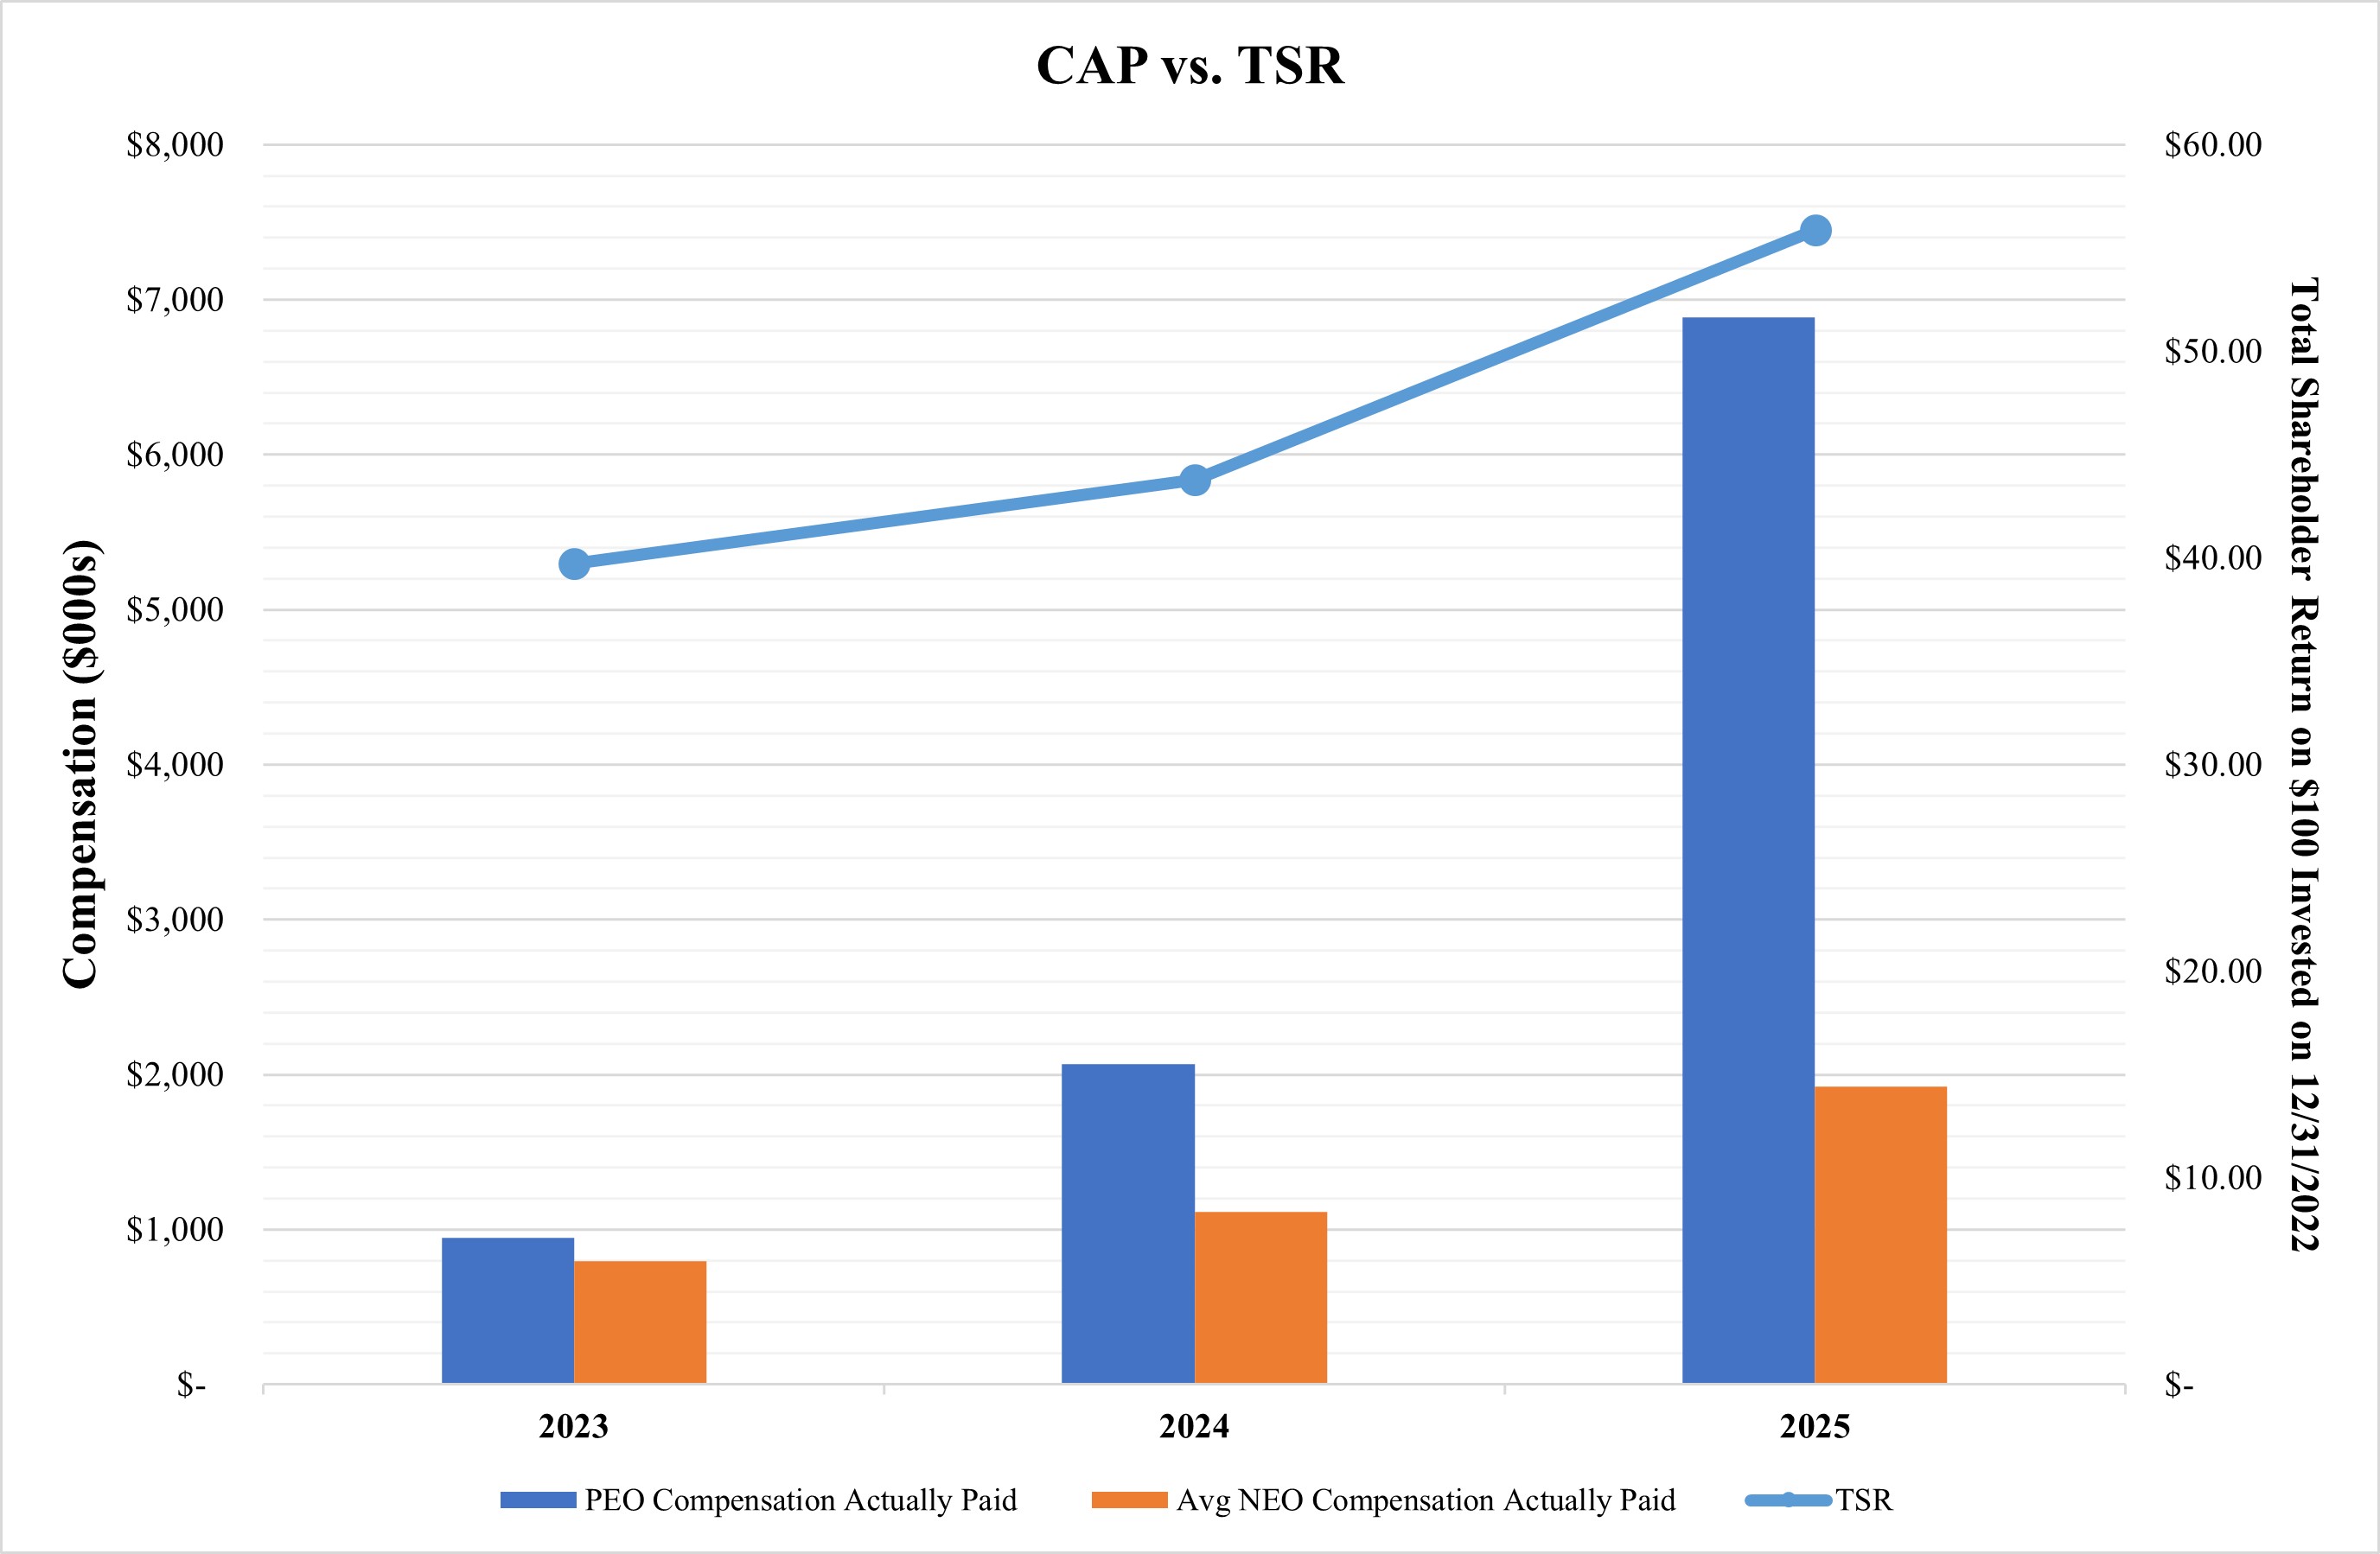
| Compensation Actually Paid vs. Total Shareholder Return |
Compensation Actually Paid and TSR
|
|
|
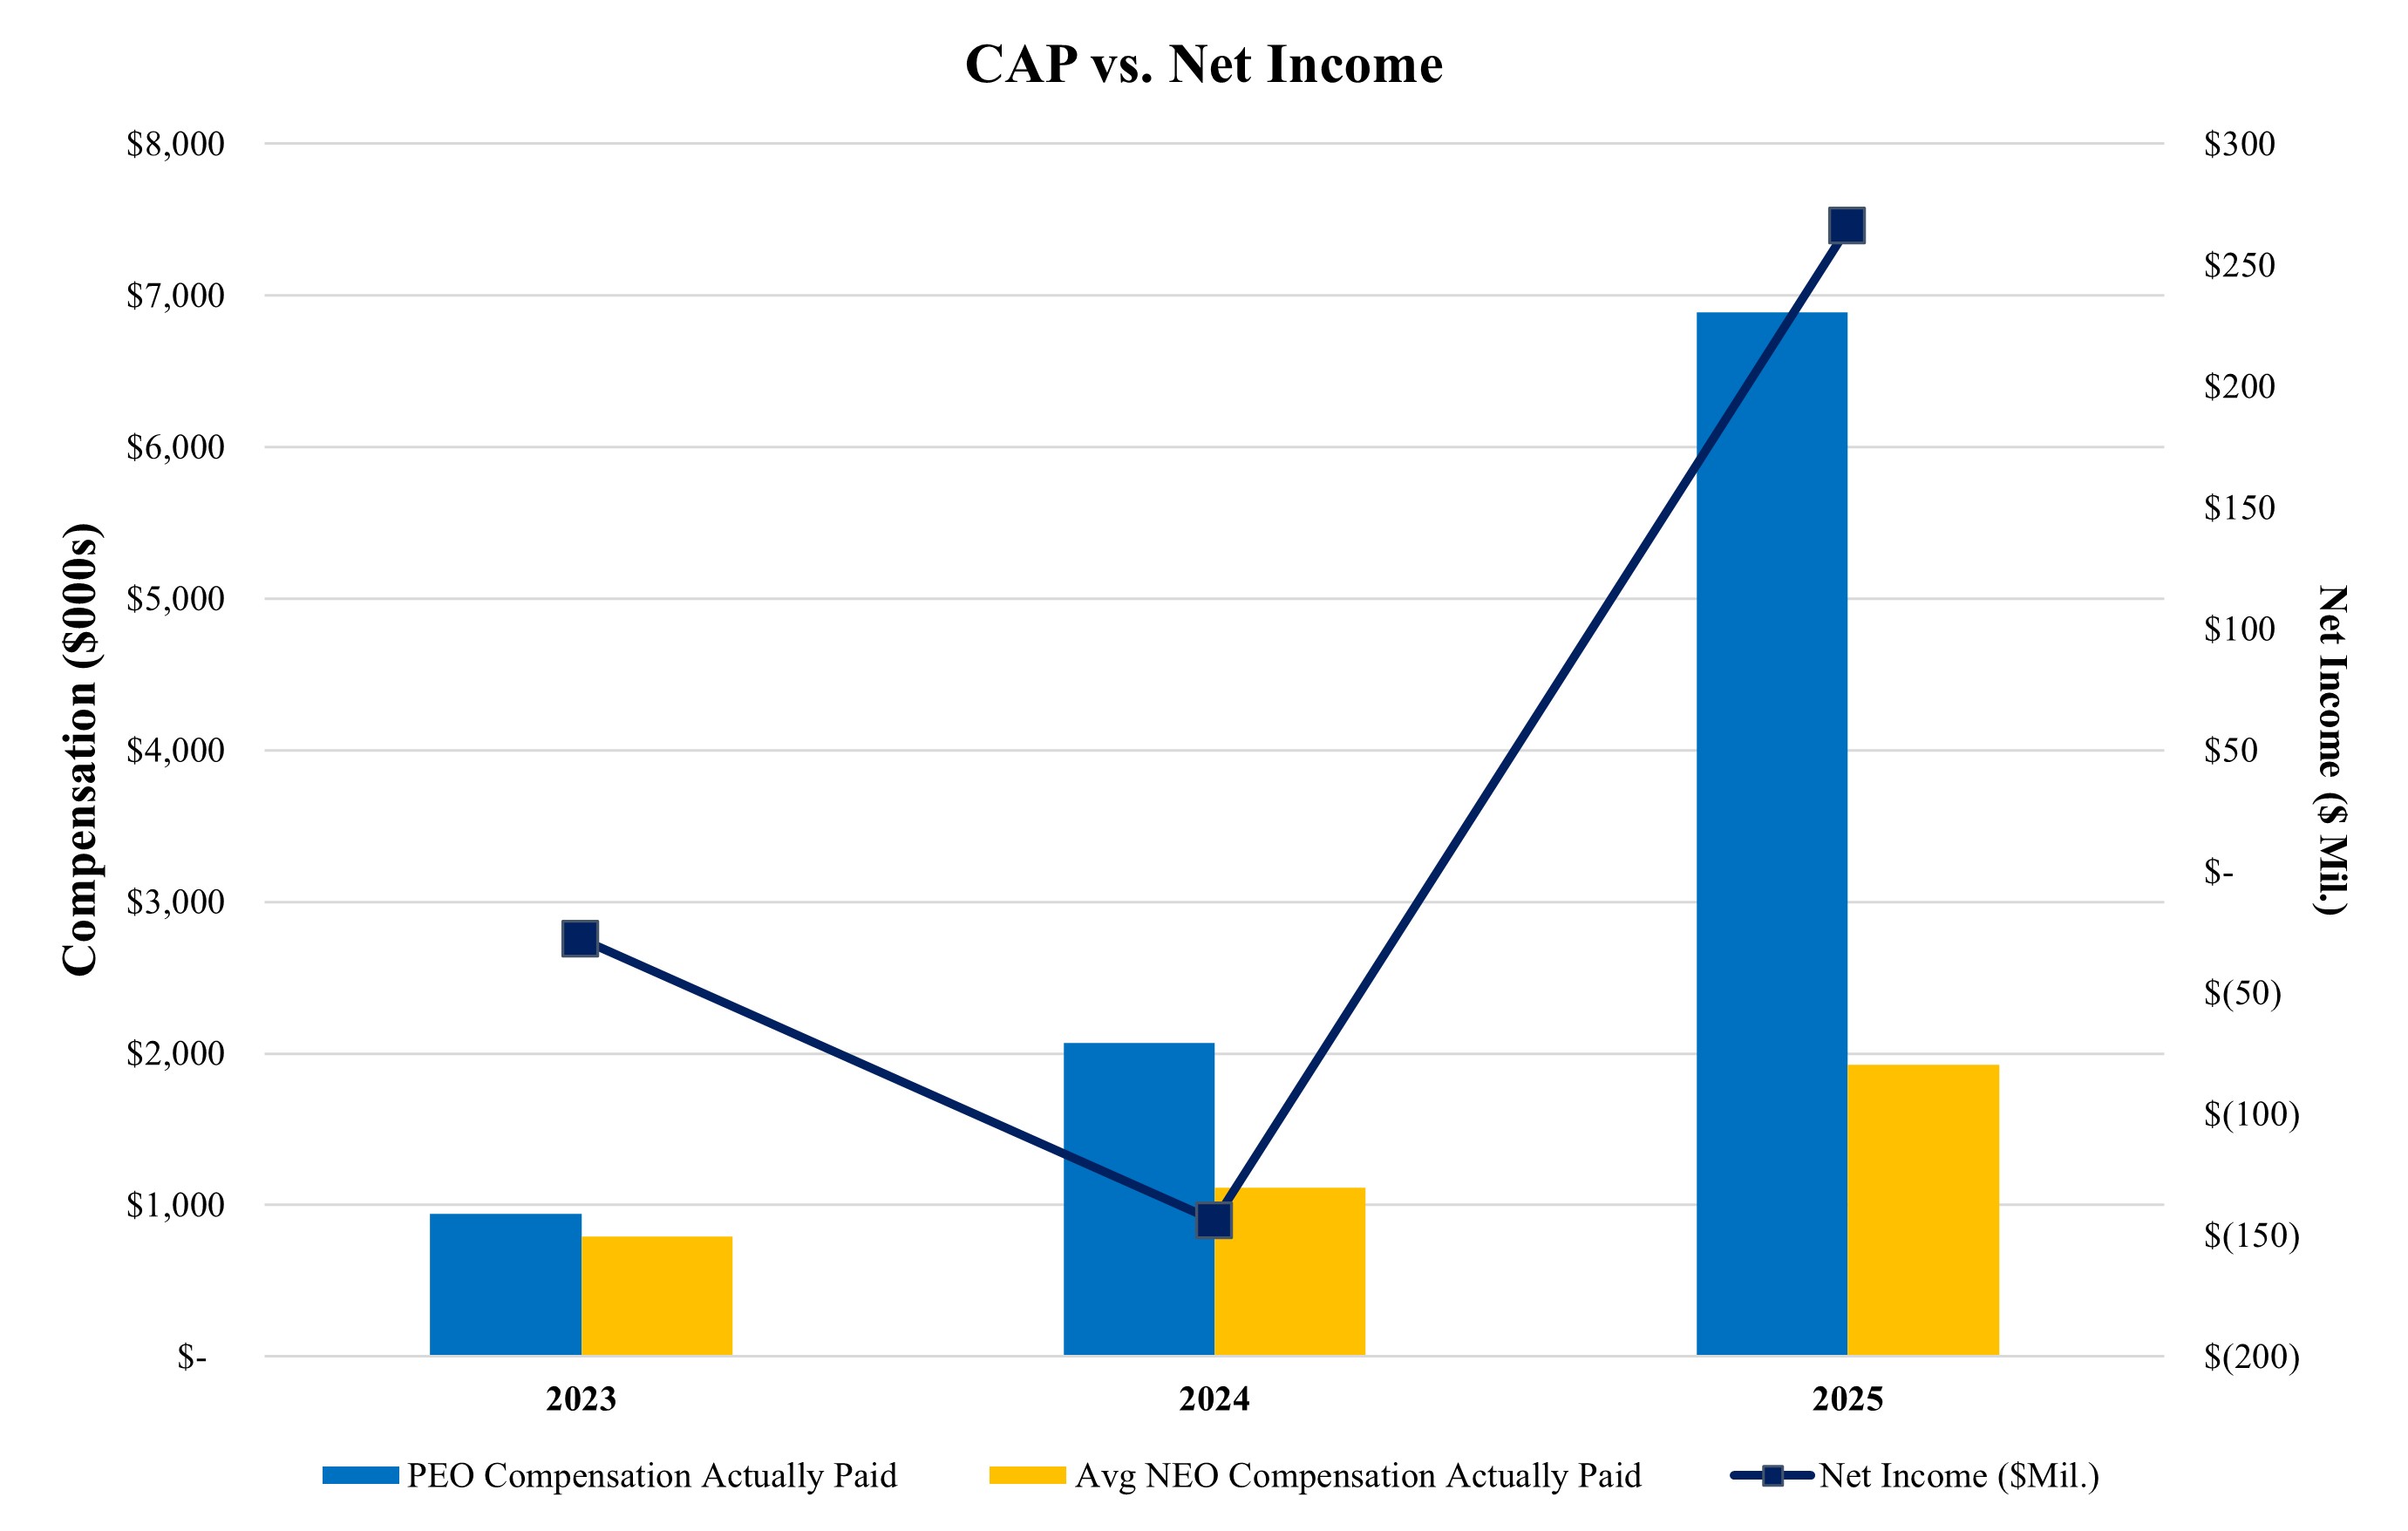
| Compensation Actually Paid vs. Net Income |
Compensation Actually Paid and Net Income
|
|
|
| Total Shareholder Return Amount |
$ 55.87
|
43.76
|
39.70
|
| Net Income (Loss) |
$ 265,739,000
|
$ (144,344,000)
|
$ (27,508,000)
|
| PEO Name |
C.J. Johnson and Mark K. Mason
|
Mark K. Mason
|
Mark K. Mason
|
| Mark K. Mason [Member] |
|
|
|
| Pay vs Performance Disclosure |
|
|
|
| PEO Total Compensation Amount |
$ 6,631,568
|
$ 1,983,469
|
$ 1,864,109
|
| PEO Actually Paid Compensation Amount |
6,887,819
|
2,069,641
|
944,692
|
| C.J. Johnson [Member] |
|
|
|
| Pay vs Performance Disclosure |
|
|
|
| PEO Total Compensation Amount |
0
|
0
|
0
|
| PEO Actually Paid Compensation Amount |
0
|
0
|
0
|
| PEO | Mark K. Mason [Member] | Aggregate Grant Date Fair Value of Equity Award Amounts Reported in Summary Compensation Table |
|
|
|
| Pay vs Performance Disclosure |
|
|
|
| Adjustment to Compensation, Amount |
0
|
(858,459)
|
(825,697)
|
| PEO | Mark K. Mason [Member] | Equity Awards Adjustments, Excluding Value Reported in Compensation Table |
|
|
|
| Pay vs Performance Disclosure |
|
|
|
| Adjustment to Compensation, Amount |
256,251
|
944,631
|
(93,720)
|
| PEO | C.J. Johnson [Member] | Aggregate Grant Date Fair Value of Equity Award Amounts Reported in Summary Compensation Table |
|
|
|
| Pay vs Performance Disclosure |
|
|
|
| Adjustment to Compensation, Amount |
0
|
|
|
| PEO | C.J. Johnson [Member] | Equity Awards Adjustments, Excluding Value Reported in Compensation Table |
|
|
|
| Pay vs Performance Disclosure |
|
|
|
| Adjustment to Compensation, Amount |
0
|
|
|
| Non-PEO NEO | Aggregate Grant Date Fair Value of Equity Award Amounts Reported in Summary Compensation Table |
|
|
|
| Pay vs Performance Disclosure |
|
|
|
| Adjustment to Compensation, Amount |
(281,250)
|
(300,519)
|
(245,630)
|
| Non-PEO NEO | Equity Awards Adjustments, Excluding Value Reported in Compensation Table |
|
|
|
| Pay vs Performance Disclosure |
|
|
|
| Adjustment to Compensation, Amount |
$ 403,440
|
$ 335,833
|
$ (42,094)
|