Pay vs Performance Disclosure - USD ($)
|
12 Months Ended |
Dec. 31, 2025 |
Dec. 31, 2024 |
Dec. 31, 2023 |
Dec. 31, 2022 |
Dec. 31, 2021 |
| Pay vs Performance Disclosure |
|
|
|
|
|
| Pay vs Performance Disclosure, Table |
| | | | | | | | | | | | | | | | | | | | | | | | | | | | | | | | Value of Initial Fixed
$100 Investment
Based On: | | | | | Year | Summary Compensation Table Total for the PEO ($)(1)(2) | Compensation Actually Paid to the PEO ($)(3) | Average Summary Compensation Table Total for the Non-PEO NEOs ($)(2) | Average Compensation Actually Paid to the Non-PEO NEOs ($)(3) | Total Shareholder Return ($)(4) | Peer Group Total Shareholder Return ($)(5) | Net Income (Loss) ($ in thousands)(6) | Non-GAAP Adjusted EBITDA ($ in thousands)(7) | | | | | | | | | | | | | 2025 | 14,164,778 | | (8,552,462) | | 2,195,641 | | 771,050 | | 57.78 | | 123.49 | | (84,461) | | 22,967 | | | | 2024 | 15,414,510 | | 30,912,398 | | 1,101,159 | | 978,020 | | 236.40 | | 162.79 | | (4,987) | | (6,350) | | | | 2023 | 9,665,569 | | 15,192,603 | | 1,310,110 | | 1,858,109 | | 141.64 | | 131.92 | | (69,752) | | (25,783) | | | | 2022 | 2,155,099 | | (7,771,695) | | 1,347,796 | | 649,506 | | 84.81 | | 103.62 | | (69,319) | | (18,845) | | | | 2021 | 1,124,454 | | 1,928,070 | | 516,345 | | 1,617,502 | | 171.67 | | 162.45 | | (75,799) | | (17,793) | | |
|
|
|
|
|
| Company Selected Measure Name |
adjusted EBITDA
|
|
|
|
|
| Named Executive Officers, Footnote |
Savneet Singh served as the principal executive officer (“PEO”) of the Company for 2021, 2022, 2023, 2024, and 2025. Amounts shown for 2024 and 2023 include the Company’s payment of premiums on supplemental long-term disability insurance for Mr. Singh of $7,588 and $7,941, respectively, which were inadvertently excluded in prior years.The dollar amounts reported as total compensation for the Company’s PEO and the average of the amounts reported for the Company’s other NEOs as a group (excluding the PEO) for each corresponding year are the amounts reported in the “Total” column of the Summary Compensation Table, except with respect to the adjustments provided for in footnote 1 above. Refer to “Executive Compensation – Executive Compensation Tables – 2025 Summary Compensation Table” of this proxy statement and the Company’s proxy statements for 2021, 2022, 2023 and 2024. The names of each of the NEOs (excluding the PEO) included for purposes of calculating the average amounts in each applicable year are as follows: (i) for 2025, Bryan A. Menar and Cathy A. King, (ii) for 2024, 2023, and 2022, Bryan A. Menar, Cathy A. King, Raju Malhotra, and Michael Nelson; and (iii) for 2021, Bryan A. Menar, Raju Malhotra, Michael Nelson, and Matthew R. Cicchinelli.
|
|
|
|
|
| Peer Group Issuers, Footnote |
Represents the peer group TSR. The peer group used for this purpose is the Russell 2000 Technology Index.
|
|
|
|
|
| PEO Total Compensation Amount |
$ 14,164,778
|
$ 15,414,510
|
$ 9,665,569
|
$ 2,155,099
|
$ 1,124,454
|
| PEO Actually Paid Compensation Amount |
$ (8,552,462)
|
30,912,398
|
15,192,603
|
(7,771,695)
|
1,928,070
|
| Adjustment To PEO Compensation, Footnote |
In accordance with the requirements of Item 402(v) of Regulation S-K, the following adjustments were made to the PEO’s total reported compensation and non-PEO NEOs’ average total reported compensation for each year to determine the compensation actually paid: | | | | | | | | | | | | | 2025 Adjustments | PEO
($) | Average for
Non-PEO NEOs
($) | | | | | | | Reported Summary Compensation Table Total | 14,164,778 | | 2,195,641 | | | | Less, Grant Date Fair Value of Option Awards and Stock Awards Granted in Fiscal Year | (12,296,322) | | (1,499,948) | | | | Plus, Fair Value at Fiscal Year-End of Outstanding and Unvested Option Awards and Stock Awards Granted in Fiscal Year | 4,821,544 | | 843,038 | | | | Plus (less), Change in Fair Value of Outstanding and Unvested Option Awards and Stock Awards Granted in Prior Fiscal Years | (14,485,805) | | (701,472) | | | | Plus, Fair Value at Vesting of Option Awards and Stock Awards Granted in Fiscal Year That Vested During Fiscal Year | — | | — | | | | Plus (less), Change in Fair Value as of Vesting Date of Option Awards and Stock Awards Granted in Prior Fiscal Years For Which Applicable Vesting Conditions Were Satisfied During Fiscal Year | (756,657) | | (66,209) | | | | Less, Fair Value as of Prior Fiscal Year-End of Option Awards and Stock Awards Granted in Prior Fiscal Years That Failed to Meet Applicable Vesting Conditions During Fiscal Year | — | | — | | | | Equals, Compensation Actually Paid | (8,552,462) | | 771,050 | | |
|
|
|
|
|
| Non-PEO NEO Average Total Compensation Amount |
$ 2,195,641
|
1,101,159
|
1,310,110
|
1,347,796
|
516,345
|
| Non-PEO NEO Average Compensation Actually Paid Amount |
$ 771,050
|
978,020
|
1,858,109
|
649,506
|
1,617,502
|
| Adjustment to Non-PEO NEO Compensation Footnote |
In accordance with the requirements of Item 402(v) of Regulation S-K, the following adjustments were made to the PEO’s total reported compensation and non-PEO NEOs’ average total reported compensation for each year to determine the compensation actually paid: | | | | | | | | | | | | | 2025 Adjustments | PEO
($) | Average for
Non-PEO NEOs
($) | | | | | | | Reported Summary Compensation Table Total | 14,164,778 | | 2,195,641 | | | | Less, Grant Date Fair Value of Option Awards and Stock Awards Granted in Fiscal Year | (12,296,322) | | (1,499,948) | | | | Plus, Fair Value at Fiscal Year-End of Outstanding and Unvested Option Awards and Stock Awards Granted in Fiscal Year | 4,821,544 | | 843,038 | | | | Plus (less), Change in Fair Value of Outstanding and Unvested Option Awards and Stock Awards Granted in Prior Fiscal Years | (14,485,805) | | (701,472) | | | | Plus, Fair Value at Vesting of Option Awards and Stock Awards Granted in Fiscal Year That Vested During Fiscal Year | — | | — | | | | Plus (less), Change in Fair Value as of Vesting Date of Option Awards and Stock Awards Granted in Prior Fiscal Years For Which Applicable Vesting Conditions Were Satisfied During Fiscal Year | (756,657) | | (66,209) | | | | Less, Fair Value as of Prior Fiscal Year-End of Option Awards and Stock Awards Granted in Prior Fiscal Years That Failed to Meet Applicable Vesting Conditions During Fiscal Year | — | | — | | | | Equals, Compensation Actually Paid | (8,552,462) | | 771,050 | | |
|
|
|
|
|
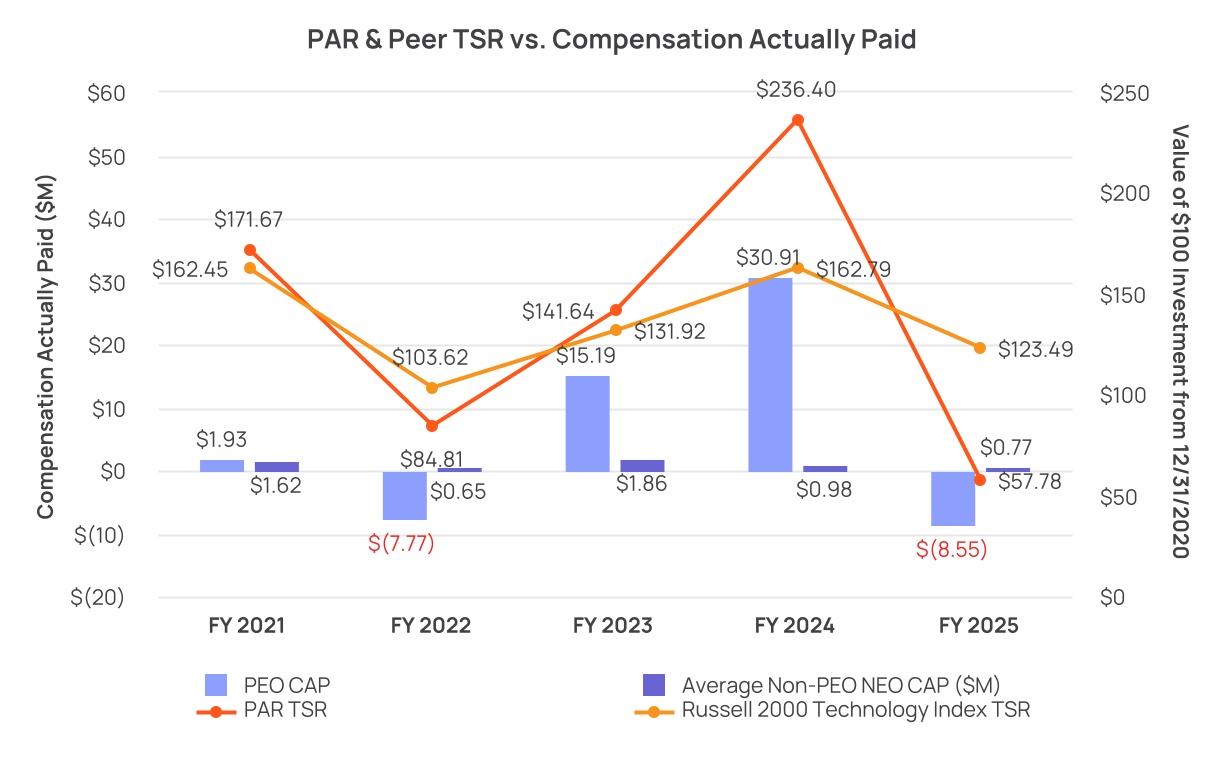
| Compensation Actually Paid vs. Total Shareholder Return |
Compensation actually paid is significantly influenced by changes in our stock price and has thus varied from year to year. In particular, compensation actually paid in 2025 was heavily influenced by our stock price decreasing 50% from the beginning to the end of the year, which in turn had a meaningful negative impact on the value of our NEOs’ equity awards that year (including a decrease of the estimated earn out level of in-progress relative TSR PRSUs).
|
|
|
|
|
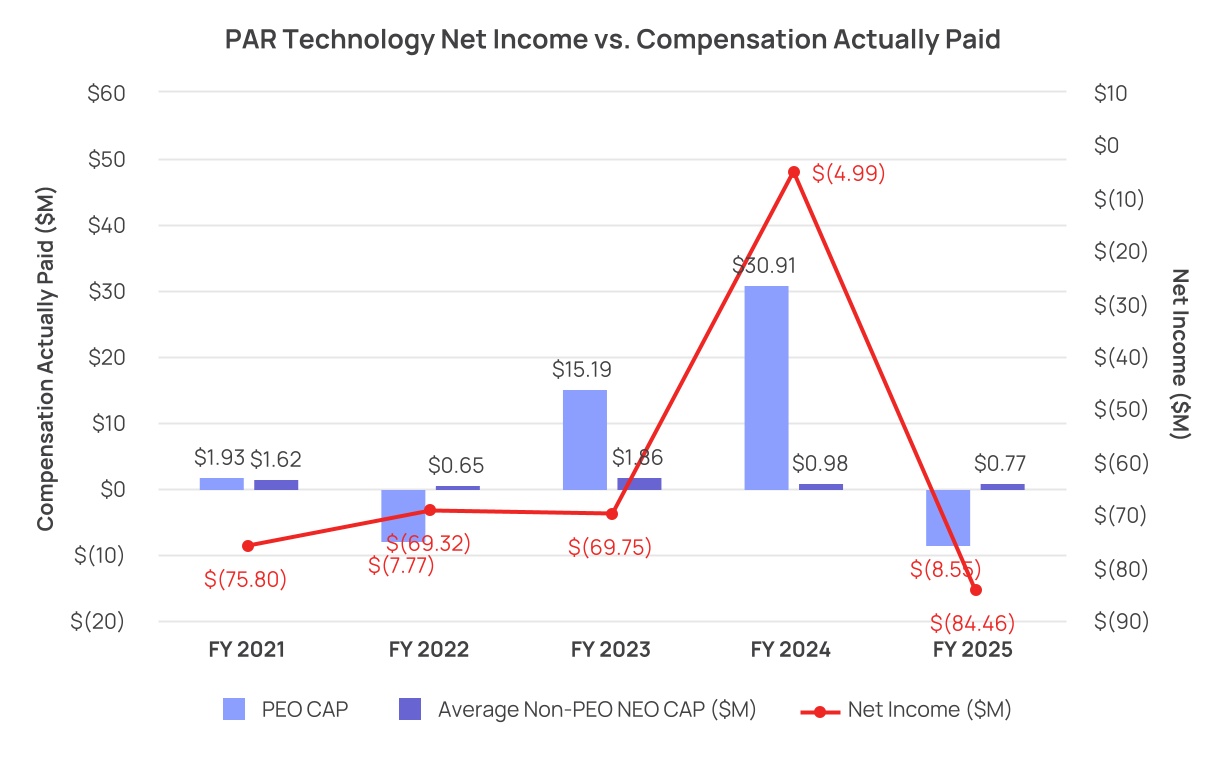
| Compensation Actually Paid vs. Net Income |
|
|
|
|
|
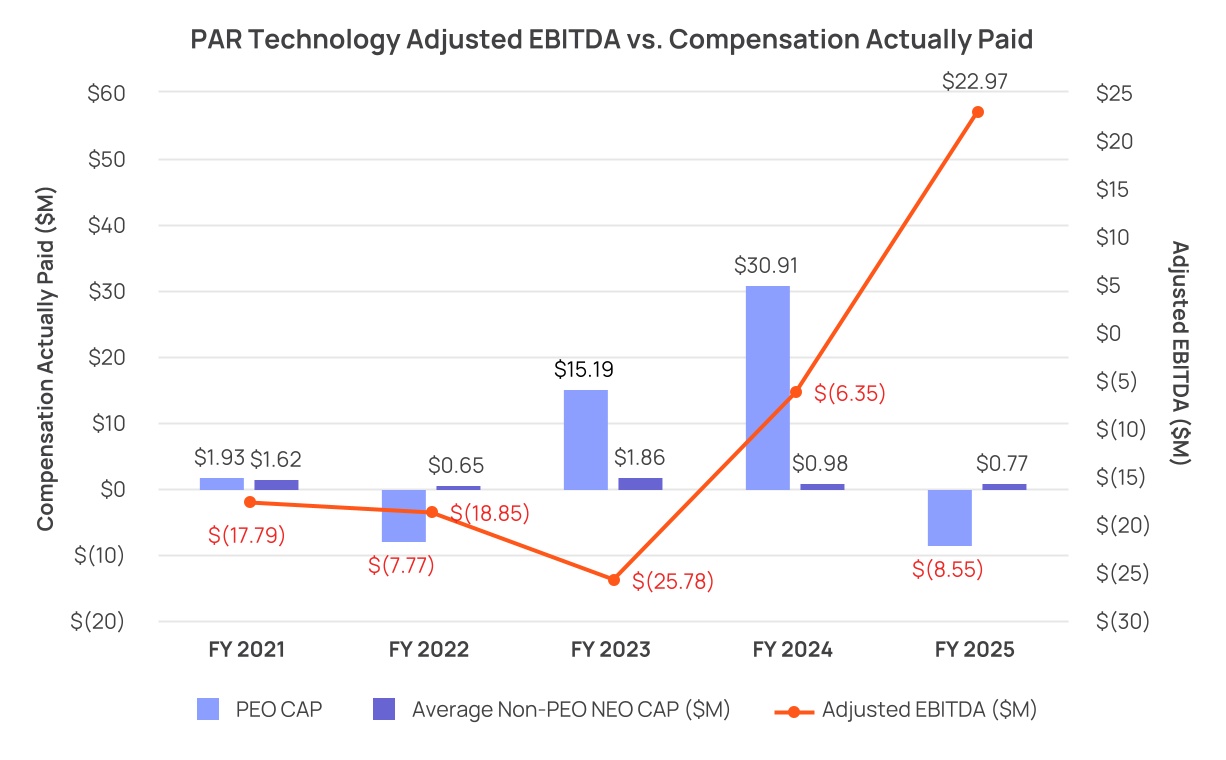
| Compensation Actually Paid vs. Company Selected Measure |
|
|
|
|
|
| Total Shareholder Return Vs Peer Group |
Compensation actually paid is significantly influenced by changes in our stock price and has thus varied from year to year. In particular, compensation actually paid in 2025 was heavily influenced by our stock price decreasing 50% from the beginning to the end of the year, which in turn had a meaningful negative impact on the value of our NEOs’ equity awards that year (including a decrease of the estimated earn out level of in-progress relative TSR PRSUs).
|
|
|
|
|
| Tabular List, Table |
| | | | | | | Compensation Program | Most Important Financial Performance Measures | | | | STI | Non-GAAP Adjusted EBITDA | | Annual Recurring Revenue (ARR) | | LTI | Total Shareholder Return (TSR) |
|
|
|
|
|
| Total Shareholder Return Amount |
$ 57.78
|
236.40
|
141.64
|
84.81
|
171.67
|
| Peer Group Total Shareholder Return Amount |
123.49
|
162.79
|
131.92
|
103.62
|
162.45
|
| Net Income (Loss) |
$ (84,461,000)
|
$ (4,987,000)
|
$ (69,752,000)
|
$ (69,319,000)
|
$ (75,799,000)
|
| Company Selected Measure Amount |
22,967,000
|
(6,350,000)
|
(25,783,000)
|
(18,845,000)
|
(17,793,000)
|
| PEO Name |
Savneet Singh
|
|
|
|
|
| Additional 402(v) Disclosure |
The dollar amounts reported as “compensation actually paid” to the PEO and the average amount reported as “compensation actually paid” to the NEOs as a group (excluding the PEO), are computed in accordance with Item 402(v) of Regulation S-K. The dollar amounts do not reflect the actual amount of compensation earned by or paid to such PEOs and NEOs during the applicable year. The valuation methodologies and assumptions used when calculating the equity values included in compensation actually paid are not materially different than those used when calculating the amounts included in the Summary Compensation Table.Cumulative TSR is calculated by dividing (a) the sum of (i) the cumulative amount of dividends on our common stock for the measurement period (if any), assuming dividend reinvestment, and (ii) the difference between the Company’s share price at the end and the beginning of the measurement period by (b) the Company’s share price at the beginning of the measurement period.The dollar amounts reported represent the amount of net income reflected in the Company’s audited financial statements for the applicable year.
|
|
|
|
|
| Measure:: 1 |
|
|
|
|
|
| Pay vs Performance Disclosure |
|
|
|
|
|
| Name |
Non-GAAP Adjusted EBITDA
|
|
|
|
|
| Non-GAAP Measure Description |
The dollar amounts reported represent the amount of adjusted EBITDA reflected in the Company’s Annual Report on Form 10-K for the fiscal year ended December 31, 2025 (see “Compensation Discussion and Analysis—2025 Executive Compensation Program—Short-Term Incentive Compensation” above for more information).
|
|
|
|
|
| Measure:: 2 |
|
|
|
|
|
| Pay vs Performance Disclosure |
|
|
|
|
|
| Name |
Annual Recurring Revenue (ARR)
|
|
|
|
|
| Measure:: 3 |
|
|
|
|
|
| Pay vs Performance Disclosure |
|
|
|
|
|
| Name |
Total Shareholder Return (TSR)
|
|
|
|
|
| PEO | Aggregate Grant Date Fair Value of Equity Award Amounts Reported in Summary Compensation Table |
|
|
|
|
|
| Pay vs Performance Disclosure |
|
|
|
|
|
| Adjustment to Compensation, Amount |
$ (12,296,322)
|
|
|
|
|
| PEO | Year-end Fair Value of Equity Awards Granted in Covered Year that are Outstanding and Unvested |
|
|
|
|
|
| Pay vs Performance Disclosure |
|
|
|
|
|
| Adjustment to Compensation, Amount |
4,821,544
|
|
|
|
|
| PEO | Year-over-Year Change in Fair Value of Equity Awards Granted in Prior Years That are Outstanding and Unvested |
|
|
|
|
|
| Pay vs Performance Disclosure |
|
|
|
|
|
| Adjustment to Compensation, Amount |
(14,485,805)
|
|
|
|
|
| PEO | Vesting Date Fair Value of Equity Awards Granted and Vested in Covered Year |
|
|
|
|
|
| Pay vs Performance Disclosure |
|
|
|
|
|
| Adjustment to Compensation, Amount |
0
|
|
|
|
|
| PEO | Change in Fair Value as of Vesting Date of Prior Year Equity Awards Vested in Covered Year |
|
|
|
|
|
| Pay vs Performance Disclosure |
|
|
|
|
|
| Adjustment to Compensation, Amount |
(756,657)
|
|
|
|
|
| PEO | Prior Year End Fair Value of Equity Awards Granted in Any Prior Year that Fail to Meet Applicable Vesting Conditions During Covered Year |
|
|
|
|
|
| Pay vs Performance Disclosure |
|
|
|
|
|
| Adjustment to Compensation, Amount |
0
|
|
|
|
|
| Non-PEO NEO | Aggregate Grant Date Fair Value of Equity Award Amounts Reported in Summary Compensation Table |
|
|
|
|
|
| Pay vs Performance Disclosure |
|
|
|
|
|
| Adjustment to Compensation, Amount |
(1,499,948)
|
|
|
|
|
| Non-PEO NEO | Year-end Fair Value of Equity Awards Granted in Covered Year that are Outstanding and Unvested |
|
|
|
|
|
| Pay vs Performance Disclosure |
|
|
|
|
|
| Adjustment to Compensation, Amount |
843,038
|
|
|
|
|
| Non-PEO NEO | Year-over-Year Change in Fair Value of Equity Awards Granted in Prior Years That are Outstanding and Unvested |
|
|
|
|
|
| Pay vs Performance Disclosure |
|
|
|
|
|
| Adjustment to Compensation, Amount |
(701,472)
|
|
|
|
|
| Non-PEO NEO | Vesting Date Fair Value of Equity Awards Granted and Vested in Covered Year |
|
|
|
|
|
| Pay vs Performance Disclosure |
|
|
|
|
|
| Adjustment to Compensation, Amount |
0
|
|
|
|
|
| Non-PEO NEO | Change in Fair Value as of Vesting Date of Prior Year Equity Awards Vested in Covered Year |
|
|
|
|
|
| Pay vs Performance Disclosure |
|
|
|
|
|
| Adjustment to Compensation, Amount |
(66,209)
|
|
|
|
|
| Non-PEO NEO | Prior Year End Fair Value of Equity Awards Granted in Any Prior Year that Fail to Meet Applicable Vesting Conditions During Covered Year |
|
|
|
|
|
| Pay vs Performance Disclosure |
|
|
|
|
|
| Adjustment to Compensation, Amount |
$ 0
|
|
|
|
|