|
PAY VS PERFORMANCE |
|
|
|
|
|
|
|
|
|
|
|
|
|
|
|
|
|
|
Value of Initial Fixed |
|
|
|
|
|
|
Company |
|
||||||||||||||
|
|
|
|
|
|
|
|
|
|
|
|
|
|
|
|
|
|
|
|
|
|
|
|
|
|
|
|
|
|
|
|
|
||||||||
|
|
|
|
|
|
|
|
|
|
|
|
|
|
|
|
|
|
|
|
|
|
|
|
|
|
|
|
|
|
|
|
|
||||||||
Year |
|
Summary |
|
|
Compensation |
|
|
Average Summary |
|
|
Average Compensation |
|
|
Total |
|
|
Peer Group |
|
|
Net |
|
|
Net |
|
||||||||||||||||
|
|
|
|
|
|
|
|
|
|
|
|
|
|
|
|
|
|
|
|
|
|
|
|
|
|
|
|
|
|
|
|
|
||||||||
2025 |
|
$ |
|
12,034,087 |
|
|
$ |
|
9,992,245 |
|
|
$ |
|
4,712,807 |
|
|
$ |
|
1,371,881 |
|
|
$ |
|
150.03 |
|
|
$ |
|
77.88 |
|
|
$ |
|
(187,691 |
) |
|
$ |
|
507,442 |
|
2024 |
|
$ |
|
9,030,345 |
|
|
$ |
|
25,159,437 |
|
|
$ |
|
3,134,001 |
|
|
$ |
|
9,883,766 |
|
|
$ |
|
199.23 |
|
|
$ |
|
78.30 |
|
|
$ |
|
(146,372 |
) |
|
$ |
|
383,481 |
|
2023 |
|
$ |
|
8,654,684 |
|
|
$ |
|
22,347,663 |
|
|
$ |
|
3,035,069 |
|
|
$ |
|
7,714,100 |
|
|
$ |
|
105.62 |
|
|
$ |
|
75.74 |
|
|
$ |
|
(134,661 |
) |
|
$ |
|
314,711 |
|
2022 |
|
$ |
|
6,268,188 |
|
|
$ |
|
5,463,353 |
|
|
$ |
|
2,930,016 |
|
|
$ |
|
2,377,340 |
|
|
$ |
|
58.04 |
|
|
$ |
|
77.81 |
|
|
$ |
|
(99,195 |
) |
|
$ |
|
282,862 |
|
2021 |
|
$ |
|
7,260,144 |
|
|
$ |
|
(172,505 |
) |
|
$ |
|
2,196,905 |
|
|
$ |
|
496,378 |
|
|
$ |
|
59.05 |
|
|
$ |
|
105.76 |
|
|
$ |
|
(49,593 |
) |
|
$ |
|
294,011 |
|
Column (b). Reflects compensation amounts reported in the “Summary Compensation Table” for our Chairman and CEO, Thomas W. Burns, for the respective years shown.
Column (c). “Compensation actually paid” to our CEO in each of 2025, 2024, 2023, 2022 and 2021 reflects the respective amounts set forth in column (b) of the table above, adjusted as set forth in the table below, as determined in accordance with SEC rules. The dollar amounts reflected in column (b) of the table above do not reflect the actual amount of compensation earned by or paid to our CEO during the applicable year. For information regarding the decisions made by our CNG Committee in regards to the CEO’s compensation for each fiscal year, please see the Compensation Discussion & Analysis sections of the proxy statements reporting pay for the fiscal years covered in the table above.
CEO – Thomas W. Burns – Equity Award Adjustment |
||||||||||||||||||||||||||
Year |
|
2025 |
|
|
2024 |
|
|
2023 |
|
|
2022 |
|
|
2021 |
|
|
||||||||||
Summary Compensation Table Total |
|
$ |
|
12,034,087 |
|
|
$ |
|
9,030,345 |
|
|
$ |
|
8,654,684 |
|
|
$ |
|
6,268,188 |
|
|
$ |
|
7,260,144 |
|
|
(Minus): Grant Date Fair Value of Equity Awards Granted in Fiscal Year |
|
$ |
|
(11,177,444 |
) |
|
$ |
|
(8,219,995 |
) |
|
$ |
|
(7,879,784 |
) |
|
$ |
|
(4,767,887 |
) |
|
$ |
|
(5,299,920 |
) |
|
(Minus): Change in Pension Value |
|
$ |
|
0 |
|
|
$ |
|
0 |
|
|
$ |
|
0 |
|
|
$ |
|
0 |
|
|
$ |
|
0 |
|
|
Plus: Pension Service Cost and Associated Prior Service Cost |
|
$ |
|
0 |
|
|
$ |
|
0 |
|
|
$ |
|
0 |
|
|
$ |
|
0 |
|
|
$ |
|
0 |
|
|
Plus: Fair Value at Fiscal Year End of Outstanding and Unvested Equity Awards Granted in the Fiscal Year |
|
$ |
|
7,496,078 |
|
|
$ |
|
10,658,482 |
|
|
$ |
|
13,186,556 |
|
|
$ |
|
2,282,800 |
|
|
$ |
|
2,055,461 |
|
|
Plus/(Minus): Change in Fair Value of Outstanding and Unvested Equity Awards Granted in Prior Fiscal Years |
|
$ |
|
4,020,444 |
|
|
$ |
|
11,370,354 |
|
|
$ |
|
7,429,276 |
|
|
$ |
|
329,529 |
|
|
$ |
|
(4,156,192 |
) |
|
Plus: Fair Value at Vesting of Equity Awards Granted and Vested in the Fiscal Year |
|
$ |
|
0 |
|
|
$ |
|
0 |
|
|
$ |
|
0 |
|
|
$ |
|
0 |
|
|
$ |
|
0 |
|
|
Plus/(Minus): Change in Fair Value as of the Vesting Date of Equity Awards Granted in Prior Fiscal Years that Vested in the Fiscal Year |
|
$ |
|
(2,380,921 |
) |
|
$ |
|
2,320,251 |
|
|
$ |
|
956,931 |
|
|
$ |
|
1,350,723 |
|
|
$ |
|
(31,998 |
) |
|
(Minus): Fair Value as of the Prior Fiscal Year End of Equity Awards Granted in Prior Fiscal Years that Failed to Meet Vesting Conditions in the Fiscal Year |
|
$ |
|
0 |
|
|
$ |
|
0 |
|
|
$ |
|
0 |
|
|
$ |
|
0 |
|
|
$ |
|
0 |
|
|
Plus: Value of Dividends or Other Earnings Paid on Equity Awards Not Otherwise Reflected in Total Compensation |
|
$ |
|
0 |
|
|
$ |
|
0 |
|
|
$ |
|
0 |
|
|
$ |
|
0 |
|
|
$ |
|
0 |
|
|
Compensation Actually Paid |
|
$ |
|
9,992,245 |
|
|
$ |
|
25,159,437 |
|
|
$ |
|
22,347,663 |
|
|
$ |
|
5,463,353 |
|
|
$ |
|
(172,505 |
) |
|
Equity Valuations: Stock option grant date fair values are calculated based on the Black-Scholes option pricing model as of date of grant. Adjustments have been made using stock option fair values as of each measurement date using the stock price as of the measurement date and updated assumptions (i.e., term, volatility, dividend yield, risk free rates) as of the measurement date. Performance-based restricted share unit grant date fair values are calculated using the stock price as of date of grant assuming target performance. Adjustments have been made using the stock price and performance accrual modifier as of year end and as of the date of vest. Time-vested restricted share unit grant date fair values are calculated using the stock price as of date of grant. Adjustments have been made using the stock price as of year end and as of each date of vest.
Column (d). The following non-CEO named executive officers are included in the average figures shown:
2021: Joseph E. Gilliam, Chris M. Calcaterra
2022: Joseph E. Gilliam, Alex R. Thurman, Tomas Navratil, Chris M. Calcaterra
2023: Joseph E. Gilliam, Alex R. Thurman, Tomas Navratil
2024: Joseph E. Gilliam, Alex R. Thurman, Tomas Navratil
2025: Joseph E. Gilliam, Alex R. Thurman, Tomas Navratil
Column (e). Average “compensation actually paid” for our non-CEO Named Executive Officers in each of 2025, 2024, 2023, 2022 and 2021 reflects the respective amounts set forth in column (d) of the table above, adjusted as set forth in the table below, as determined in accordance with SEC rules. The dollar amounts reflected in column (d) of the table above do not reflect the actual amount of compensation earned by or paid to our non-CEO Named Executive Officers during the applicable year. For information regarding the decisions made by our CNG Committee in regards to the non-CEO Named Executive Officers’ compensation for each fiscal year, please the Compensation Discussion and Analysis sections of the proxy statements reporting pay for the fiscal years covered in the table above.
Non-CEO Equity Award Adjustment |
||||||||||||||||||||||||||
Year |
|
2025 |
|
|
2024 |
|
|
2023 |
|
|
2022 |
|
|
2021 |
|
|
||||||||||
Summary Compensation Table Total |
|
$ |
|
4,712,807 |
|
|
$ |
|
3,134,001 |
|
|
$ |
|
3,035,069 |
|
|
$ |
|
2,930,016 |
|
|
$ |
|
2,196,905 |
|
|
(Minus): Grant Date Fair Value of Equity Awards Granted in Fiscal Year |
|
$ |
|
(3,778,475 |
) |
|
$ |
|
(2,301,685 |
) |
|
$ |
|
(2,146,240 |
) |
|
$ |
|
(2,362,978 |
) |
|
$ |
|
(1,199,996 |
) |
|
(Minus): Change in Pension Value |
|
$ |
|
0 |
|
|
$ |
|
0 |
|
|
$ |
|
0 |
|
|
$ |
|
0 |
|
|
$ |
|
0 |
|
|
Plus: Pension Service Cost and Associated Prior Service Cost |
|
$ |
|
0 |
|
|
$ |
|
0 |
|
|
$ |
|
0 |
|
|
$ |
|
0 |
|
|
$ |
|
0 |
|
|
Plus: Fair Value at Fiscal Year End of Outstanding and Unvested Equity Awards Granted in the Fiscal Year |
|
$ |
|
1,711,790 |
|
|
$ |
|
2,789,624 |
|
|
$ |
|
3,565,429 |
|
|
$ |
|
1,477,439 |
|
|
$ |
|
861,492 |
|
|
Plus/(Minus): Change in Fair Value of Outstanding and Unvested Equity Awards Granted in Prior Fiscal Years |
|
$ |
|
112,303 |
|
|
$ |
|
5,851,958 |
|
|
$ |
|
3,013,218 |
|
|
$ |
|
61,800 |
|
|
$ |
|
(1,490,771 |
) |
|
Plus: Fair Value at Vesting of Equity Awards Granted and Vested in the Fiscal Year |
|
$ |
|
0 |
|
|
$ |
|
0 |
|
|
$ |
|
0 |
|
|
$ |
|
0 |
|
|
$ |
|
0 |
|
|
Plus/(Minus): Change in Fair Value as of the Vesting Date of Equity Awards Granted in Prior Fiscal Years that Vested in the Fiscal Year |
|
$ |
|
(1,386,545 |
) |
|
$ |
|
409,867 |
|
|
$ |
|
246,624 |
|
|
$ |
|
271,063 |
|
|
$ |
|
128,748 |
|
|
(Minus): Fair Value as of the Prior Fiscal Year End of Equity Awards Granted in Prior Fiscal Years that Failed to Meet Vesting Conditions in the Fiscal Year |
|
$ |
|
0 |
|
|
$ |
|
0 |
|
|
$ |
|
0 |
|
|
$ |
|
0 |
|
|
$ |
|
0 |
|
|
Plus: Value of Dividends or Other Earnings Paid on Equity Awards Not Otherwise Reflected in Total Compensation |
|
$ |
|
0 |
|
|
$ |
|
0 |
|
|
$ |
|
0 |
|
|
$ |
|
0 |
|
|
$ |
|
0 |
|
|
Compensation Actually Paid |
|
$ |
|
1,371,881 |
|
|
$ |
|
9,883,766 |
|
|
$ |
|
7,714,100 |
|
|
$ |
|
2,377,340 |
|
|
$ |
|
496,378 |
|
|
Equity Valuations: Stock option grant date fair values are calculated based on the Black-Scholes option pricing model as of date of grant. Adjustments have been made using stock option fair values as of each measurement date using the stock price as of the measurement date and updated assumptions (i.e., term, volatility, dividend yield, risk free rates) as of the measurement date. Performance-based restricted share unit grant date fair values are calculated using the stock price as of date of grant assuming target performance. Adjustments have been made using the stock price and performance accrual modifier as of year end and as of the date of vest. Time-based restricted share unit grant date fair values are calculated using the stock price as of date of grant. Adjustments have been made using the stock price as of year end and as of each date of vest. The aggregate change in actuarial present value of accumulated benefit under pension plans reflects the amount reported for the applicable year in the Summary Compensation Table.
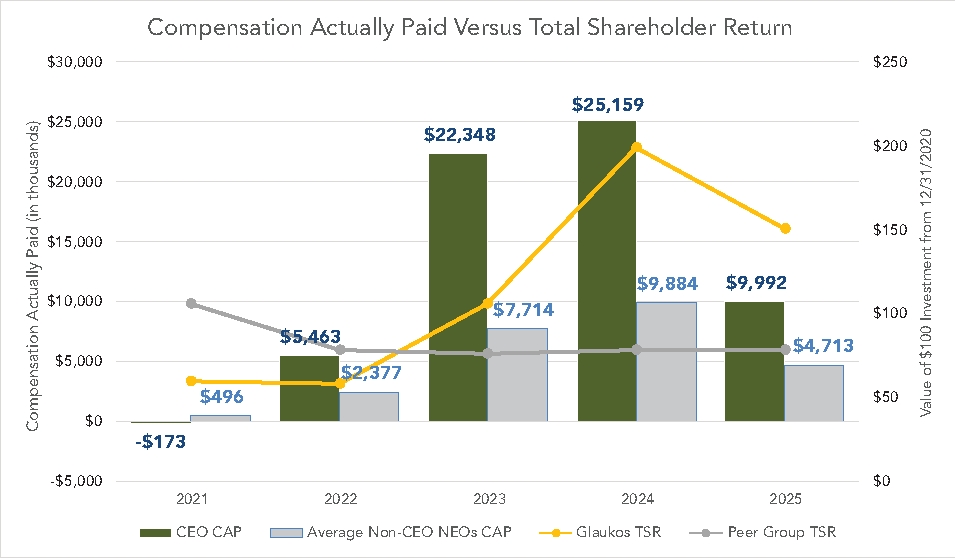
Column (f). For the relevant fiscal year, represents the cumulative total shareholder return (TSR) of Glaukos Corporation for the measurement periods ending on December 31 of each of 2025, 2024, 2023, 2022 and 2021, respectively.
Column (g): For the relevant fiscal year, represents the cumulative TSR of the S&P 600 Health Care Sector Index ("Peer Group TSR") for the measurement periods ending on December 31 of each of 2025, 2024, 2023, 2022 and 2021, respectively.
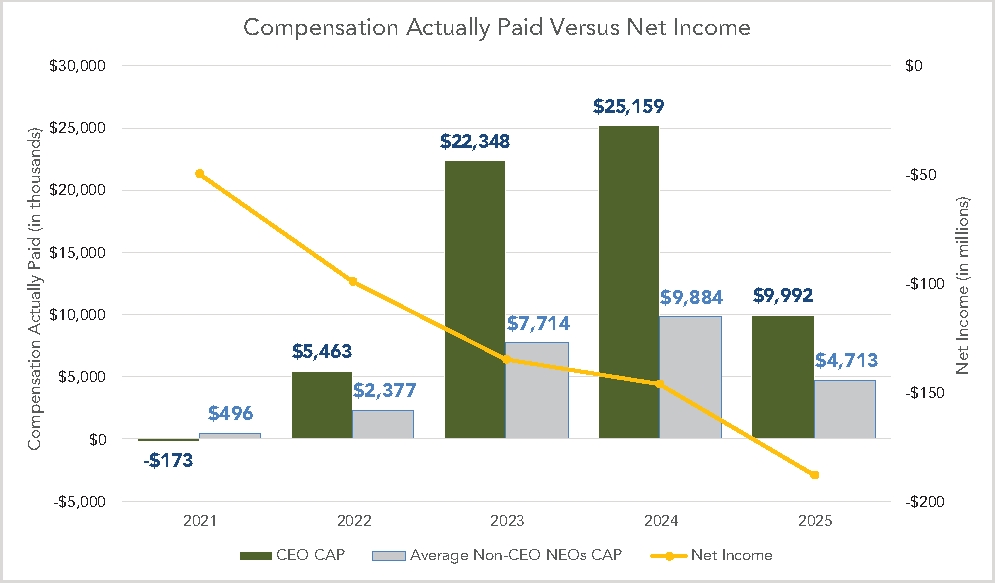
Column (h): Reflects “Net Income” in the Company’s Consolidated Income Statements included in the Company’s Annual Reports on Form 10-K for each of the years ended December 31, 2025, 2024, 2023, 2022 and 2021.
Column (i): Company-selected Measure is annual “Net Sales” in the Company’s Consolidated Income Statements included in the Company’s Annual Reports on Form 10-K for each of the years ended December 31, 2025, 2024, 2023, 2022 and 2021.
Column (b). Reflects compensation amounts reported in the “Summary Compensation Table” for our Chairman and CEO, Thomas W. Burns, for the respective years shown.
Column (d). The following non-CEO named executive officers are included in the average figures shown:
2021: Joseph E. Gilliam, Chris M. Calcaterra
2022: Joseph E. Gilliam, Alex R. Thurman, Tomas Navratil, Chris M. Calcaterra
2023: Joseph E. Gilliam, Alex R. Thurman, Tomas Navratil
2024: Joseph E. Gilliam, Alex R. Thurman, Tomas Navratil
2025: Joseph E. Gilliam, Alex R. Thurman, Tomas Navratil
Column (g): For the relevant fiscal year, represents the cumulative TSR of the S&P 600 Health Care Sector Index ("Peer Group TSR") for the measurement periods ending on December 31 of each of 2025, 2024, 2023, 2022 and 2021, respectively.
Column (c). “Compensation actually paid” to our CEO in each of 2025, 2024, 2023, 2022 and 2021 reflects the respective amounts set forth in column (b) of the table above, adjusted as set forth in the table below, as determined in accordance with SEC rules. The dollar amounts reflected in column (b) of the table above do not reflect the actual amount of compensation earned by or paid to our CEO during the applicable year. For information regarding the decisions made by our CNG Committee in regards to the CEO’s compensation for each fiscal year, please see the Compensation Discussion & Analysis sections of the proxy statements reporting pay for the fiscal years covered in the table above.
CEO – Thomas W. Burns – Equity Award Adjustment |
||||||||||||||||||||||||||
Year |
|
2025 |
|
|
2024 |
|
|
2023 |
|
|
2022 |
|
|
2021 |
|
|
||||||||||
Summary Compensation Table Total |
|
$ |
|
12,034,087 |
|
|
$ |
|
9,030,345 |
|
|
$ |
|
8,654,684 |
|
|
$ |
|
6,268,188 |
|
|
$ |
|
7,260,144 |
|
|
(Minus): Grant Date Fair Value of Equity Awards Granted in Fiscal Year |
|
$ |
|
(11,177,444 |
) |
|
$ |
|
(8,219,995 |
) |
|
$ |
|
(7,879,784 |
) |
|
$ |
|
(4,767,887 |
) |
|
$ |
|
(5,299,920 |
) |
|
(Minus): Change in Pension Value |
|
$ |
|
0 |
|
|
$ |
|
0 |
|
|
$ |
|
0 |
|
|
$ |
|
0 |
|
|
$ |
|
0 |
|
|
Plus: Pension Service Cost and Associated Prior Service Cost |
|
$ |
|
0 |
|
|
$ |
|
0 |
|
|
$ |
|
0 |
|
|
$ |
|
0 |
|
|
$ |
|
0 |
|
|
Plus: Fair Value at Fiscal Year End of Outstanding and Unvested Equity Awards Granted in the Fiscal Year |
|
$ |
|
7,496,078 |
|
|
$ |
|
10,658,482 |
|
|
$ |
|
13,186,556 |
|
|
$ |
|
2,282,800 |
|
|
$ |
|
2,055,461 |
|
|
Plus/(Minus): Change in Fair Value of Outstanding and Unvested Equity Awards Granted in Prior Fiscal Years |
|
$ |
|
4,020,444 |
|
|
$ |
|
11,370,354 |
|
|
$ |
|
7,429,276 |
|
|
$ |
|
329,529 |
|
|
$ |
|
(4,156,192 |
) |
|
Plus: Fair Value at Vesting of Equity Awards Granted and Vested in the Fiscal Year |
|
$ |
|
0 |
|
|
$ |
|
0 |
|
|
$ |
|
0 |
|
|
$ |
|
0 |
|
|
$ |
|
0 |
|
|
Plus/(Minus): Change in Fair Value as of the Vesting Date of Equity Awards Granted in Prior Fiscal Years that Vested in the Fiscal Year |
|
$ |
|
(2,380,921 |
) |
|
$ |
|
2,320,251 |
|
|
$ |
|
956,931 |
|
|
$ |
|
1,350,723 |
|
|
$ |
|
(31,998 |
) |
|
(Minus): Fair Value as of the Prior Fiscal Year End of Equity Awards Granted in Prior Fiscal Years that Failed to Meet Vesting Conditions in the Fiscal Year |
|
$ |
|
0 |
|
|
$ |
|
0 |
|
|
$ |
|
0 |
|
|
$ |
|
0 |
|
|
$ |
|
0 |
|
|
Plus: Value of Dividends or Other Earnings Paid on Equity Awards Not Otherwise Reflected in Total Compensation |
|
$ |
|
0 |
|
|
$ |
|
0 |
|
|
$ |
|
0 |
|
|
$ |
|
0 |
|
|
$ |
|
0 |
|
|
Compensation Actually Paid |
|
$ |
|
9,992,245 |
|
|
$ |
|
25,159,437 |
|
|
$ |
|
22,347,663 |
|
|
$ |
|
5,463,353 |
|
|
$ |
|
(172,505 |
) |
|
Equity Valuations: Stock option grant date fair values are calculated based on the Black-Scholes option pricing model as of date of grant. Adjustments have been made using stock option fair values as of each measurement date using the stock price as of the measurement date and updated assumptions (i.e., term, volatility, dividend yield, risk free rates) as of the measurement date. Performance-based restricted share unit grant date fair values are calculated using the stock price as of date of grant assuming target performance. Adjustments have been made using the stock price and performance accrual modifier as of year end and as of the date of vest. Time-vested restricted share unit grant date fair values are calculated using the stock price as of date of grant. Adjustments have been made using the stock price as of year end and as of each date of vest.
Column (e). Average “compensation actually paid” for our non-CEO Named Executive Officers in each of 2025, 2024, 2023, 2022 and 2021 reflects the respective amounts set forth in column (d) of the table above, adjusted as set forth in the table below, as determined in accordance with SEC rules. The dollar amounts reflected in column (d) of the table above do not reflect the actual amount of compensation earned by or paid to our non-CEO Named Executive Officers during the applicable year. For information regarding the decisions made by our CNG Committee in regards to the non-CEO Named Executive Officers’ compensation for each fiscal year, please the Compensation Discussion and Analysis sections of the proxy statements reporting pay for the fiscal years covered in the table above.
Non-CEO Equity Award Adjustment |
||||||||||||||||||||||||||
Year |
|
2025 |
|
|
2024 |
|
|
2023 |
|
|
2022 |
|
|
2021 |
|
|
||||||||||
Summary Compensation Table Total |
|
$ |
|
4,712,807 |
|
|
$ |
|
3,134,001 |
|
|
$ |
|
3,035,069 |
|
|
$ |
|
2,930,016 |
|
|
$ |
|
2,196,905 |
|
|
(Minus): Grant Date Fair Value of Equity Awards Granted in Fiscal Year |
|
$ |
|
(3,778,475 |
) |
|
$ |
|
(2,301,685 |
) |
|
$ |
|
(2,146,240 |
) |
|
$ |
|
(2,362,978 |
) |
|
$ |
|
(1,199,996 |
) |
|
(Minus): Change in Pension Value |
|
$ |
|
0 |
|
|
$ |
|
0 |
|
|
$ |
|
0 |
|
|
$ |
|
0 |
|
|
$ |
|
0 |
|
|
Plus: Pension Service Cost and Associated Prior Service Cost |
|
$ |
|
0 |
|
|
$ |
|
0 |
|
|
$ |
|
0 |
|
|
$ |
|
0 |
|
|
$ |
|
0 |
|
|
Plus: Fair Value at Fiscal Year End of Outstanding and Unvested Equity Awards Granted in the Fiscal Year |
|
$ |
|
1,711,790 |
|
|
$ |
|
2,789,624 |
|
|
$ |
|
3,565,429 |
|
|
$ |
|
1,477,439 |
|
|
$ |
|
861,492 |
|
|
Plus/(Minus): Change in Fair Value of Outstanding and Unvested Equity Awards Granted in Prior Fiscal Years |
|
$ |
|
112,303 |
|
|
$ |
|
5,851,958 |
|
|
$ |
|
3,013,218 |
|
|
$ |
|
61,800 |
|
|
$ |
|
(1,490,771 |
) |
|
Plus: Fair Value at Vesting of Equity Awards Granted and Vested in the Fiscal Year |
|
$ |
|
0 |
|
|
$ |
|
0 |
|
|
$ |
|
0 |
|
|
$ |
|
0 |
|
|
$ |
|
0 |
|
|
Plus/(Minus): Change in Fair Value as of the Vesting Date of Equity Awards Granted in Prior Fiscal Years that Vested in the Fiscal Year |
|
$ |
|
(1,386,545 |
) |
|
$ |
|
409,867 |
|
|
$ |
|
246,624 |
|
|
$ |
|
271,063 |
|
|
$ |
|
128,748 |
|
|
(Minus): Fair Value as of the Prior Fiscal Year End of Equity Awards Granted in Prior Fiscal Years that Failed to Meet Vesting Conditions in the Fiscal Year |
|
$ |
|
0 |
|
|
$ |
|
0 |
|
|
$ |
|
0 |
|
|
$ |
|
0 |
|
|
$ |
|
0 |
|
|
Plus: Value of Dividends or Other Earnings Paid on Equity Awards Not Otherwise Reflected in Total Compensation |
|
$ |
|
0 |
|
|
$ |
|
0 |
|
|
$ |
|
0 |
|
|
$ |
|
0 |
|
|
$ |
|
0 |
|
|
Compensation Actually Paid |
|
$ |
|
1,371,881 |
|
|
$ |
|
9,883,766 |
|
|
$ |
|
7,714,100 |
|
|
$ |
|
2,377,340 |
|
|
$ |
|
496,378 |
|
|
Equity Valuations: Stock option grant date fair values are calculated based on the Black-Scholes option pricing model as of date of grant. Adjustments have been made using stock option fair values as of each measurement date using the stock price as of the measurement date and updated assumptions (i.e., term, volatility, dividend yield, risk free rates) as of the measurement date. Performance-based restricted share unit grant date fair values are calculated using the stock price as of date of grant assuming target performance. Adjustments have been made using the stock price and performance accrual modifier as of year end and as of the date of vest. Time-based restricted share unit grant date fair values are calculated using the stock price as of date of grant. Adjustments have been made using the stock price as of year end and as of each date of vest. The aggregate change in actuarial present value of accumulated benefit under pension plans reflects the amount reported for the applicable year in the Summary Compensation Table.
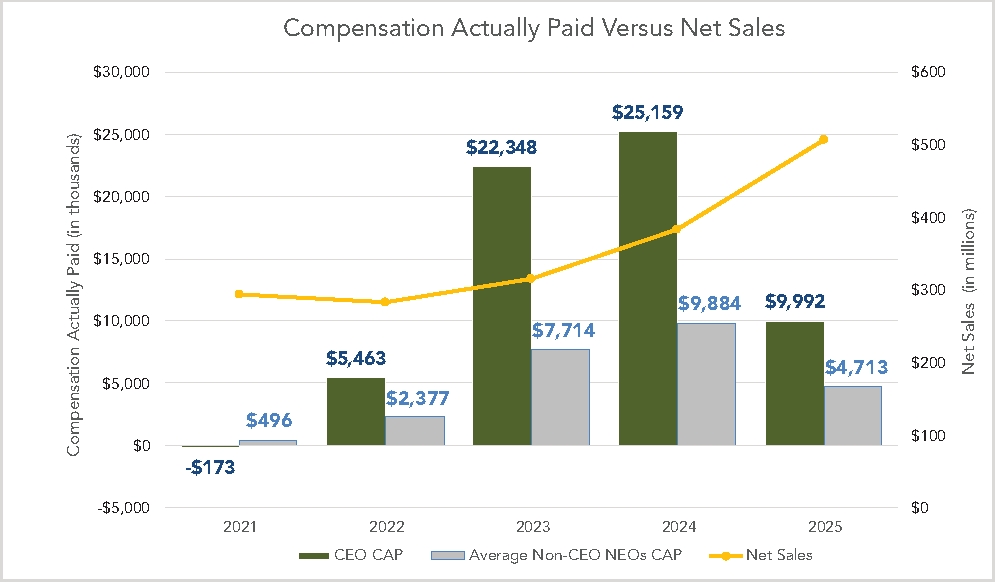
Financial Performance Measures. Listed below are the financial and non-financial performance measures which in our assessment represent the most important financial performance measures we use to link compensation actually paid to our Named Executive Officers, for 2025, to Company performance.
• Net Sales: |
Financial Measure |
• Operating Expenses: |
Financial Measure |
• Pipeline Product Development: |
Non-Financial Measure |
Column (i): Company-selected Measure is annual “Net Sales” in the Company’s Consolidated Income Statements included in the Company’s Annual Reports on Form 10-K for each of the years ended December 31, 2025, 2024, 2023, 2022 and 2021.