Pay vs Performance Disclosure - USD ($)
Dec. 31, 2025
Dec. 31, 2024
Dec. 31, 2023
Dec. 31, 2022
Dec. 31, 2021
Pay Versus Performance
As required by Section 953(a) of the Dodd-Frank Wall Street Reform and Consumer Protection Act, and Item 402(v) of Regulation philosophy and how the Company aligns executive compensation with corporate performance, please refer to the section of this proxy statement entitled “Compensation Discussion and Analysis” (“CD&A”).
S-K,
we are providing the following information about the relationship between executive compensation actually paid (“CAP”) and certain measures of the financial performance of the Company. For further information concerning the Company’s variable pay-for-performance
The following table reports the compensation of our Principal Executive Officer (“PEO”) and the average compensation of the other Named Executive Officers
(“non-PEO
NEOs”) as reported in the Summary Compensation Table for the past five fiscal years, as well as their “Compensation Actually Paid” as calculated pursuant to recently adopted SEC rules and certain performance measures required by the rules. | Value of Initial Fixed $100 Investment Based On: |
||||||||||||||||||||||||||||||||||||||||
Fiscal Year |
Summary Compensation Table Total PEO |
Compensation Actually Paid to PEO |
Average Summary Compensation Table Total for non-PEO NEOs |
Avg. Compensation Actually Paid to non-PEO NEOs |
Total Shareholder Return |
Peer Group Total Shareholder Return |
Net Income |
Revenue | ||||||||||||||||||||||||||||||||
(a) |
(b) | (c) | (d) | (e) | (f) | (g) | (h) | (i) | ||||||||||||||||||||||||||||||||
2025 |
$ |
2,872,145 |
$ |
26,188,077 |
$ |
17,105,036 |
$ |
25,236,315 |
$ |
721 |
$ |
163 |
$ |
3,511 |
$ |
9,006 |
||||||||||||||||||||||||
2024 |
$ |
8,949,403 |
$ |
62,201,559 |
$ |
10,891,249 |
$ |
27,045,747 |
$ |
608 |
$ |
141 |
$ |
2,852 |
$ |
7,003 |
||||||||||||||||||||||||
2023 |
$ |
15,561,987 |
$ |
63,914,394 |
$ |
4,918,724 |
$ |
20,487,088 |
$ |
324 |
$ |
124 |
$ |
2,087 |
$ |
5,860 |
||||||||||||||||||||||||
2022 |
$ |
10,735,887 |
$ |
3,171,085 |
$ |
3,285,597 |
($ |
785,576 |
) |
$ |
167 |
$ |
109 |
$ |
1,352 |
$ |
4,381 |
|||||||||||||||||||||||
2021 |
$ |
15,993,632 |
$ |
65,318,255 |
$ |
4,157,062 |
$ |
25,133,973 |
$ |
198 |
$ |
121 |
$ |
841 |
$ |
2,948 |
||||||||||||||||||||||||
Column (b)
Represents the total compensation reported for our CEO, Jayshree Ullal, in the Summary Compensation Table for each listed year. Ms. Ullal served as our CEO (PEO) for each year presented.
Column (c)
Represents the amount of CAP for a particular year, as computed in accordance with SEC rules. The dollar amounts do not reflect the actual amounts of compensation paid to our CEO during the applicable year.
To calculate CAP, the following amounts were deducted from and added to the “Total” compensation amount for the CEO reflected in each year’s Summary Compensation Table as follows:
| |
2025 | |||
Summary Compensation Table Total |
$ |
2,872,145 |
||
Subtract |
($ | 2,262,785 | ) | |
Add Year-End of Outstanding and Unvested Option Awards and Stock Awards Granted in Fiscal Year |
$ | 5,401,581 | ||
Add |
$ | 18,556,566 | ||
Add |
$ | — | ||
Add |
$ | 1,620,571 | ||
Subtract Year-End of Option Awards and Stock Awards Granted in Prior Fiscal Years That Failed to Meet Applicable Vesting Conditions During Fiscal Year |
$ | — | ||
Add |
$ | — | ||
Compensation Actually Paid |
$ |
26,188,077 |
||
Note that we have not reported any amounts in our Summary Compensation Table with respect to “Change in Pension and Nonqualified Deferred Compensation” and, accordingly, the adjustments with respect to such items prescribed by the
pay-versus-
performance rules are not relevant to our analysis and no adjustments have been made. For purposes of calculating CAP, the fair value of equity awards is calculated in accordance with Financial Accounting Standards Board Accounting Standards Codification Topic 718 (FASB ASC Topic 718) using consistent assumption methodologies used to calculate the grant date fair value of awards, and for awards subject to performance-based vesting conditions, based on the probable outcome of such performance-based vesting conditions as of the last day of the fiscal year.
Column (d)
Represents the average of the total compensation reported for our
non-PEO
NEOs in the Summary Compensation Table for each listed year. The non-PEO
NEOs in each year were as follows: 2025: Chantelle Breithaupt; Kenneth Duda; Todd Nightingale; Marc Taxay
2024: Chantelle Breithaupt; Ita Brennan; Kenneth Duda; John McCool; Anshul Sadana; Marc Taxay
2023: Ita Brennan; Kenneth Duda; Anshul Sadana; Marc Taxay
2022: Ita Brennan; Kenneth Duda; Anshul Sadana; Marc Taxay
2021: Ita Brennan; Kenneth Duda; Anshul Sadana; Marc Taxay
Column (e)
Represents the average amount of CAP for a particular Covered Year, as computed in accordance with SEC rules, to our
non-PEO
NEOs. The dollar amounts do not reflect the actual amounts of compensation paid to our non-PEO
NEOs during the applicable year. To calculate the average CAP payable to our
non-PEO
NEOs, the following amounts were deducted from and added to the “Total” compensation amount for such non-PEO
NEOs reflected in each year’s Summary Compensation Table as follows: | |
2025 | |||
Summary Compensation Table Total |
$ |
17,105,036 |
||
Subtract |
($ | 16,711,162 | ) | |
Add Year-End of Outstanding and Unvested Option Awards and Stock Awards Granted in Fiscal Year |
$ | 22,070,693 | ||
Add |
$ | 3,194,331 | ||
Add |
$ | — | ||
Add |
($ | 422,584 | ) | |
Subtract Year-End of Option Awards and Stock Awards Granted in Prior Fiscal Years That Failed to Meet Applicable Vesting Conditions During Fiscal Year |
$ | — | ||
Add |
$ | — | ||
Compensation Actually Paid |
$ |
25,236,315 |
||
The assumptions used for determining the fair values shown in this table are materially consistent with those described in the note regarding Column (c).
Column (f)
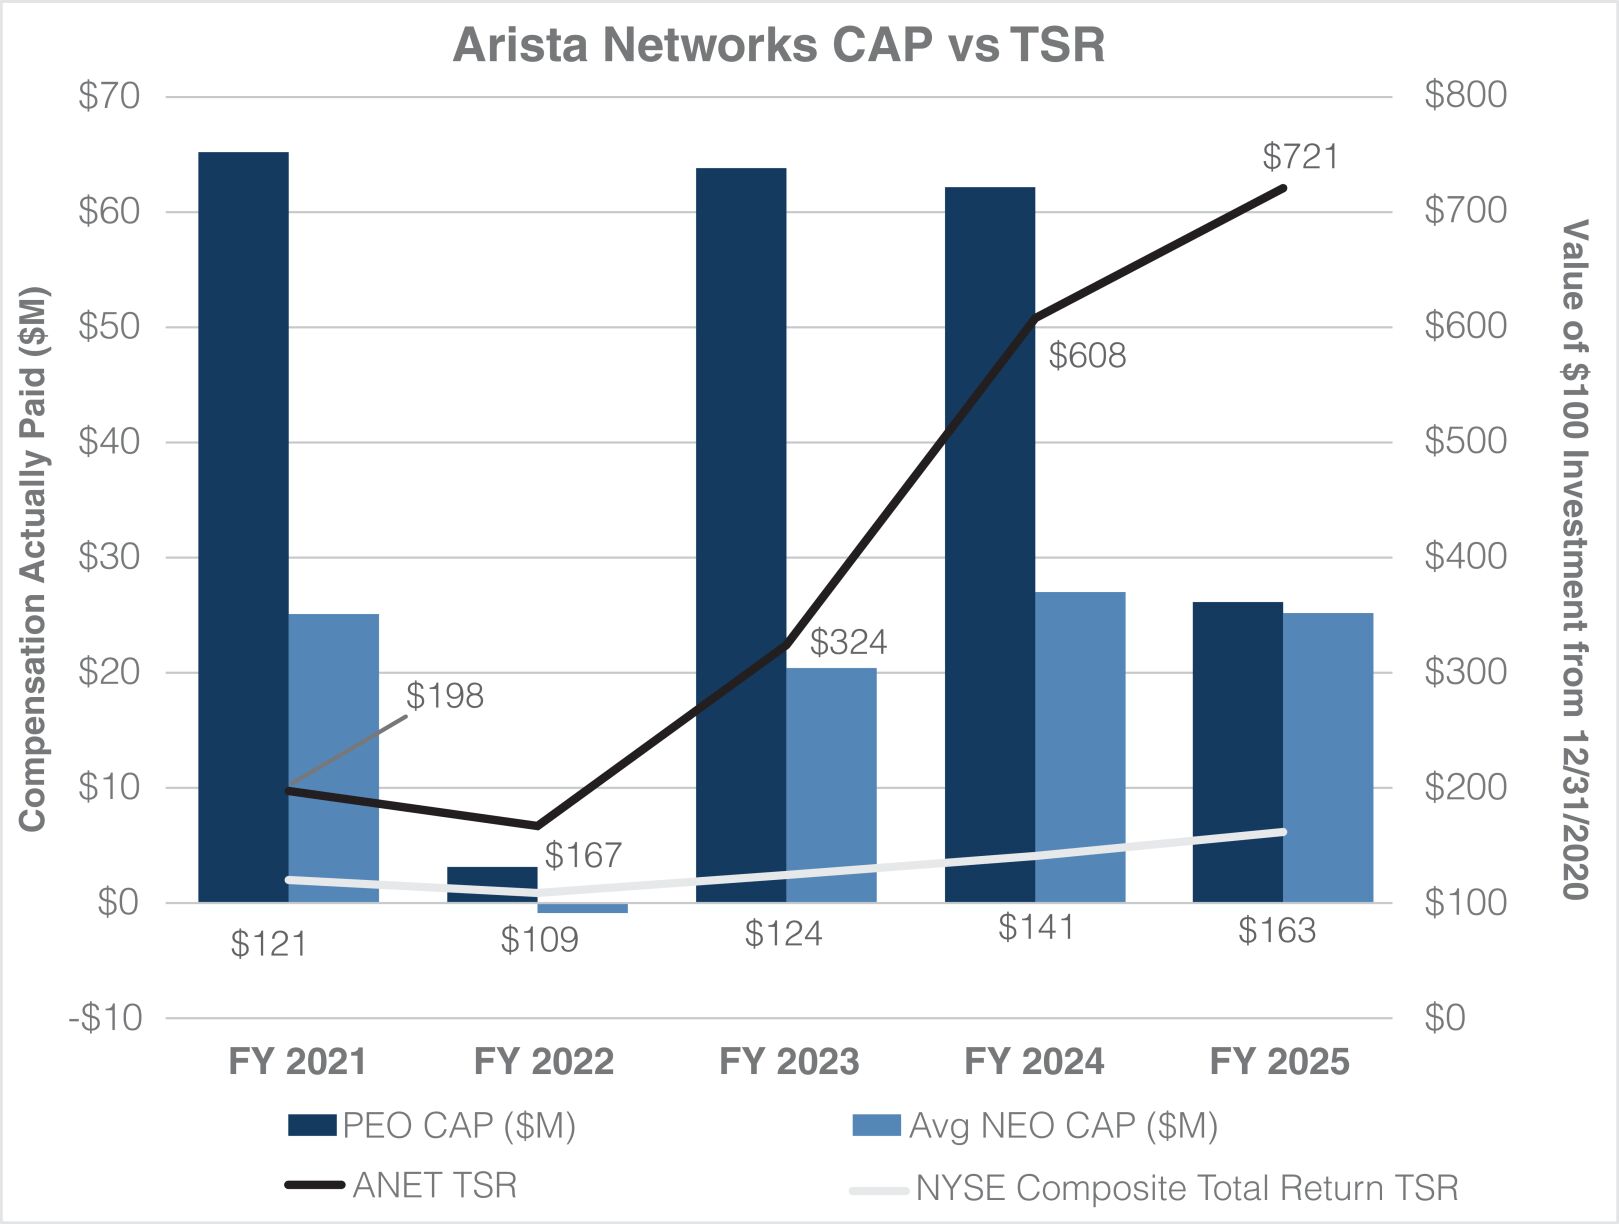
Total shareholder return (“TSR”) is calculated by assuming that a $100 investment was made on the day prior to the first fiscal year reported below and reinvesting all dividends until the last day of each reported fiscal year.
Because listed fiscal years are presented in the table in reverse chronological order (from top to bottom), the table should be read from bottom to top for purposes of understanding cumulative returns over time.
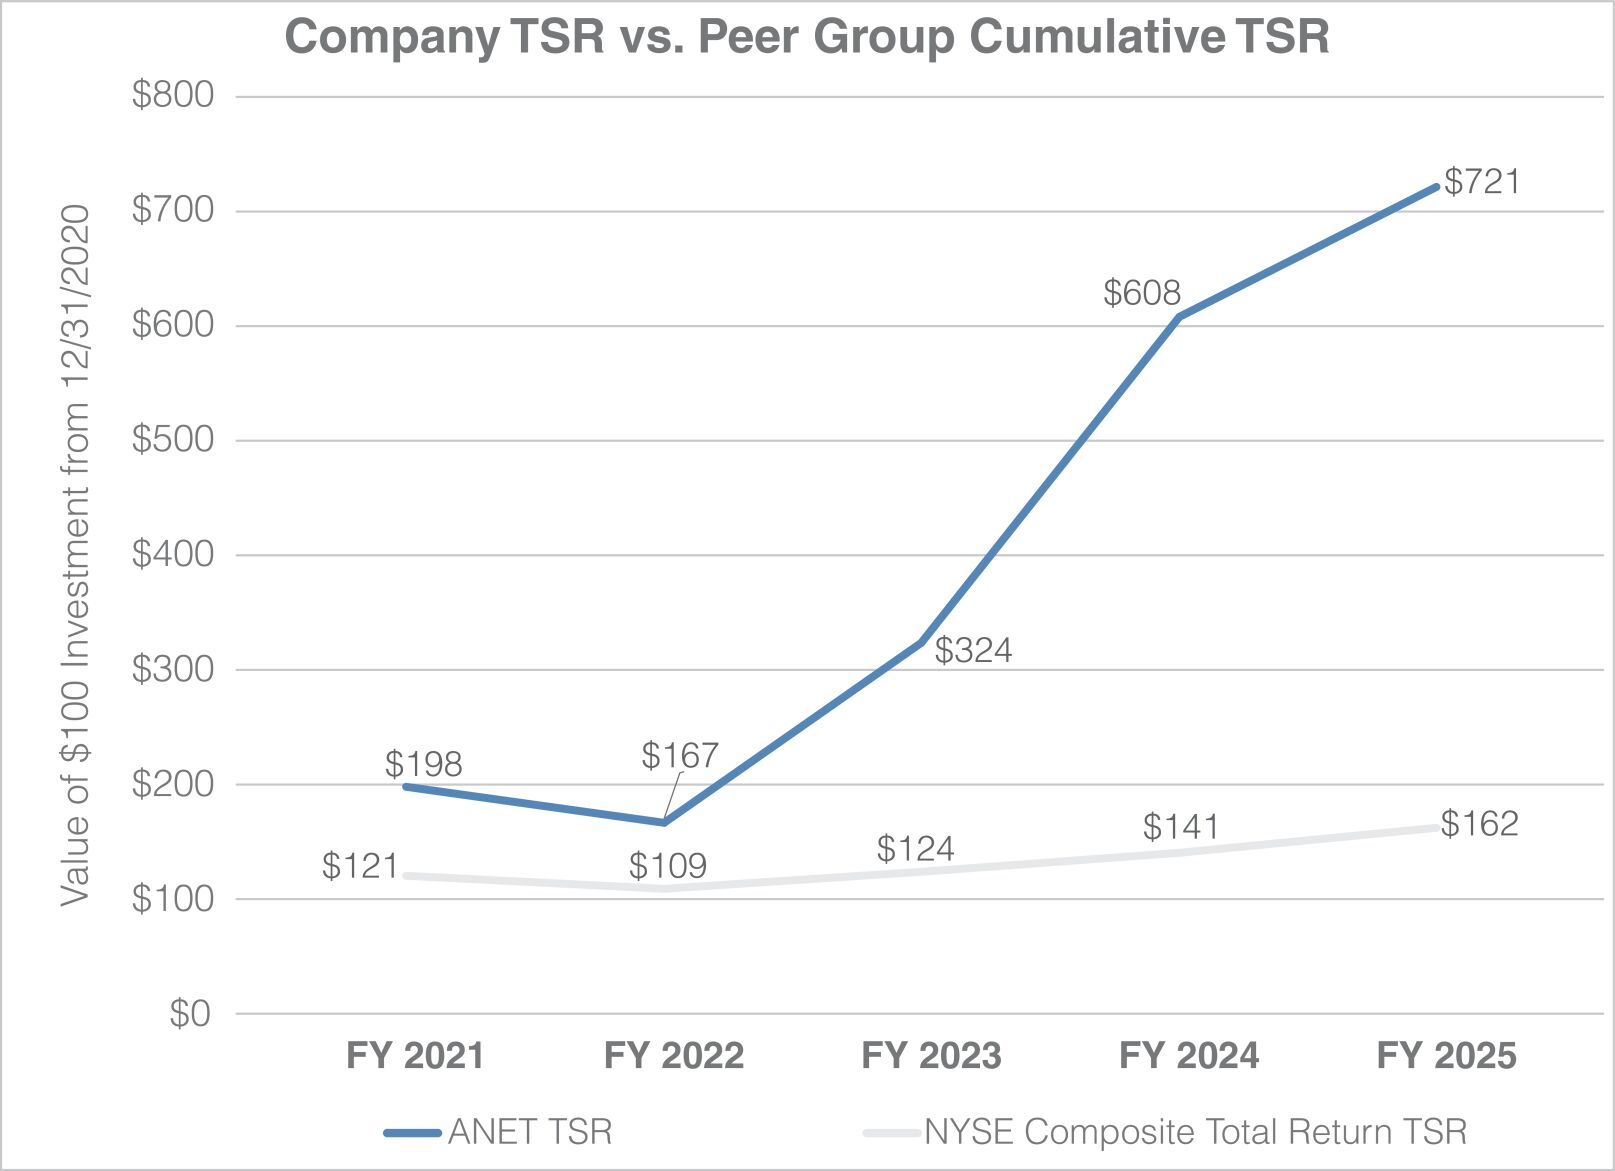
Column (g)
The peer group utilized in the table above is the NYSE Composite Index, as used in the company’s performance graph in our annual report. For each listed fiscal year, the peer group cumulative TSR was calculated based on a deemed fixed investment of $100 in the index made on the day prior to the first fiscal year reported below and reinvesting all dividends until the last day of each reported fiscal year.
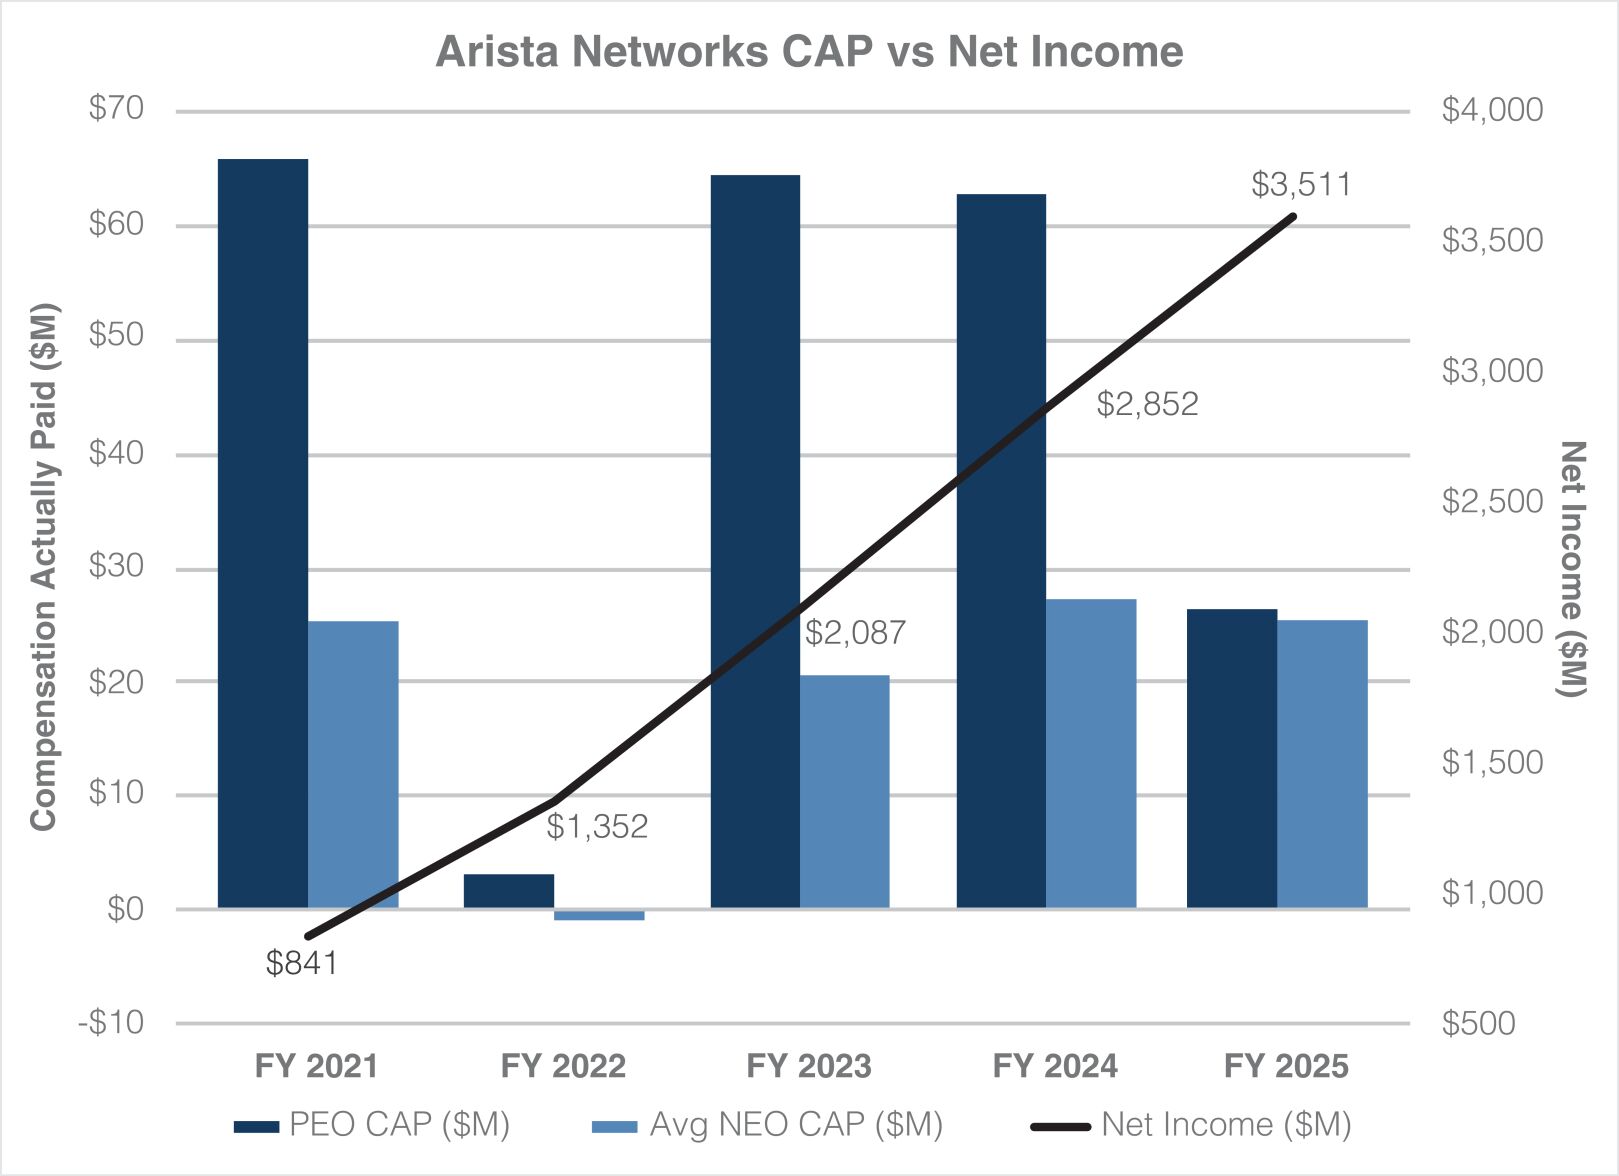
Column (h)
The dollar amounts reported are the Company’s net income reflected in the Company’s audited financial statements.
Column (i)
In the Company’s assessment, revenue is the financial performance measure that is the most important financial performance measure (other than total shareholder return and net income) used by the company in 2025 to link compensation actually paid to performance. The dollar amounts reported are the Company’s gross revenues (in millions) as reflected in the Company’s audited financial statements.
Represents the average of the total compensation reported for our
non-PEO
NEOs in the Summary Compensation Table for each listed year. The non-PEO
NEOs in each year were as follows: 2025: Chantelle Breithaupt; Kenneth Duda; Todd Nightingale; Marc Taxay
2024: Chantelle Breithaupt; Ita Brennan; Kenneth Duda; John McCool; Anshul Sadana; Marc Taxay
2023: Ita Brennan; Kenneth Duda; Anshul Sadana; Marc Taxay
2022: Ita Brennan; Kenneth Duda; Anshul Sadana; Marc Taxay
2021: Ita Brennan; Kenneth Duda; Anshul Sadana; Marc Taxay
To calculate CAP, the following amounts were deducted from and added to the “Total” compensation amount for the CEO reflected in each year’s Summary Compensation Table as follows:
| |
2025 | |||
Summary Compensation Table Total |
$ |
2,872,145 |
||
Subtract |
($ | 2,262,785 | ) | |
Add Year-End of Outstanding and Unvested Option Awards and Stock Awards Granted in Fiscal Year |
$ | 5,401,581 | ||
Add |
$ | 18,556,566 | ||
Add |
$ | — | ||
Add |
$ | 1,620,571 | ||
Subtract Year-End of Option Awards and Stock Awards Granted in Prior Fiscal Years That Failed to Meet Applicable Vesting Conditions During Fiscal Year |
$ | — | ||
Add |
$ | — | ||
Compensation Actually Paid |
$ |
26,188,077 |
||
Note that we have not reported any amounts in our Summary Compensation Table with respect to “Change in Pension and Nonqualified Deferred Compensation” and, accordingly, the adjustments with respect to such items prescribed by the
pay-versus-
performance rules are not relevant to our analysis and no adjustments have been made. For purposes of calculating CAP, the fair value of equity awards is calculated in accordance with Financial Accounting Standards Board Accounting Standards Codification Topic 718 (FASB ASC Topic 718) using consistent assumption methodologies used to calculate the grant date fair value of awards, and for awards subject to performance-based vesting conditions, based on the probable outcome of such performance-based vesting conditions as of the last day of the fiscal year.
To calculate the average CAP payable to our
non-PEO
NEOs, the following amounts were deducted from and added to the “Total” compensation amount for such non-PEO
NEOs reflected in each year’s Summary Compensation Table as follows: | |
2025 | |||
Summary Compensation Table Total |
$ |
17,105,036 |
||
Subtract |
($ | 16,711,162 | ) | |
Add Year-End of Outstanding and Unvested Option Awards and Stock Awards Granted in Fiscal Year |
$ | 22,070,693 | ||
Add |
$ | 3,194,331 | ||
Add |
$ | — | ||
Add |
($ | 422,584 | ) | |
Subtract Year-End of Option Awards and Stock Awards Granted in Prior Fiscal Years That Failed to Meet Applicable Vesting Conditions During Fiscal Year |
$ | — | ||
Add |
$ | — | ||
Compensation Actually Paid |
$ |
25,236,315 |
||
Compensation Actually Paid Versus Cumulative TSR
Compensation Actually Paid Versus Net Income
Compensation Actually Paid
Ver
sus Revenue 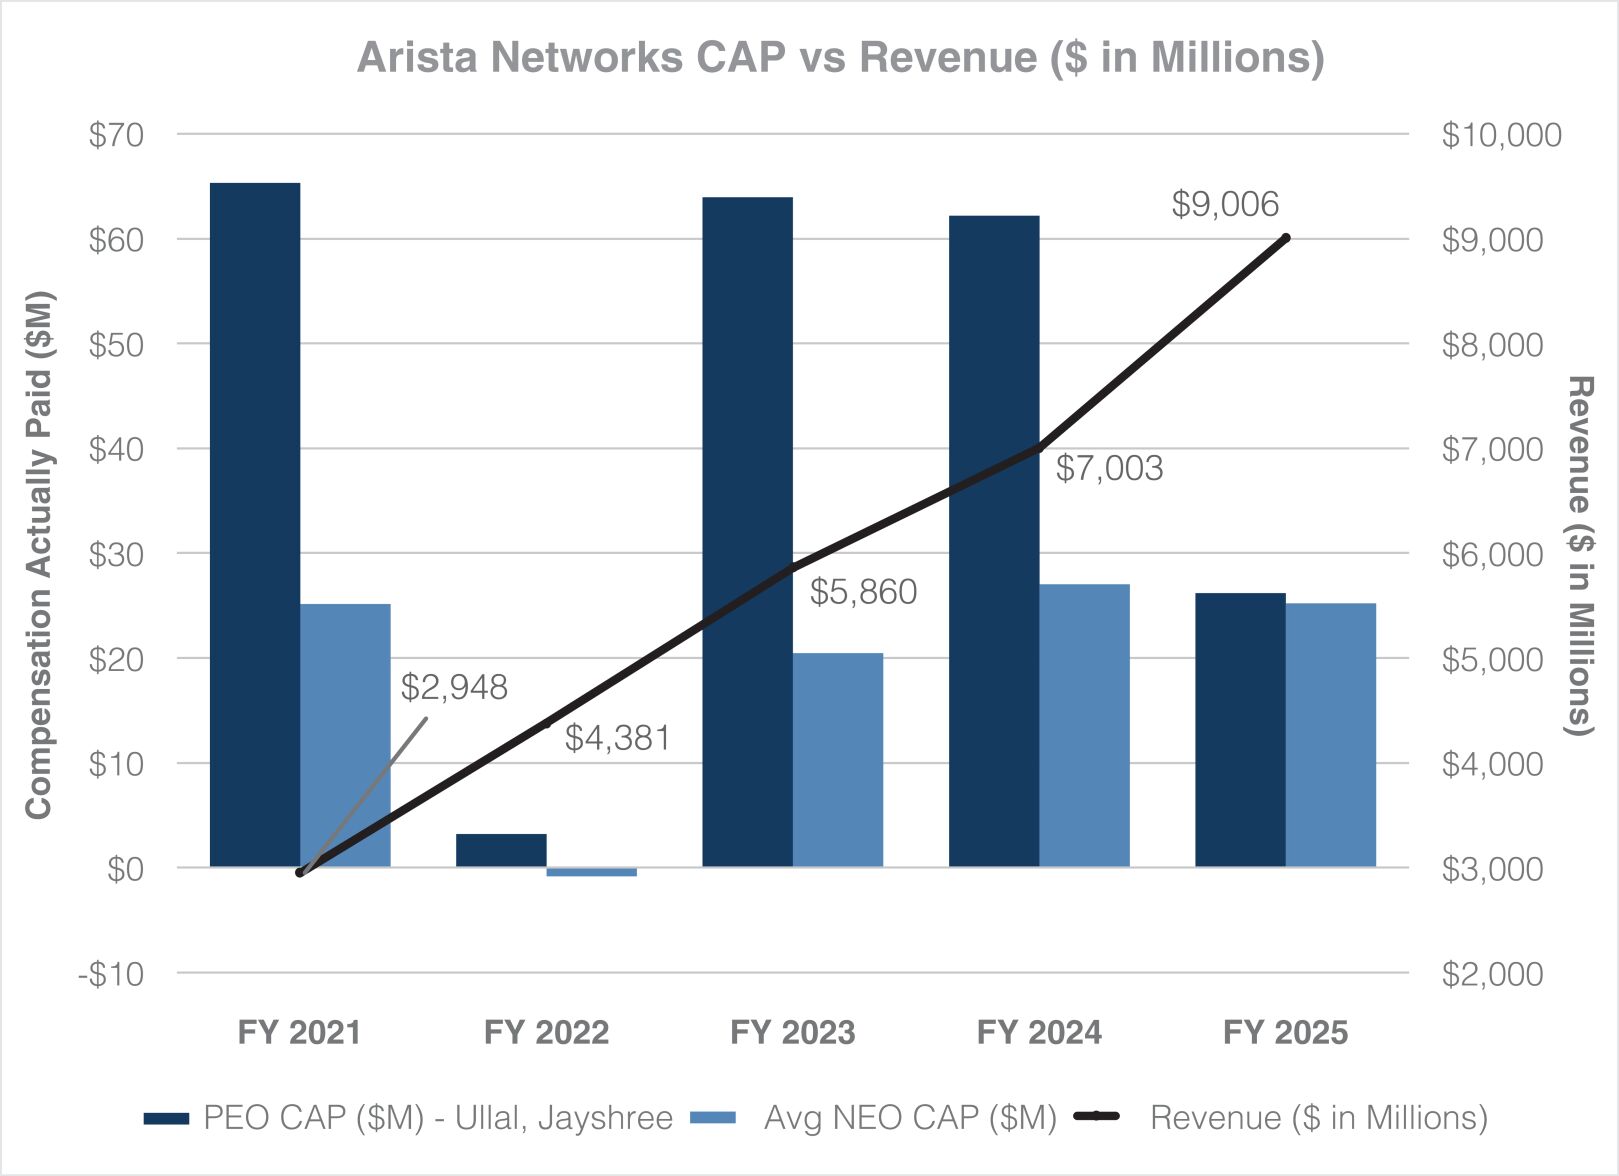
Company TSR vs. Peer Group Cumulative TSR
TABULAR LIST OF PERFORMANCE MEASURES
The following table identifies the most important financial performance measures used by our Compensation Committee to link the “compensation actually paid” to our CEO and other NEOs in 2025, calculated in accordance with SEC regulations, to company performance. The role of each of these performance measures on our NEOs’ compensation is discussed in the CD&A.
Most Important Performance Measures |
| Revenue |
Non-GAAP Operating Income |
Non-GAAP Gross Margin |
Compound Annual Growth Rate of Revenue |