Pay vs Performance Disclosure
Mar. 31, 2021
USD ($)
Dec. 31, 2021
USD ($)
Dec. 31, 2025
USD ($)
Dec. 31, 2024
USD ($)
Dec. 31, 2023
USD ($)
Dec. 31, 2022
USD ($)
Dec. 31, 2021
USD ($)
Pay Versus Performance
As required by Section 953(a) of the Dodd-Frank Wall Street Reform and Consumer Protection Act and Item 402(v) of Regulation S-K, we are providing the following information about the relationship between executive compensation actually paid (as defined by SEC rules) and certain financial performance measures of the Company. The Compensation Committee did not consider the pay versus performance disclosure when making its incentive compensation decisions. The following tables set forth information regarding compensation for our principal executive officers (PEOs) and average compensation related to our Non-PEO NEOs versus our Company performance for 2025, 2024, 2023, 2022, and 2021.
| Year | Douglas D. Dirks (PEO)(1) | Katherine H. Antonello (PEO)(1) | Non-PEO NEOs(2) | |||||||||||||||||
Summary Compensation Table Total for PEO ($)(1) | Compensation Actually Paid to PEO ($)(3) | Summary Compensation Table Total for PEO ($)(1) | Compensation Actually Paid to PEO ($)(3) | Average Summary Compensation Table Total for Non-PEO NEOs ($)(2,3) | Average Compensation Actually Paid to Non-PEO NEOs ($)(2,3) | |||||||||||||||
| 2025 | — | — | 3,261,998 | 2,331,512 | 1,157,093 | 728,409 | ||||||||||||||
| 2024 | — | — | 3,746,839 | 4,658,096 | 1,124,923 | 1,354,635 | ||||||||||||||
| 2023 | — | — | 3,727,106 | 3,498,957 | 1,290,919 | 1,012,519 | ||||||||||||||
| 2022 | — | — | 2,518,681 | 2,649,349 | 1,078,779 | 1,139,759 | ||||||||||||||
| 2021 | 2,315,871 | 2,373,415 | 2,570,729 | 2,971,888 | 1,183,048 | 1,402,493 | ||||||||||||||
| Value of Initial Fixed $100 Investment Based on: | Company Selected Measure(5) | |||||||||||||
| Year | Total Shareholder Return ($)(4) | Peer Group Total Shareholder Return ($)(4) | Net Income ($ in millions) | Adjusted GAAP Calendar Year Combined Ratio (%) | ||||||||||
| 2025 | 161.23 | 234.33 | 10.8 | 112.0 | ||||||||||
| 2024 | 186.00 | 212.86 | 118.6 | 98.0 | ||||||||||
| 2023 | 139.49 | 157.12 | 118.1 | 94.7 | ||||||||||
| 2022 | 148.53 | 141.79 | 48.4 | 97.0 | ||||||||||
| 2021 | 131.89 | 119.28 | 119.3 | 97.6 | ||||||||||
(1)The dollar amounts reported in this column reflect the total compensation presented in the Summary Compensation Table for each fiscal year shown. Douglas Dirks served as our President and CEO (PEO) in 2021 until he retired on April 1, 2021. Effective April 1, 2021, Ms. Antonello was promoted to President and CEO. She served as our PEO for the remainder of 2021 and throughout 2022, 2023, 2024, and 2025.
(2)The dollar amounts reported in this column reflect the average amounts of total compensation reported for our Non-PEO NEOs presented in the Summary Compensation Table for each fiscal year shown. During 2025, our Non-PEO NEOs consisted of Messrs. Pedraja, Mutschink, and Paquette, and Mses. Brown and Smith. During 2024, our Non-PEO NEOs consisted of Messrs. Paquette and Mutschink and Mses. Brown and Smith. During 2023, our Non-PEO NEOs consisted of Ms. Brown, Mr. Paquette, Mr. Mutschink, and Jeffrey Shaw. During 2022 and 2021, our Non-PEO NEOs consisted of Mr. Paquette, Christopher Laws, Jeffrey Shaw, and Ms. Brown.
(3)The amounts calculated in these columns are in accordance with Item 402(v) of Regulation S-K. See the table below for detail of amounts added to and deducted from the total compensation presented in the Summary Compensation Table for each applicable fiscal year to calculate compensation actually paid. Note that there were no stock awards granted in any fiscal year that vested within such fiscal year.
2025 | 2024 | 2023 | ||||||||||||||||||||||||
| PEO($) | Average of Non-PEO NEOs($) | PEO($) | Average of Non-PEO NEOs($) | PEO($) | Average of Non-PEO NEOs($) | |||||||||||||||||||||
| Total Compensation reported on Summary Compensation Table | 3,261,998 | 1,157,093 | 3,746,839 | 1,124,923 | 3,727,106 | 1,290,919 | ||||||||||||||||||||
| (Less) Fair Value of stock awards reported on Summary Compensation Table | (2,012,664) | (572,623) | (1,956,392) | (440,652) | (1,699,905) | (419,422) | ||||||||||||||||||||
Fair Value of stock awards granted in fiscal year shown, valued at year-end, that were outstanding and unvested at end of fiscal year shown | 1,761,336 | 501,117 | 2,161,906 | 486,941 | 1,628,008 | 316,941 | ||||||||||||||||||||
| Change in fair value from end of prior fiscal year to end of fiscal year shown for awards previously granted that were outstanding and unvested at end of fiscal year shown | (388,492) | (44,757) | 529,925 | 126,447 | (115,817) | (34,446) | ||||||||||||||||||||
| Change in fair value from end of prior fiscal year to vesting date for awards previously granted in prior fiscal years that vested during fiscal year shown | (290,666) | (51,456) | 175,818 | 56,976 | (40,435) | (6,659) | ||||||||||||||||||||
(Less) Fair Value as of prior fiscal year for any awards granted in any prior fiscal year that fail to meet applicable vesting conditions during the covered fiscal year | — | (260,965) | — | — | — | (134,814) | ||||||||||||||||||||
| Compensation Actually Paid | 2,331,512 | 728,409 | 4,658,096 | 1,354,635 | 3,498,957 | 1,012,519 | ||||||||||||||||||||
2022 | 2021 | |||||||||||||||||||
| PEO - Antonello($) | Average of Non-PEO NEOs($) | PEO - Dirks($) | PEO - Antonello($) | Average of Non-PEO NEOs($) | ||||||||||||||||
| Total Compensation reported on Summary Compensation Table | 2,518,681 | 1,078,779 | 2,315,871 | 2,570,729 | 1,183,048 | |||||||||||||||
| (Less) Fair Value of stock awards reported on Summary Compensation Table | (594,057) | (249,053) | (1,184,664) | (922,733) | (428,545) | |||||||||||||||
Fair Value of stock awards granted in fiscal year shown, valued at year-end, that were outstanding and unvested at end of fiscal year shown | 632,010 | 264,965 | — | 1,017,120 | 469,622 | |||||||||||||||
| Change in fair value from end of prior fiscal year to end of fiscal year shown for awards previously granted that were outstanding and unvested at end of fiscal year shown | 70,648 | 33,126 | — | 161,193 | 106,363 | |||||||||||||||
| Change in fair value from end of prior fiscal year to vesting date for awards previously granted in prior fiscal years that vested during fiscal year shown | 22,067 | 11,942 | 1,242,208 | 145,579 | 72,005 | |||||||||||||||
| Compensation Actually Paid | 2,649,349 | 1,139,759 | 2,373,415 | 2,971,888 | 1,402,493 | |||||||||||||||
(4)Total Shareholder Return assumes an initial fixed investment of $100 as of December 31, 2020, which was established by the market close on the last trading day prior to the beginning of the Company's fourth preceding fiscal year. Total shareholder return also includes reinvestment of all dividends. The Peer Group Total Shareholder Return is based on the Standard & Poor's 500 Property & Casualty Insurance Index as identified in the Stock Performance Graph included in our Annual Reports on Form 10-K for fiscal years 2025, 2024, 2023, 2022, and 2021.
(5)The Company has determined that the most important financial performance measure, or Company Selected Measure, the Company used to align pay and performance by linking compensation actually paid to our NEOs for fiscal year 2025 was the Adjusted GAAP Calendar Year Combined Ratio. Adjusted GAAP Calendar Year Combined Ratio = (Losses + loss adjustment expenses + commission expense - amortization of the deferred gain +/- impact of the LPT reserve adjustment +/- impact of the LPT contingent commission adjustment) / net premiums earned plus (underwriting expenses (including general and administrative expenses)) / net premiums written.
2025 | 2024 | 2023 | ||||||||||||||||||||||||
| PEO($) | Average of Non-PEO NEOs($) | PEO($) | Average of Non-PEO NEOs($) | PEO($) | Average of Non-PEO NEOs($) | |||||||||||||||||||||
| Total Compensation reported on Summary Compensation Table | 3,261,998 | 1,157,093 | 3,746,839 | 1,124,923 | 3,727,106 | 1,290,919 | ||||||||||||||||||||
| (Less) Fair Value of stock awards reported on Summary Compensation Table | (2,012,664) | (572,623) | (1,956,392) | (440,652) | (1,699,905) | (419,422) | ||||||||||||||||||||
Fair Value of stock awards granted in fiscal year shown, valued at year-end, that were outstanding and unvested at end of fiscal year shown | 1,761,336 | 501,117 | 2,161,906 | 486,941 | 1,628,008 | 316,941 | ||||||||||||||||||||
| Change in fair value from end of prior fiscal year to end of fiscal year shown for awards previously granted that were outstanding and unvested at end of fiscal year shown | (388,492) | (44,757) | 529,925 | 126,447 | (115,817) | (34,446) | ||||||||||||||||||||
| Change in fair value from end of prior fiscal year to vesting date for awards previously granted in prior fiscal years that vested during fiscal year shown | (290,666) | (51,456) | 175,818 | 56,976 | (40,435) | (6,659) | ||||||||||||||||||||
(Less) Fair Value as of prior fiscal year for any awards granted in any prior fiscal year that fail to meet applicable vesting conditions during the covered fiscal year | — | (260,965) | — | — | — | (134,814) | ||||||||||||||||||||
| Compensation Actually Paid | 2,331,512 | 728,409 | 4,658,096 | 1,354,635 | 3,498,957 | 1,012,519 | ||||||||||||||||||||
2022 | 2021 | |||||||||||||||||||
| PEO - Antonello($) | Average of Non-PEO NEOs($) | PEO - Dirks($) | PEO - Antonello($) | Average of Non-PEO NEOs($) | ||||||||||||||||
| Total Compensation reported on Summary Compensation Table | 2,518,681 | 1,078,779 | 2,315,871 | 2,570,729 | 1,183,048 | |||||||||||||||
| (Less) Fair Value of stock awards reported on Summary Compensation Table | (594,057) | (249,053) | (1,184,664) | (922,733) | (428,545) | |||||||||||||||
Fair Value of stock awards granted in fiscal year shown, valued at year-end, that were outstanding and unvested at end of fiscal year shown | 632,010 | 264,965 | — | 1,017,120 | 469,622 | |||||||||||||||
| Change in fair value from end of prior fiscal year to end of fiscal year shown for awards previously granted that were outstanding and unvested at end of fiscal year shown | 70,648 | 33,126 | — | 161,193 | 106,363 | |||||||||||||||
| Change in fair value from end of prior fiscal year to vesting date for awards previously granted in prior fiscal years that vested during fiscal year shown | 22,067 | 11,942 | 1,242,208 | 145,579 | 72,005 | |||||||||||||||
| Compensation Actually Paid | 2,649,349 | 1,139,759 | 2,373,415 | 2,971,888 | 1,402,493 | |||||||||||||||
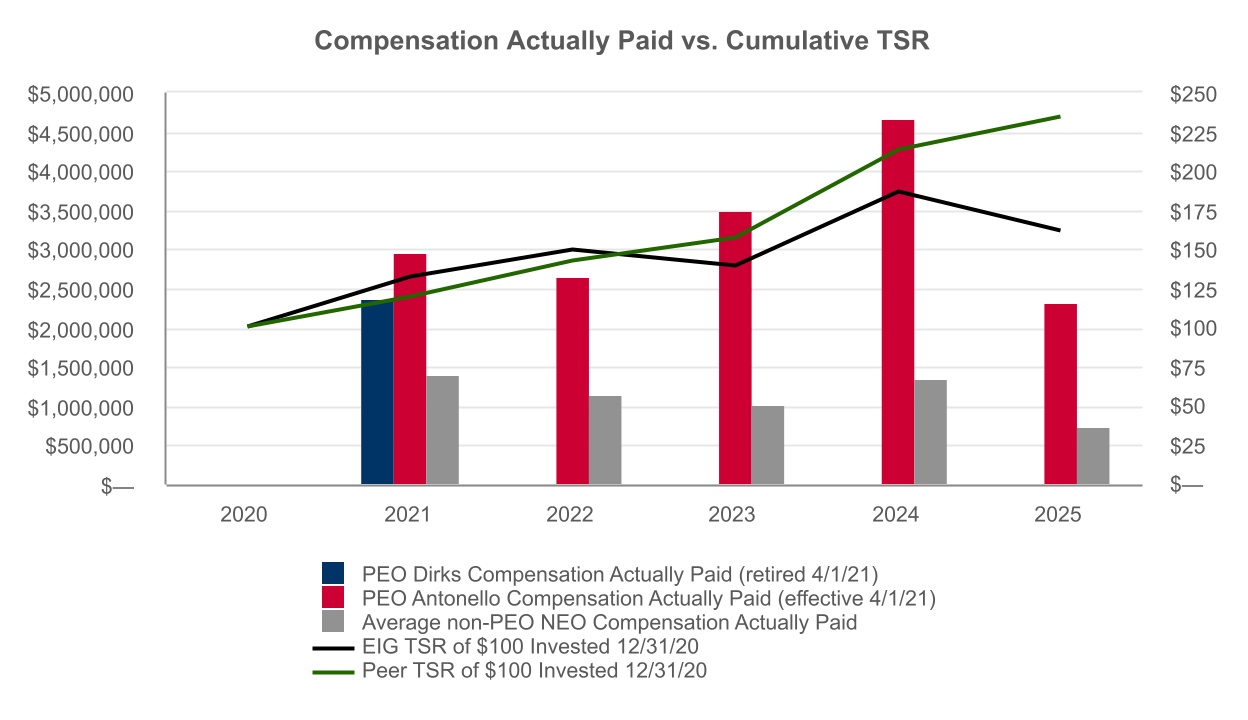
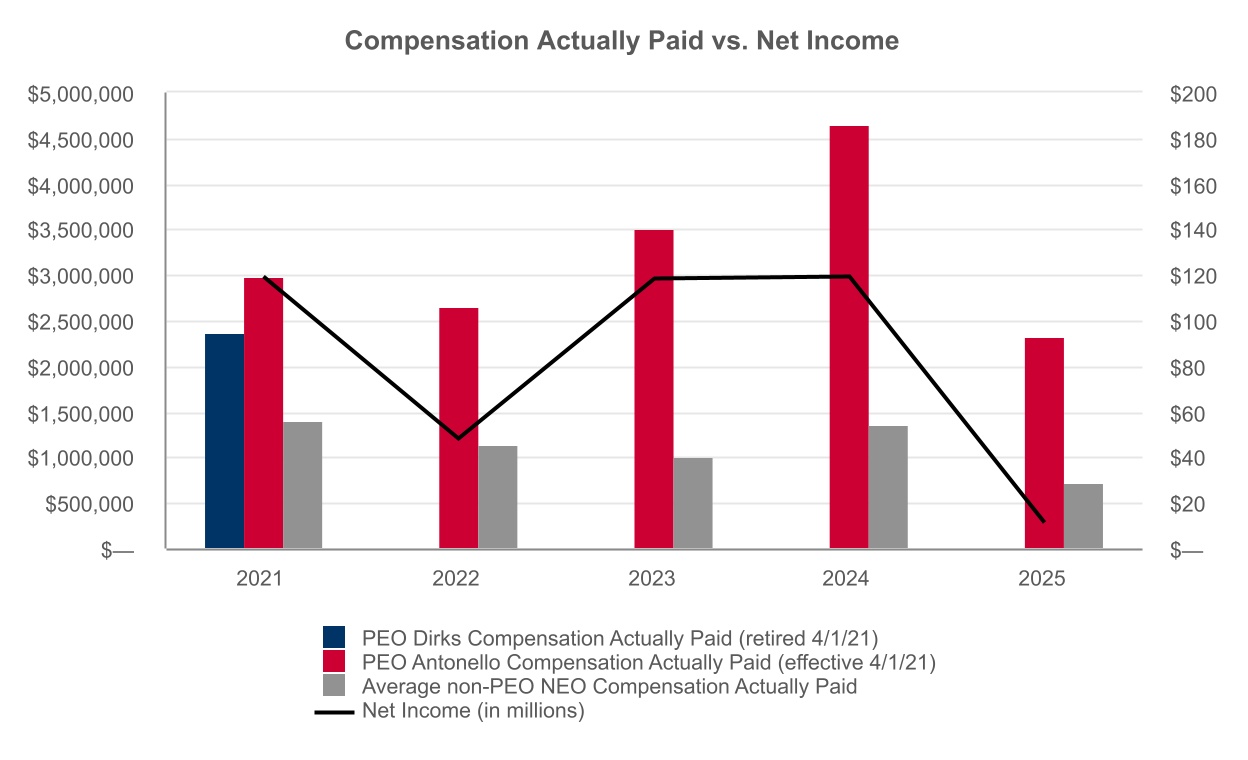
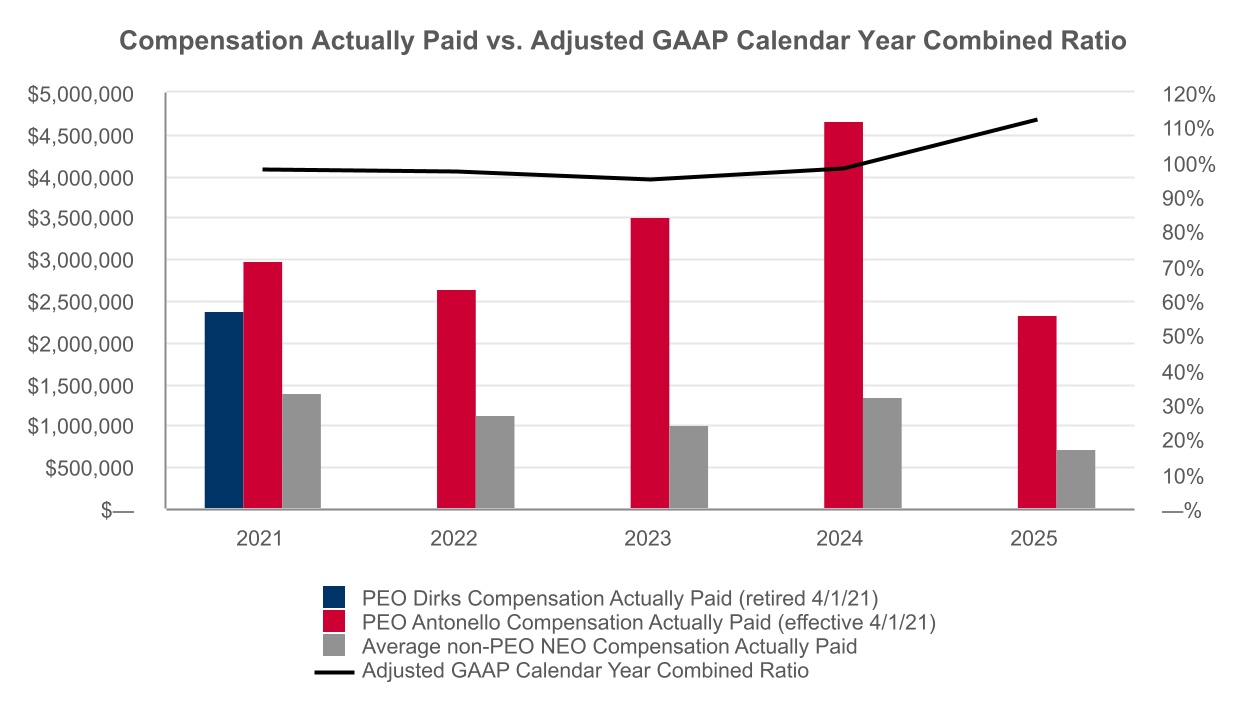
The following graphical comparisons illustrate the relationships between certain amounts included in the Pay Versus Performance table for fiscal years 2025, 2024, 2023, 2022, and 2021, including: (i) a comparison of Compensation Actually Paid Versus Cumulative Total Shareholder Return; (ii) a comparison of Compensation Actually Paid Versus Net Income; and (iii) a comparison of Compensation Actually Paid Versus Adjusted GAAP Calendar Year Combined Ratio.
As described in the above "Compensation Discussion and Analysis," the Company's executive compensation program uses financial performance measures used in our industry and measures that are viewed as key financial drivers of our stock price to align pay and performance. The most important financial performance measures used to link executive compensation actually paid with the Company's performance include the following:
Most Important Financial Performance Measures for Fiscal Year 2025 | ||
◦Adjusted GAAP Calendar Year Combined Ratio | ||
◦Change in Adjusted Book Value Per Share (ABVPS) | ||