v3.26.1
Pay vs Performance Disclosure - USD ($)
12 Months Ended
Dec. 31, 2025
Dec. 31, 2024
Dec. 31, 2023
Pay vs Performance Disclosure      
Pay vs Performance Disclosure, Table

Pay Versus Performance

As required by Section 953(a) of the Dodd-Frank Wall Street Reform and Consumer Protection Act and Item 402(v) of Regulation S-K, or the PVP Rules, we are providing information about the relationship between our company performance and executive compensation actually paid to our principal executive officer(s), or the PEO(s), and the other named executive officers, or the Non-PEO NEOs, as calculated in accordance with Item 402(v) of Regulation S-K.

In the below pay versus performance table, we provide information about compensation of our named executive officers for each of the last three fiscal years, or the Covered Years. Additionally, we provide information about the results for certain financial performance measures during the Covered Years. Although the PVP Rules require us to disclose “compensation actually paid,” these amounts do not necessarily reflect compensation that our named executive officers actually earned in the Covered Years. Instead, “compensation actually paid” reflects a calculation computed in accordance with the PVP Rules, including adjusted values to unvested and vested equity awards during the Covered Years based on either year-end or vesting date stock prices and various accounting valuation assumptions. “Compensation actually paid” generally fluctuates due to stock price performance.


Year


Summary
Compensation
Table Total for
PEO 1
(Aiyar)1, 2
($)


Summary
Compensation
Table Total for
PEO 2
(Lucchino)1, 2
($)


Compensation
Actually Paid
to PEO 1
(Aiyar)3
($)


Compensation
Actually Paid
to PEO 2
(Lucchino)3
($)


Average
Summary
Compensation
Table Total for
Non-PEO
NEOs 2, 4
($)


Average
Compensation
Actually Paid
to Non-PEO
NEOs 4, 5
($)


Value of Initial
Fixed $100
Investment
Based
on Total
Shareholder
Return 6
($)


Net Income 
(in thousands) 7
($)


2025


$

3,119,591


$


$

(717,811

)


$


$

1,803,080


$

384,425


$

4


$

(117,260

)


2024


$

939,075


$


$

(179,934

)


$


$

2,138,421


$

1,778,028


$

20


$

(83,581

)


2023


$

2,858,230


$

3,878,265


$

8,474,721


$

1,796,976


$

1,516,911


$

2,011,079


$

25


$

(81,172

)


1.
David L. Lucchino served as our PEO through the completion of the November 2023 merger. Following the merger, Dr. Aiyar became our PEO. Dr. Aiyar was the sole PEO for 2024 and 2025.
2.
Amounts reported in these columns represent (i) the “Total” compensation reported in the Summary Compensation Table, or SCT, for the indicated fiscal year in the case of our PEO(s) and (ii) the average of the “Total” compensation reported in the SCT for the Non-PEO NEOs in the indicated year.
3.
Compensation actually paid to our PEOs represents the “Total” compensation reported in the SCT for the PEOs for the applicable fiscal year, adjusted as follows:


Compensation
Actually Paid
to PEO 1
(Aiyar)


Compensation
Actually Paid
to PEO 2
(Lucchino)


2023


2024


2025


2023


2024


2025


Summary Compensation Table Total for PEO


$

2,858,230


$

939,075


$

3,119,591


$

3,878,265


$


$


Subtract Grant Date Fair Value of Option Awards and Stock Awards
   Granted in Fiscal Year(a)


$

(2,013,364

)


$


$

(2,266,935

)


$

(1,338,400

)


$


$


Add Fair Value at Fiscal Year-End of Outstanding and Unvested
   Option Awards and Stock Awards Granted in Fiscal Year(b)


$

6,355,830


$


$

378,767


$


$


$


Adjust for Change in Fair Value of Outstanding and Unvested Option
   Awards and Stock Awards Granted in Prior Fiscal Years(b)


$

1,065,352


$

(1,326,604

)


$

(1,703,679

)


$


$


$


Adjust for Fair Value at Vesting of Option Awards and Stock Awards
   Granted in Fiscal Year That Vested During Fiscal Year(b)


$

117,928


$


$

303,430


$


$


$


Adjust for Change in Fair Value as of Vesting Date of Option Awards
   and Stock Awards Granted in Prior Fiscal Years For Which
   Applicable Vesting Conditions Were Satisfied During Fiscal Year(b)


$

90,745


$

207,595


$

(548,985

)


$

(742,889

)


$


$


Subtract Fair Value as of Prior Fiscal Year-End of Option Awards
 and Stock Awards Granted in Prior Fiscal Years That Failed to Meet
   Applicable Vesting Conditions During Fiscal Year(b)


$


$


$


$


$


$


Add Value of Dividends or other Earnings Paid on Stock or Option
   Awards not Otherwise Reflected in Fair Value or Total
   Compensation


$


$


$


$


$


$


Compensation Actually Paid


$

8,474,721


$

(179,934

)


$

(717,811

)


$

1,796,976


$


$


(a)
The amounts reflect the aggregate grant-date fair value reported in the “Stock Awards” and “Option Awards” columns in the SCT for the applicable year.
(b)
In accordance with Item 402(v) requirements, the fair values of unvested and outstanding equity awards to our PEO(s) were remeasured as of the end of each fiscal year, and as of each vesting date, during the years displayed in the table above. We approached the determination of fair value in the same way as we historically have determined fair value and fair values as of each measurement date were determined using valuation assumptions and methodologies (including expected term, volatility, dividend yield, and risk-free interest rates) that are generally consistent with those used to estimate fair value at grant under U.S. GAAP.
4.
2025 Non-PEO NEOs include Dr. Vincent, Dr. Cerio, Dr. Olugemo, our former Chief Medical Officer, and Mr. Agarwal, our former Chief Financial Officer.

2024 Non-PEO NEOs include Dr. Cerio and Dr. Olugemo, our former Chief Medical Officer.

2023 Non-PEO NEOs include Mr. Agarwal, our former Chief Financial Officer, Dr. Colletti, our former Chief Scientific Officer, and Christopher Loose, Frequency's Chief Scientific Officer.


5.
Compensation actually paid to our Non-PEO NEOs represents the average “Total” compensation reported in the SCT for such Non-PEO NEOs for the applicable fiscal year, adjusted as follows:


2023


2024


2025


Summary Compensation Table Average Total for Non-PEO NEOs


$

1,516,911


$

2,138,421


$

1,803,080


Subtract Grant Date Fair Value of Option Awards and Stock Awards Granted in Fiscal Year(a)


$

(710,621

)


$

(1,725,255

)


$

(1,012,152

)

Add Fair Value at Fiscal Year-End of Outstanding and Unvested Option Awards and
   Stock Awards Granted in Fiscal Year(b)


$

1,513,455


$

1,364,862


$

258,288


Adjust for Change in Fair Value of Outstanding and Unvested Option Awards and Stock
   Awards Granted in Prior Fiscal Years(b)


$

131,134


$


$

(398,949

)

Adjust for Fair Value at Vesting of Option Awards and Stock Awards Granted in Fiscal Year
   That Vested During Fiscal Year(b)


$

30,797


$


$

71,662


Adjust for Change in Fair Value as of Vesting Date of Option Awards and Stock Awards
   Granted in Prior Fiscal Years For Which Applicable Vesting Conditions Were Satisfied
   During Fiscal Year(b)


$

(213,930

)


$


$

(175,037

)

Subtract Fair Value as of Prior Fiscal Year-End of Option Awards and Stock Awards Granted
   in Prior Fiscal Years That Failed to Meet Applicable Vesting Conditions During Fiscal
   Year(b)


$

(256,667

)


$


$

(162,467

)

Add Value of Dividends or other Earnings Paid on Stock or Option Awards not Otherwise
   Reflected in Fair Value or Total Compensation


$


$


$


Compensation Actually Paid


$

2,011,079


$

1,778,028


$

384,425


(a)
The amounts reflect the aggregate grant-date fair value reported in the “Stock Awards” and “Option Awards” columns in the SCT for the applicable year.
(b)
In accordance with Item 402(v) requirements, the fair values of unvested and outstanding equity awards to our non-PEO NEOs were remeasured as of the end of each fiscal year, and as of each vesting date, during the years displayed in the table above. We approached the determination of fair value in the same way as we historically have determined fair value and fair values as of each measurement date were determined using valuation assumptions and methodologies (including expected term, volatility, dividend yield, and risk-free interest rates) that are generally consistent with those used to estimate fair value at grant under U.S. GAAP.

6. The comparison assumes $100 was invested in Frequency’s common stock on December 31, 2022. As supplemental disclosure, if $100 was invested in our common stock on November 3, 2023, based on the closing price of our common stock on the day we began trading on the Nasdaq after closing of the merger, the amounts reported would be $320, $254, and $53 at the end of fiscal years 2023, 2024 and 2025, respectively. Historic stock price performance is not necessarily indicative of future stock price performance.

7.
Represents U.S. GAAP net income as reflected in our audited financial statements.
   
Company Selected Measure Name Net Income    
Named Executive Officers, Footnote
4.
2025 Non-PEO NEOs include Dr. Vincent, Dr. Cerio, Dr. Olugemo, our former Chief Medical Officer, and Mr. Agarwal, our former Chief Financial Officer.

2024 Non-PEO NEOs include Dr. Cerio and Dr. Olugemo, our former Chief Medical Officer.

2023 Non-PEO NEOs include Mr. Agarwal, our former Chief Financial Officer, Dr. Colletti, our former Chief Scientific Officer, and Christopher Loose, Frequency's Chief Scientific Officer
   
Adjustment To PEO Compensation, Footnote
3.
Compensation actually paid to our PEOs represents the “Total” compensation reported in the SCT for the PEOs for the applicable fiscal year, adjusted as follows:


Compensation
Actually Paid
to PEO 1
(Aiyar)


Compensation
Actually Paid
to PEO 2
(Lucchino)


2023


2024


2025


2023


2024


2025


Summary Compensation Table Total for PEO


$

2,858,230


$

939,075


$

3,119,591


$

3,878,265


$


$


Subtract Grant Date Fair Value of Option Awards and Stock Awards
   Granted in Fiscal Year(a)


$

(2,013,364

)


$


$

(2,266,935

)


$

(1,338,400

)


$


$


Add Fair Value at Fiscal Year-End of Outstanding and Unvested
   Option Awards and Stock Awards Granted in Fiscal Year(b)


$

6,355,830


$


$

378,767


$


$


$


Adjust for Change in Fair Value of Outstanding and Unvested Option
   Awards and Stock Awards Granted in Prior Fiscal Years(b)


$

1,065,352


$

(1,326,604

)


$

(1,703,679

)


$


$


$


Adjust for Fair Value at Vesting of Option Awards and Stock Awards
   Granted in Fiscal Year That Vested During Fiscal Year(b)


$

117,928


$


$

303,430


$


$


$


Adjust for Change in Fair Value as of Vesting Date of Option Awards
   and Stock Awards Granted in Prior Fiscal Years For Which
   Applicable Vesting Conditions Were Satisfied During Fiscal Year(b)


$

90,745


$

207,595


$

(548,985

)


$

(742,889

)


$


$


Subtract Fair Value as of Prior Fiscal Year-End of Option Awards
 and Stock Awards Granted in Prior Fiscal Years That Failed to Meet
   Applicable Vesting Conditions During Fiscal Year(b)


$


$


$


$


$


$


Add Value of Dividends or other Earnings Paid on Stock or Option
   Awards not Otherwise Reflected in Fair Value or Total
   Compensation


$


$


$


$


$


$


Compensation Actually Paid


$

8,474,721


$

(179,934

)


$

(717,811

)


$

1,796,976


$


$


Non-PEO NEO Average Total Compensation Amount $ 1,803,080 $ 2,138,421 $ 1,516,911
Non-PEO NEO Average Compensation Actually Paid Amount $ 384,425 1,778,028 2,011,079
Adjustment to Non-PEO NEO Compensation Footnote
5.
Compensation actually paid to our Non-PEO NEOs represents the average “Total” compensation reported in the SCT for such Non-PEO NEOs for the applicable fiscal year, adjusted as follows:


2023


2024


2025


Summary Compensation Table Average Total for Non-PEO NEOs


$

1,516,911


$

2,138,421


$

1,803,080


Subtract Grant Date Fair Value of Option Awards and Stock Awards Granted in Fiscal Year(a)


$

(710,621

)


$

(1,725,255

)


$

(1,012,152

)

Add Fair Value at Fiscal Year-End of Outstanding and Unvested Option Awards and
   Stock Awards Granted in Fiscal Year(b)


$

1,513,455


$

1,364,862


$

258,288


Adjust for Change in Fair Value of Outstanding and Unvested Option Awards and Stock
   Awards Granted in Prior Fiscal Years(b)


$

131,134


$


$

(398,949

)

Adjust for Fair Value at Vesting of Option Awards and Stock Awards Granted in Fiscal Year
   That Vested During Fiscal Year(b)


$

30,797


$


$

71,662


Adjust for Change in Fair Value as of Vesting Date of Option Awards and Stock Awards
   Granted in Prior Fiscal Years For Which Applicable Vesting Conditions Were Satisfied
   During Fiscal Year(b)


$

(213,930

)


$


$

(175,037

)

Subtract Fair Value as of Prior Fiscal Year-End of Option Awards and Stock Awards Granted
   in Prior Fiscal Years That Failed to Meet Applicable Vesting Conditions During Fiscal
   Year(b)


$

(256,667

)


$


$

(162,467

)

Add Value of Dividends or other Earnings Paid on Stock or Option Awards not Otherwise
   Reflected in Fair Value or Total Compensation


$


$


$


Compensation Actually Paid


$

2,011,079


$

1,778,028


$

384,425


Compensation Actually Paid vs. Total Shareholder Return

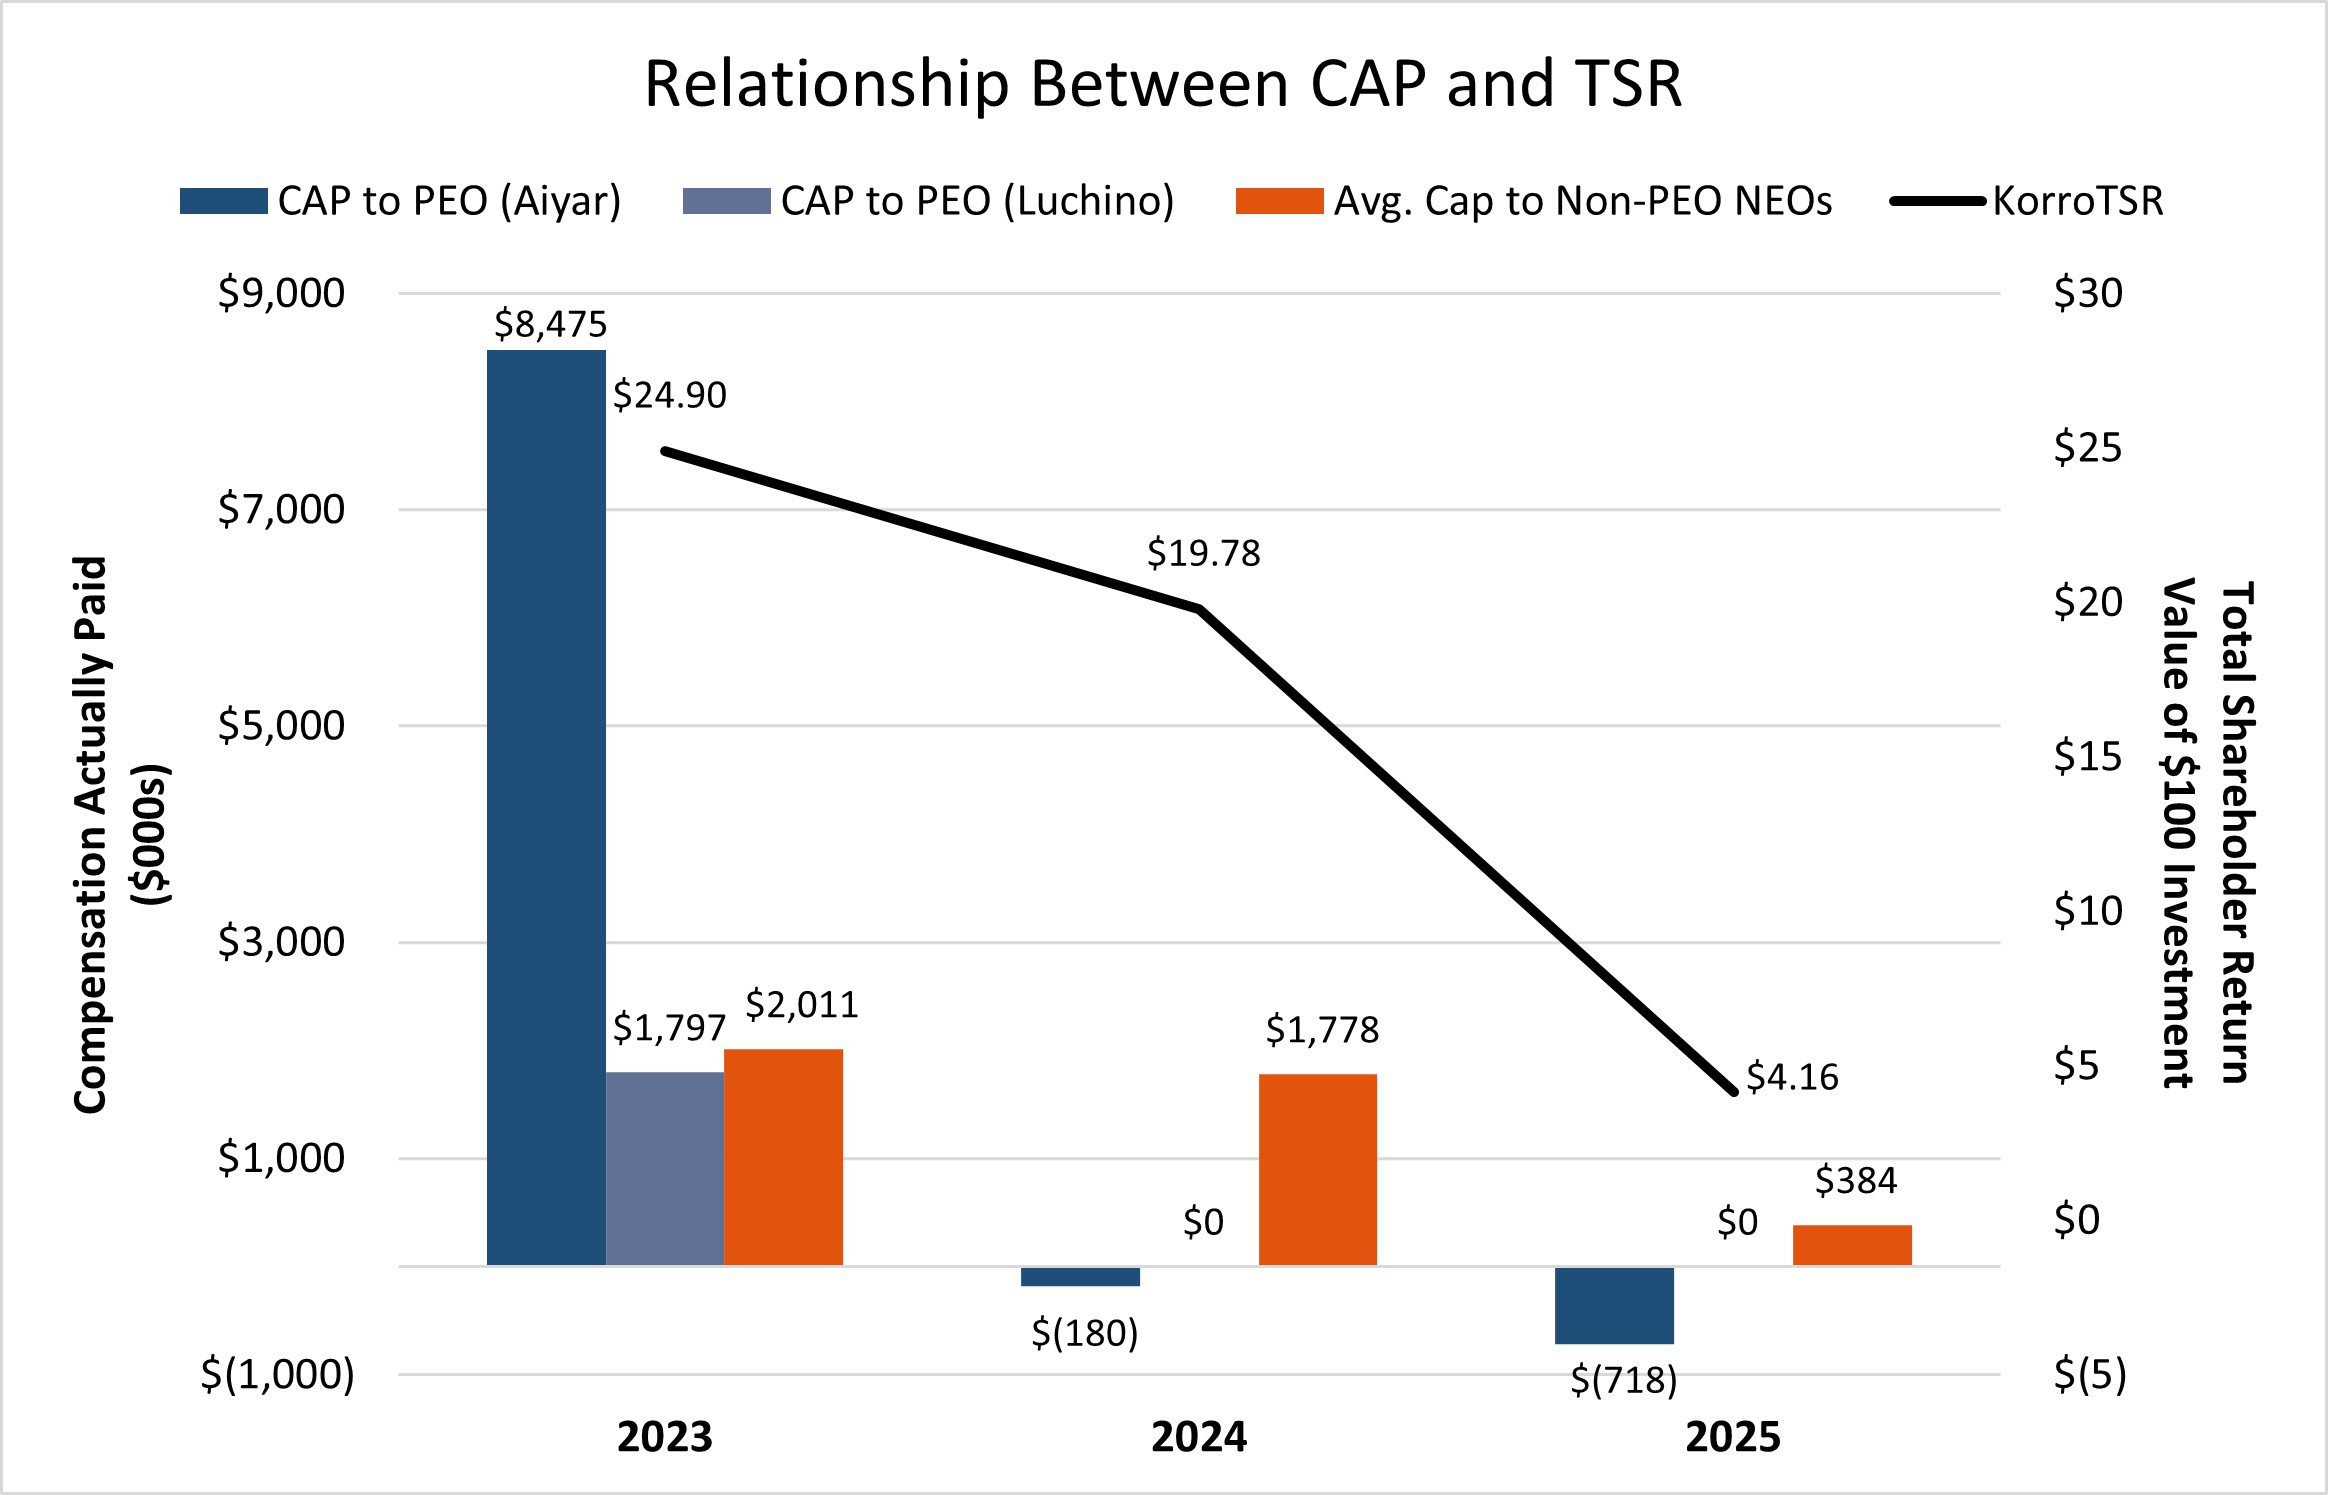
The graphs below illustrate the relationship between compensation actually paid, or CAP, to our PEOs and the average of the compensation actually paid to our Non-PEO NEOs, with (i) our cumulative total shareholder return, or TSR, and (ii) our net income, in each case, for the fiscal years ended December 31, 2025, 2024 and 2023.


CAP and TSR


img30609766_2.jpg

   
Compensation Actually Paid vs. Net Income

CAP and Net Income (Loss)


img30609766_3.gif

   
Total Shareholder Return Amount $ 4 20 25
Net Income (Loss) $ (117,260,000) $ (83,581,000) $ (81,172,000)
PEO Name Dr. Aiyar Dr. Aiyar David L. Lucchino
David L. Lucchino [Member]      
Pay vs Performance Disclosure      
PEO Total Compensation Amount $ 0 $ 0 $ 3,878,265
PEO Actually Paid Compensation Amount 0 0 1,796,976
Dr. Aiyar [Member]      
Pay vs Performance Disclosure      
PEO Total Compensation Amount 3,119,591 939,075 2,858,230
PEO Actually Paid Compensation Amount (717,811) (179,934) 8,474,721
PEO | David L. Lucchino [Member] | Aggregate Grant Date Fair Value of Equity Award Amounts Reported in Summary Compensation Table      
Pay vs Performance Disclosure      
Adjustment to Compensation, Amount 0 0 (1,338,400)
PEO | David L. Lucchino [Member] | Year-end Fair Value of Equity Awards Granted in Covered Year that are Outstanding and Unvested      
Pay vs Performance Disclosure      
Adjustment to Compensation, Amount 0 0 0
PEO | David L. Lucchino [Member] | Year-over-Year Change in Fair Value of Equity Awards Granted in Prior Years That are Outstanding and Unvested      
Pay vs Performance Disclosure      
Adjustment to Compensation, Amount 0 0 0
PEO | David L. Lucchino [Member] | Vesting Date Fair Value of Equity Awards Granted and Vested in Covered Year      
Pay vs Performance Disclosure      
Adjustment to Compensation, Amount 0 0 0
PEO | David L. Lucchino [Member] | Change in Fair Value as of Vesting Date of Prior Year Equity Awards Vested in Covered Year      
Pay vs Performance Disclosure      
Adjustment to Compensation, Amount 0 0 (742,889)
PEO | David L. Lucchino [Member] | Prior Year End Fair Value of Equity Awards Granted in Any Prior Year that Fail to Meet Applicable Vesting Conditions During Covered Year      
Pay vs Performance Disclosure      
Adjustment to Compensation, Amount 0 0 0
PEO | David L. Lucchino [Member] | Dividends or Other Earnings Paid on Equity Awards not Otherwise Reflected in Total Compensation for Covered Year      
Pay vs Performance Disclosure      
Adjustment to Compensation, Amount 0 0 0
PEO | Dr. Aiyar [Member] | Aggregate Grant Date Fair Value of Equity Award Amounts Reported in Summary Compensation Table      
Pay vs Performance Disclosure      
Adjustment to Compensation, Amount (2,266,935) 0 (2,013,364)
PEO | Dr. Aiyar [Member] | Year-end Fair Value of Equity Awards Granted in Covered Year that are Outstanding and Unvested      
Pay vs Performance Disclosure      
Adjustment to Compensation, Amount 378,767 0 6,355,830
PEO | Dr. Aiyar [Member] | Year-over-Year Change in Fair Value of Equity Awards Granted in Prior Years That are Outstanding and Unvested      
Pay vs Performance Disclosure      
Adjustment to Compensation, Amount (1,703,679) (1,326,604) 1,065,352
PEO | Dr. Aiyar [Member] | Vesting Date Fair Value of Equity Awards Granted and Vested in Covered Year      
Pay vs Performance Disclosure      
Adjustment to Compensation, Amount 303,430 0 117,928
PEO | Dr. Aiyar [Member] | Change in Fair Value as of Vesting Date of Prior Year Equity Awards Vested in Covered Year      
Pay vs Performance Disclosure      
Adjustment to Compensation, Amount (548,985) 207,595 90,745
PEO | Dr. Aiyar [Member] | Prior Year End Fair Value of Equity Awards Granted in Any Prior Year that Fail to Meet Applicable Vesting Conditions During Covered Year      
Pay vs Performance Disclosure      
Adjustment to Compensation, Amount 0 0 0
PEO | Dr. Aiyar [Member] | Dividends or Other Earnings Paid on Equity Awards not Otherwise Reflected in Total Compensation for Covered Year      
Pay vs Performance Disclosure      
Adjustment to Compensation, Amount 0 0 0
Non-PEO NEO | Aggregate Grant Date Fair Value of Equity Award Amounts Reported in Summary Compensation Table      
Pay vs Performance Disclosure      
Adjustment to Compensation, Amount (1,012,152) (1,725,255) (710,621)
Non-PEO NEO | Year-end Fair Value of Equity Awards Granted in Covered Year that are Outstanding and Unvested      
Pay vs Performance Disclosure      
Adjustment to Compensation, Amount 258,288 1,364,862 1,513,455
Non-PEO NEO | Year-over-Year Change in Fair Value of Equity Awards Granted in Prior Years That are Outstanding and Unvested      
Pay vs Performance Disclosure      
Adjustment to Compensation, Amount (398,949) 0 131,134
Non-PEO NEO | Vesting Date Fair Value of Equity Awards Granted and Vested in Covered Year      
Pay vs Performance Disclosure      
Adjustment to Compensation, Amount 71,662 0 30,797
Non-PEO NEO | Change in Fair Value as of Vesting Date of Prior Year Equity Awards Vested in Covered Year      
Pay vs Performance Disclosure      
Adjustment to Compensation, Amount (175,037) 0 (213,930)
Non-PEO NEO | Prior Year End Fair Value of Equity Awards Granted in Any Prior Year that Fail to Meet Applicable Vesting Conditions During Covered Year      
Pay vs Performance Disclosure      
Adjustment to Compensation, Amount (162,467) 0 (256,667)
Non-PEO NEO | Dividends or Other Earnings Paid on Equity Awards not Otherwise Reflected in Total Compensation for Covered Year      
Pay vs Performance Disclosure      
Adjustment to Compensation, Amount $ 0 $ 0 $ 0