Pay Versus Performance Table
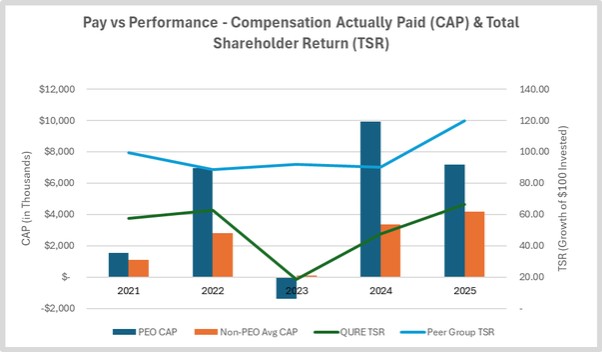
The following table sets contains information about the relationship between CAP, as computed in accordance with SEC rules, to our principal executive officers (“PEO”) and non-PEO NEOs as a group, and our financial performance for the five years 2021 – 2025. The cumulative Total Stockholder Return depicts a hypothetical $100 investment in our common stock on December 31, 2020, and shows the value of that investment over time for each calendar year. A hypothetical $100 investment in the Nasdaq Biotechnology Index (“NBI”) using the same methodology is shown for comparison. In addition, the average non-PEO NEO incumbents differ year to year and may comprise different roles with different individual and market-based considerations impacting compensation decisions. Comparing the summary compensation table total average and CAP average for the non-PEO NEOs year over year does not accurately depict changes in these values for the same individuals.
| | | Average | | | Value of Initial Fixed $100 | | |||||||
Summary | Average | Investment Based On: | ||||||||||||
Summary | Compensation | Compensation | Peer Group | |||||||||||
Compensation | Compensation | Table Total | Actually Paid | Total | Total | Net (Loss) / | ||||||||
Table Total | Actually Paid | for Non- | to Non-PEO | Shareholder | Shareholder | Income | ||||||||
Year | | for PEO (1) | | to PEO (1) (2) (3) | | PEO NEOs (4) | | NEOs (3) (4) (5) | | Return (6) | | Return (7) | | ($ in millions) (8) |
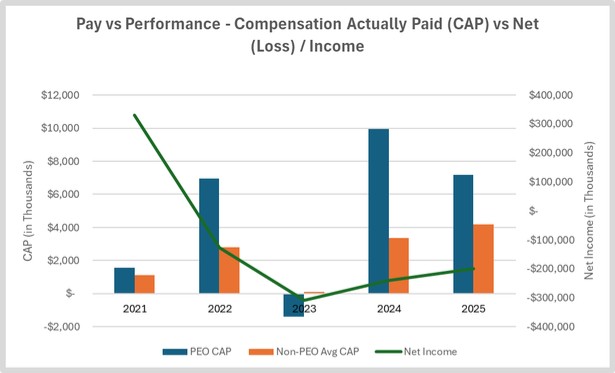
2025 | 3,287,434 | 7,173,585 | 1,904,325 | 4,178,750 | 66.23 | 119.92 | (199.0) | |||||||
2024 |
| 3,075,938 | 9,940,635 | 1,523,794 | 3,377,604 | 47.66 | 90.12 | (239.6) | ||||||
2023 |
| 6,584,919 | (1,396,962) | 2,668,599 | 95,398 | 18.74 | 91.84 | (308.5) | ||||||
2022 |
| 5,628,174 | 6,956,368 | 2,352,186 | 2,794,041 | 62.75 | 88.53 | (126.8) | ||||||
2021 |
| 5,100,101 | 1,561,702 | 2,341,941 | 1,100,648 | 57.40 | 99.37 | 329.6 | ||||||
(1) | Reflects compensation for our Chief Executive Officer, Mr. Kapusta, who served as our PEO for all five fiscal years presented in the table above. |
(2) | The amounts reported for CAP have been calculated in accordance with Item 402(v) of Regulation S-K and do not reflect compensation actually earned, realized, or received by our PEO. The following table discloses the adjustments made to the Summary Compensation Table amounts to calculate the CAP amounts. |
Fiscal year-ended December 31, | ||||||||||
Reconciliation of Summary Compensation Table Total to Compensation Actually Paid for PEO | | 2025 ($) | 2024 ($) | 2023 ($) | | 2022 ($) | | 2021 ($) | ||
Summary Compensation Table Total |
| 3,287,434 | 3,075,938 | 6,584,919 | 5,628,174 | 5,100,101 | ||||
Deduction for Reported Grant Date Fair Value of Stock Awards (a) |
| (1,079,100) | (1,107,181) | (2,502,900) | (2,464,117) | (2,065,081) | ||||
Deduction for Reported Grant Date Fair Value of Option Awards (a) | (1,155,960) | (840,780) | (3,064,662) | (2,006,170) | (2,065,074) | |||||
Addition of fair value at year-end of equity awards granted during the year that remained outstanding and unvested | 5,268,909 | 6,034,988 | 1,549,893 | 5,696,179 | 2,114,800 | |||||
Change in fair value at year-end versus prior year-end for awards granted in prior year that remained outstanding and unvested | 2,057,824 | 2,926,744 | (3,225,394) | 294,663 | (1,571,302) | |||||
Change in fair value at vesting date versus prior year-end for awards granted in prior year that vested during the year | (1,205,522) | (149,075) | (738,818) | (192,361) | 48,258 | |||||
Compensation Actually Paid | 7,173,585 | 9,940,635 | (1,396,962) | 6,956,368 | 1,561,702 | |||||
(a) | Reflects the total of amounts reported in the Stock Awards and Option Awards columns of the Summary Compensation Table for our PEO in each of the reported years. |
(3) | Measurement date equity fair values are calculated with assumptions derived on a basis consistent with, and are not materially different from, those used for grant date fair value purposes. Restricted share units are valued based on the last sale price of our ordinary shares on the Nasdaq Global Select Market on the relevant measurement date. Performance share units are valued by applying the probable or actual outcome based on performance through the measurement date, multiplied by the last sale price of our ordinary shares on the Nasdaq Global Select Market on the relevant measurement date. Options are valued using a Hull & White option pricing model with assumptions established as at the relevant measurement date. |
(4) | Reflects the average compensation for the non-PEO NEOs for each respective year presented. The persons included as non-PEO NEOs in each respective year reflects the relevant individuals included in the Summary Compensation Table for each of the years as follows: |
2021: Alexander Kuta, Christian Klemt, Ricardo Dolmetsch and Pierre Caloz;
2022: Alexander Kuta, Christian Klemt, Ricardo Dolmetsch and Pierre Caloz;
2023: Christian Klemt, Ricardo Dolmetsch, Pierre Caloz, Richard Porter and Jeannette Potts; and
2024: Christian Klemt, Walid Abi-Saab, Pierre Caloz and Jeannette Potts.
2025: Christian Klemt, Walid Abi-Saab and Jeannette Potts
(5) | The amounts reported for CAP have been calculated in accordance with Item 402(v) of Regulation S-K and do not reflect compensation actually earned, realized, or received by our non-PEO NEOs. The following table discloses the adjustments made to the Summary Compensation Table amounts to calculate the CAP amounts. |
Fiscal year-ended December 31, | ||||||||||
Reconciliation of Summary Compensation Table Total to Compensation Actually Paid for non-PEO NEOs | | 2025 ($) | 2024 ($) | 2023 ($) | | 2022 ($) | | 2021 ($) | ||
Summary Compensation Table Total |
| 1,904,325 | 1,523,794 | 2,668,599 | 2,352,186 | 2,341,941 | ||||
Deduction for Reported Grant Date Fair Value of Stock Awards (a) |
| (530,467) | (286,939) | (935,117) | (877,719) | (826,032) | ||||
Deduction for Reported Grant Date Fair Value of Option Awards (a) | (567,840) | (253,935) | (901,029) | (682,913) | (897,864) | |||||
Addition of fair value at year-end of equity awards granted during the year that remained outstanding and unvested | 2,868,743 | 1,933,839 | 520,304 | 1,939,018 | 918,900 | |||||
Change in fair value at year-end versus prior year-end for awards granted in prior year that remained outstanding and unvested | 725,605 | 517,282 | (932,864) | 123,475 | (425,980) | |||||
Change in fair value at vesting date versus prior year-end for awards granted in prior year that vested during the year | (221,616) | (56,436) | (324,495) | (60,006) | (10,317) | |||||
Compensation Actually Paid | 4,178,750 | 3,377,604 | 95,398 | 2,794,041 | 1,100,648 | |||||
(a) | Reflects the total of amounts reported in the Stock Awards and Option Awards columns of the Summary Compensation Table, averaged for our non-PEO NEOs in each of the reported years. |
(6) | Total Shareholder Return (“TSR”) represents the cumulative total shareholder return of investing in our shares for the period beginning on the last trading day of 2021 through the last trading day of each of the years presented in the Pay Versus Performance Table. |
(7) | Peer Group TSR represents the cumulative total shareholder return of the NBI for the period beginning on the last trading day of 2021 through the last trading day of each of the years presented in the Pay Versus Performance Table. The NBI is the peer group used for purposes of Item 201(e) of Regulation S-K under the Exchange Act in our Annual Report on Form 10-K for the year ended December 31, 2025. |
(8) | Reflects Net (Loss) / Income as reported in the Company’s Annual Report on Form 10-K for the years ending December 31, 2025, 2024, 2023, 2022, and 2021. |
(1) | Reflects compensation for our Chief Executive Officer, Mr. Kapusta, who served as our PEO for all five fiscal years presented in the table above. |
(4) | Reflects the average compensation for the non-PEO NEOs for each respective year presented. The persons included as non-PEO NEOs in each respective year reflects the relevant individuals included in the Summary Compensation Table for each of the years as follows: |
2021: Alexander Kuta, Christian Klemt, Ricardo Dolmetsch and Pierre Caloz;
2022: Alexander Kuta, Christian Klemt, Ricardo Dolmetsch and Pierre Caloz;
2023: Christian Klemt, Ricardo Dolmetsch, Pierre Caloz, Richard Porter and Jeannette Potts; and
2024: Christian Klemt, Walid Abi-Saab, Pierre Caloz and Jeannette Potts.
2025: Christian Klemt, Walid Abi-Saab and Jeannette Potts
(7) | Peer Group TSR represents the cumulative total shareholder return of the NBI for the period beginning on the last trading day of 2021 through the last trading day of each of the years presented in the Pay Versus Performance Table. The NBI is the peer group used for purposes of Item 201(e) of Regulation S-K under the Exchange Act in our Annual Report on Form 10-K for the year ended December 31, 2025. |
(2) | The amounts reported for CAP have been calculated in accordance with Item 402(v) of Regulation S-K and do not reflect compensation actually earned, realized, or received by our PEO. The following table discloses the adjustments made to the Summary Compensation Table amounts to calculate the CAP amounts. |
Fiscal year-ended December 31, | ||||||||||
Reconciliation of Summary Compensation Table Total to Compensation Actually Paid for PEO | | 2025 ($) | 2024 ($) | 2023 ($) | | 2022 ($) | | 2021 ($) | ||
Summary Compensation Table Total |
| 3,287,434 | 3,075,938 | 6,584,919 | 5,628,174 | 5,100,101 | ||||
Deduction for Reported Grant Date Fair Value of Stock Awards (a) |
| (1,079,100) | (1,107,181) | (2,502,900) | (2,464,117) | (2,065,081) | ||||
Deduction for Reported Grant Date Fair Value of Option Awards (a) | (1,155,960) | (840,780) | (3,064,662) | (2,006,170) | (2,065,074) | |||||
Addition of fair value at year-end of equity awards granted during the year that remained outstanding and unvested | 5,268,909 | 6,034,988 | 1,549,893 | 5,696,179 | 2,114,800 | |||||
Change in fair value at year-end versus prior year-end for awards granted in prior year that remained outstanding and unvested | 2,057,824 | 2,926,744 | (3,225,394) | 294,663 | (1,571,302) | |||||
Change in fair value at vesting date versus prior year-end for awards granted in prior year that vested during the year | (1,205,522) | (149,075) | (738,818) | (192,361) | 48,258 | |||||
Compensation Actually Paid | 7,173,585 | 9,940,635 | (1,396,962) | 6,956,368 | 1,561,702 | |||||
(a) | Reflects the total of amounts reported in the Stock Awards and Option Awards columns of the Summary Compensation Table for our PEO in each of the reported years. |
(5) | The amounts reported for CAP have been calculated in accordance with Item 402(v) of Regulation S-K and do not reflect compensation actually earned, realized, or received by our non-PEO NEOs. The following table discloses the adjustments made to the Summary Compensation Table amounts to calculate the CAP amounts. |
Fiscal year-ended December 31, | ||||||||||
Reconciliation of Summary Compensation Table Total to Compensation Actually Paid for non-PEO NEOs | | 2025 ($) | 2024 ($) | 2023 ($) | | 2022 ($) | | 2021 ($) | ||
Summary Compensation Table Total |
| 1,904,325 | 1,523,794 | 2,668,599 | 2,352,186 | 2,341,941 | ||||
Deduction for Reported Grant Date Fair Value of Stock Awards (a) |
| (530,467) | (286,939) | (935,117) | (877,719) | (826,032) | ||||
Deduction for Reported Grant Date Fair Value of Option Awards (a) | (567,840) | (253,935) | (901,029) | (682,913) | (897,864) | |||||
Addition of fair value at year-end of equity awards granted during the year that remained outstanding and unvested | 2,868,743 | 1,933,839 | 520,304 | 1,939,018 | 918,900 | |||||
Change in fair value at year-end versus prior year-end for awards granted in prior year that remained outstanding and unvested | 725,605 | 517,282 | (932,864) | 123,475 | (425,980) | |||||
Change in fair value at vesting date versus prior year-end for awards granted in prior year that vested during the year | (221,616) | (56,436) | (324,495) | (60,006) | (10,317) | |||||
Compensation Actually Paid | 4,178,750 | 3,377,604 | 95,398 | 2,794,041 | 1,100,648 | |||||
(a) | Reflects the total of amounts reported in the Stock Awards and Option Awards columns of the Summary Compensation Table, averaged for our non-PEO NEOs in each of the reported years. |
Tabular List of Company Performance Measures
As described in our CD&A, we believe that compensation should pay for performance, align interest with our shareholders, use at-risk compensation to incentivize executives, and attract and retain talented executives. We seek to align compensation opportunities for our NEOs with our strategic priorities, which largely reflect non-financial measures. Total Shareholder Return is the only financial measure (per the definition in Item 402(v)(2) of Regulation S-K) currently used in our executive compensation program to assess performance in respect of the 2021 PSU awards on a relative basis. As a result of Total Shareholder Return already being included in the Pay Versus Performance table, no company-selected measure is identified or reported.
Tabular List of Most Important Performance Measures |
Total Shareholder Return |