Pay Versus Performance
The following table sets forth the compensation information of our principal executive officer (the “PEO”), and the average compensation information of our other named executive officers (“Non-PEO NEOs”), both as reported in the Summary Compensation Table in this proxy statement and with certain adjustments to reflect the “compensation actually paid” (“CAP”, as calculated in accordance with the Securities and Exchange Commission (the “SEC”)) to such individuals, and certain measures of the company’s financial performance, for each of fiscal years 2025, 2024, and 2023.
Year |
Summary Compensation Table Total for PEO ($) (1) |
Compensation Actually Paid to PEO ($) (2) (3) |
Average Summary Compensation Table Total for Non-PEO NEOs ($) (1) |
Average Compensation Actually Paid to Non-PEO NEOs ($) (2) (3) |
Value of Initial Fixed $100 Investment Based on the Total Shareholder Return of the Company ($) |
Net (Loss) Income ($ in thousands) |
2025 |
1,709,838 |
1,457,157 |
869,737 |
735,624 |
13.29 |
(26,975) |
2024 |
1,305,311 |
1,249,339 |
609,298 |
574,451 |
7.37 |
(7,655) |
2023 |
1,694,708 |
1,250,693 |
943,622 |
666,113 |
18.41 |
(15,944) |
(1) The PEO for each of the years presented is Bruce Rodgers. The Non-PEO NEOs for whom the average compensation is presented in this table for each of the years presented are Richard Russell and Ryan Duran.
(2) The amounts shown as CAP have been calculated in accordance with Item 402(v) of Regulation S-K and do not reflect compensation actually realized or received by the company’s NEO. These amounts reflect total compensation as set forth in the Summary Compensation Table for each year, adjusted as described in footnote 3, below.
(3) CAP reflects the exclusions and inclusions of certain amounts for the PEO and Non-PEO NEOs as set forth below. Equity values are calculated in accordance with
FASB ASC Topic 718.
PEO |
|||
Year |
2023 |
2024 |
2025 |
SCT Total Compensation ($) |
1,694,708 |
1,305,311 |
1,709,838 |
Less: Stock and Option Award Values Reported in SCT for the Covered Year ($) |
(844,848) |
- |
(190,931) |
Plus: Fair Value for Stock and Option Awards Granted in the Covered Year that are Outstanding and Unvested at End of Year ($) |
133,611 |
- |
- |
Change in Fair Value of Outstanding Unvested Stock and Option Awards from Prior Years ($) |
- |
- |
- |
Fair Value as of Vesting Date for Awards Granted that Vested in Same Year ($) |
267,222 |
- |
- |
Change in Fair Value of Stock and Option Awards from Prior years that Vested in the Covered Year ($) |
- |
(55,972) |
(61,750) |
Less: Fair Value of Stock and Option Awards Forfeited during the covered Year ($) |
- |
- |
- |
Less: Aggregate Change in Actuarial Present Value of Accumulated Benefit Under Pension Plans ($) |
- |
- |
- |
Plus: Aggregate Service Cost and Prior Service Cost for Pension Plans ($) |
- |
- |
- |
Compensation Actually Paid ($) |
1,250,693 |
1,249,339 |
1,457,157 |
Non-PEO |
|||
Year |
2023 |
2024 |
2025 |
SCT Total Compensation ($) |
1,887,244 |
1,218,596 |
1,739,474 |
Less: Stock and Option Award Values Reported in SCT for the Covered Year ($) |
(1,056,060) |
- |
(191,039) |
Plus: Fair Value for Stock and Option Awards Granted in the Covered Year that are Outstanding and Unvested at End of Year ($) |
167,014 |
- |
- |
Change in Fair Value of Outstanding Unvested Stock and Option Awards from Prior Years ($) |
- |
- |
- |
Fair Value as of Vesting Date for Awards Granted that Vested in Same Year ($) |
334,028 |
- |
- |
Change in Fair Value of Stock and Option Awards from Prior years that Vested in the Covered Year ($) |
- |
(69,695) |
(77,188) |
Less: Fair Value of Stock and Option Awards Forfeited during the covered Year ($) |
- |
- |
- |
Less: Aggregate Change in Actuarial Present Value of Accumulated Benefit Under Pension Plans ($ |
- |
- |
- |
Plus: Aggregate Service Cost and Prior Service Cost for Pension Plans ($) |
- |
- |
- |
Compensation Actually Paid ($) |
1,332,226 |
1,148,901 |
1,471,248 |
(1) The PEO for each of the years presented is Bruce Rodgers. The Non-PEO NEOs for whom the average compensation is presented in this table for each of the years presented are Richard Russell and Ryan Duran.
PEO |
|||
Year |
2023 |
2024 |
2025 |
SCT Total Compensation ($) |
1,694,708 |
1,305,311 |
1,709,838 |
Less: Stock and Option Award Values Reported in SCT for the Covered Year ($) |
(844,848) |
- |
(190,931) |
Plus: Fair Value for Stock and Option Awards Granted in the Covered Year that are Outstanding and Unvested at End of Year ($) |
133,611 |
- |
- |
Change in Fair Value of Outstanding Unvested Stock and Option Awards from Prior Years ($) |
- |
- |
- |
Fair Value as of Vesting Date for Awards Granted that Vested in Same Year ($) |
267,222 |
- |
- |
Change in Fair Value of Stock and Option Awards from Prior years that Vested in the Covered Year ($) |
- |
(55,972) |
(61,750) |
Less: Fair Value of Stock and Option Awards Forfeited during the covered Year ($) |
- |
- |
- |
Less: Aggregate Change in Actuarial Present Value of Accumulated Benefit Under Pension Plans ($) |
- |
- |
- |
Plus: Aggregate Service Cost and Prior Service Cost for Pension Plans ($) |
- |
- |
- |
Compensation Actually Paid ($) |
1,250,693 |
1,249,339 |
1,457,157 |
Non-PEO |
|||
Year |
2023 |
2024 |
2025 |
SCT Total Compensation ($) |
1,887,244 |
1,218,596 |
1,739,474 |
Less: Stock and Option Award Values Reported in SCT for the Covered Year ($) |
(1,056,060) |
- |
(191,039) |
Plus: Fair Value for Stock and Option Awards Granted in the Covered Year that are Outstanding and Unvested at End of Year ($) |
167,014 |
- |
- |
Change in Fair Value of Outstanding Unvested Stock and Option Awards from Prior Years ($) |
- |
- |
- |
Fair Value as of Vesting Date for Awards Granted that Vested in Same Year ($) |
334,028 |
- |
- |
Change in Fair Value of Stock and Option Awards from Prior years that Vested in the Covered Year ($) |
- |
(69,695) |
(77,188) |
Less: Fair Value of Stock and Option Awards Forfeited during the covered Year ($) |
- |
- |
- |
Less: Aggregate Change in Actuarial Present Value of Accumulated Benefit Under Pension Plans ($ |
- |
- |
- |
Plus: Aggregate Service Cost and Prior Service Cost for Pension Plans ($) |
- |
- |
- |
Compensation Actually Paid ($) |
1,332,226 |
1,148,901 |
1,471,248 |
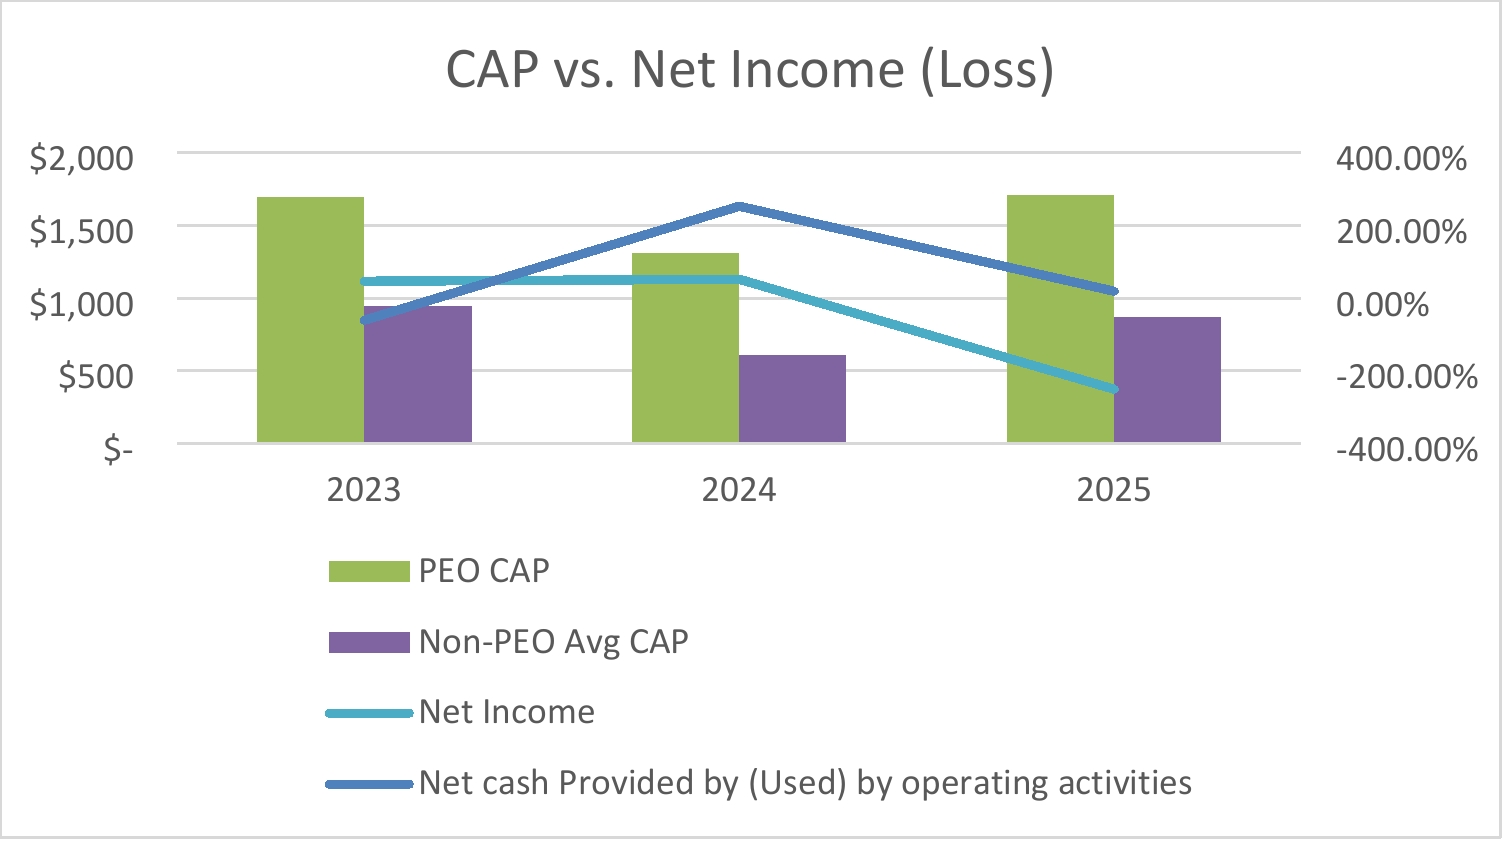
The following chart sets forth the relationship between CAP to our PEO, the average CAP to our Non-PEO NEOs, and net loss attributable to the company over the three most recently completed fiscal years:
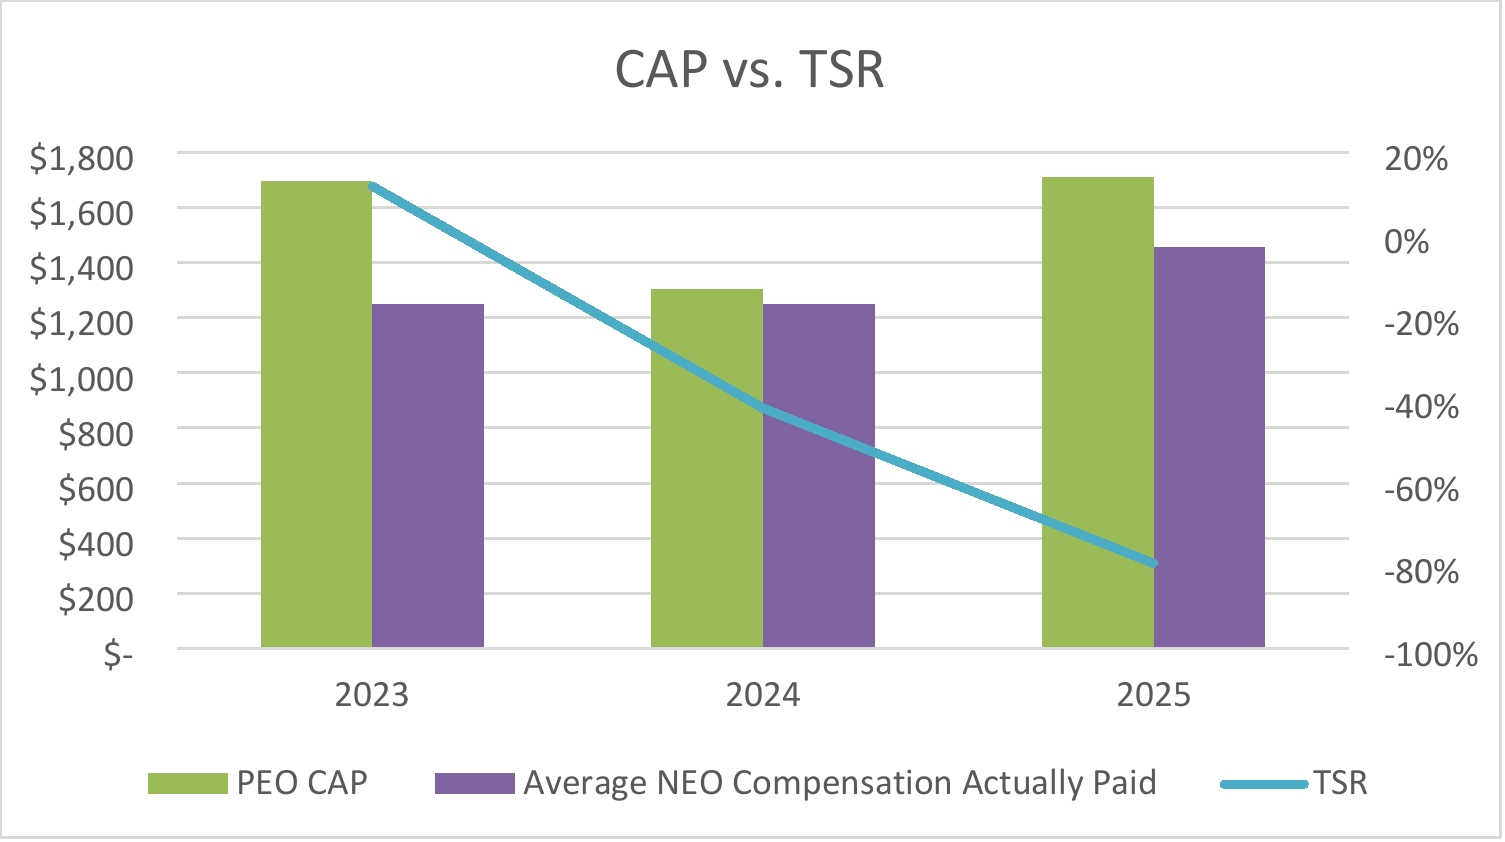
The following chart sets forth the relationship between CAP to our PEO, the average CAP to our Non-PEO NEOs, and the company’s cumulative TSR over the three most recently completed fiscal years: