Pay vs Performance Disclosure - USD ($)
Jan. 15, 2024
Dec. 31, 2023
Dec. 31, 2025
Aug. 05, 2025
Oct. 29, 2023
Dec. 31, 2025
Dec. 31, 2024
Dec. 31, 2024
Dec. 31, 2023
Pay-Versus-Performance
Our Compensation Committee approves and administers our executive compensation program to align executive compensation with stockholder interests by linking pay to performance. Our overall compensation program includes a mix of short-term and long-term components through our annual incentive plan and equity awards. As required by Item 402(v) of Regulation S-K, we are providing the following information about the relationship between the compensation actually paid to our named executive officers and certain aspects of our financial performance. We are a smaller reporting company pursuant to Rule 405 of the Securities Act of 1933, as amended, and, as such, are only required to include information for the past three fiscal years in the table below.
Pay-Versus-Performance Table
Year | Summary Compensation Table Total for PEO #1 (Ping Zhang) ($)(1) | Summary Compensation Table Total for PEO #2 (Han Ying) ($)(1) | Summary Compensation Table Total for PEO #3 (Charles Wu) ($)(1) | Summary Compensation Table Total for PEO #4 (Songjiang Ma) ($)(1) | Compensation Actually Paid to PEO #1 (Ping Zhang) ($)(2) | Compensation Actually Paid to PEO #2 (Han Ying) ($)(2) | Compensation Actually Paid to PEO #3 (Charles Wu) ($)(2) | Compensation Actually Paid to PEO #4 (Songjiang Ma) ($)(2) | Average Summary Compensation Table Total for Non-PEO NEOs ($)(3) | Average Compensation Actually Paid to Non-PEO NEOs ($)(4) | Total Stockholder Return Based on Initial Fixed $100 Investment ($) ($)(5) | Net Income (in thousands) ($)(6) | ||||||||||||||||||||||||
2025 | 4,096,623 | 353,315 | N/A | N/A | 2,888,273 | (1,135,353) | N/A | N/A | 2,654,666 | 1,496,687 | 89 | 9,880 | ||||||||||||||||||||||||
2024 | N/A | 2,888,140 | 15,350 | N/A | N/A | 3,673,377 | 15,350 | N/A | 491,568 | 548,481 | 134 | 17,898 | ||||||||||||||||||||||||
2023 | N/A | N/A | 106,152 | 103,027 | N/A | N/A | 1,178,682 | 28,847,290 | 241,389 | 7,309,307 | 398 | (85,480) | ||||||||||||||||||||||||
(1) | During years 2023 through 2025, the following individuals served as “principal executive officer” during the time periods set forth below: |
Name | Dates as PEO During Years 2023 through 2025 | ||
Songjiang Ma | January 1, 2022 through October 29, 2023 | ||
Charles Wu, Ph.D. | October 30, 2023 through January 15, 2024 | ||
Han Ying, Ph.D. | January 15, 2024 through August 5, 2025 | ||
Ping Zhang | August 5, 2025 through December 31, 2025 | ||
The dollar amounts reported in these columns represent the amount of total compensation reported for each of Mr. Zhang, Dr. Ying, Dr. Wu and Mr. Ma (collectively, our “principal executive officers” or “PEOs”) for each covered fiscal year in the “Total” column of the Summary Compensation Table for each applicable year.
(2) | The dollar amounts reported in these columns represent the amount of “compensation actually paid” to our PEOs, as computed in accordance with Item 402(v) of Regulation S-K, for each covered fiscal year. In accordance with these rules, these amounts reflect total compensation as set forth in the Summary Compensation Table for each year, adjusted as shown below for 2025. Equity values are calculated in accordance with FASB ASC Topic 718, and the valuation assumptions used to calculate fair values did not materially differ from those disclosed at the time of grant. The dollar amounts do not reflect the actual amount of compensation earned or received by or paid to the PEOs during the applicable fiscal year. |
Mr. Zhang 2025 | Dr. Ying 2025 | |||||
Summary Compensation Table Total | $4,096,623 | $353,315 | ||||
Less, value of “Option Awards” reported in Summary Compensation Table | $(3,795,596) | — | ||||
Plus, year-end fair value of outstanding and unvested equity awards granted in the year | $2,499,928 | — | ||||
Plus, fair value as of vesting date of equity awards granted and vested in the year | $87,318 | — | ||||
Plus (less), year over year change in fair value of outstanding and unvested equity awards granted in prior years | — | $(1,068,031) | ||||
Plus (less), change in fair value from last day of prior fiscal year to vesting date for equity awards granted in prior years that vested in the year | — | $(420,636) | ||||
Less, prior year-end fair value for any equity awards forfeited in the year | — | — | ||||
Compensation Actually Paid to PEOs | $2,888,273 | $(1,135,353) | ||||
(3) | The dollar amounts reported in this column represent the average amount of total compensation reported for our NEOs as a group (excluding our PEOs) for each covered fiscal year in the “Total” column of the Summary Compensation Table for each applicable year. Please refer to “Executive Compensation—Summary Compensation Table” above. The names of each NEO included for these purposes in each applicable year are Ruoyu Chen and Weiguo Ye. |
(4) | The dollar amounts reported in these columns represent the amount of “compensation actually paid” to our NEOs as a group (excluding our PEOs), as computed in accordance with Item 402(v) of Regulation S-K, for each covered fiscal year. In accordance with these rules, these amounts reflect total compensation as set forth in the Summary Compensation Table for each year, adjusted as shown below for 2025. Equity values are calculated in accordance with FASB ASC Topic 718, and the valuation assumptions used to calculate fair values did not materially differ from those disclosed at the time of grant. The dollar amounts do not reflect the actual amount of compensation earned or received by or paid to the NEOs as a group (excluding our PEOs) during the applicable fiscal year. |
2025 | |||
Average Summary Compensation Table Total | $2,654,666 | ||
Less, average value of “Option Awards” reported in Summary Compensation Table | $(2,230,168) | ||
Plus, average year-end fair value of outstanding and unvested equity awards granted in the year | $1,045,890 | ||
Plus, average fair value as of vesting date of equity awards granted and vested in the year | $139,010 | ||
Plus (less), average year over year change in fair value of outstanding and unvested equity awards granted in prior years | $(80,741) | ||
Plus (less), average change in fair value from last day of prior fiscal year to vesting date for equity awards granted in prior years that vested in the year | $(31,971) | ||
Less, average prior year-end fair value for any equity awards forfeited in the year | — | ||
Average Compensation Actually Paid to Non-PEO NEOs | $1,496,687 | ||
(5) | Cumulative total stockholder return (“TSR”) is calculated by dividing (a) the sum of (i) the cumulative amount of dividends during the measurement period, assuming dividend reinvestment, and (ii) the difference between our stock price at the end of the applicable measurement period and the beginning of the measurement period by (b) our stock price at the beginning of the measurement period. The beginning of the measurement period for each year in the table is December 31, 2022. |
(6) | The dollar amounts reported represent the amount of net income (loss) reflected in our audited financial statements for each covered fiscal year. |
(1) | During years 2023 through 2025, the following individuals served as “principal executive officer” during the time periods set forth below: |
Name | Dates as PEO During Years 2023 through 2025 | ||
Songjiang Ma | January 1, 2022 through October 29, 2023 | ||
Charles Wu, Ph.D. | October 30, 2023 through January 15, 2024 | ||
Han Ying, Ph.D. | January 15, 2024 through August 5, 2025 | ||
Ping Zhang | August 5, 2025 through December 31, 2025 | ||
The dollar amounts reported in these columns represent the amount of total compensation reported for each of Mr. Zhang, Dr. Ying, Dr. Wu and Mr. Ma (collectively, our “principal executive officers” or “PEOs”) for each covered fiscal year in the “Total” column of the Summary Compensation Table for each applicable year.
(3) | The dollar amounts reported in this column represent the average amount of total compensation reported for our NEOs as a group (excluding our PEOs) for each covered fiscal year in the “Total” column of the Summary Compensation Table for each applicable year. Please refer to “Executive Compensation—Summary Compensation Table” above. The names of each NEO included for these purposes in each applicable year are Ruoyu Chen and Weiguo Ye. |
(2) | The dollar amounts reported in these columns represent the amount of “compensation actually paid” to our PEOs, as computed in accordance with Item 402(v) of Regulation S-K, for each covered fiscal year. In accordance with these rules, these amounts reflect total compensation as set forth in the Summary Compensation Table for each year, adjusted as shown below for 2025. Equity values are calculated in accordance with FASB ASC Topic 718, and the valuation assumptions used to calculate fair values did not materially differ from those disclosed at the time of grant. The dollar amounts do not reflect the actual amount of compensation earned or received by or paid to the PEOs during the applicable fiscal year. |
Mr. Zhang 2025 | Dr. Ying 2025 | |||||
Summary Compensation Table Total | $4,096,623 | $353,315 | ||||
Less, value of “Option Awards” reported in Summary Compensation Table | $(3,795,596) | — | ||||
Plus, year-end fair value of outstanding and unvested equity awards granted in the year | $2,499,928 | — | ||||
Plus, fair value as of vesting date of equity awards granted and vested in the year | $87,318 | — | ||||
Plus (less), year over year change in fair value of outstanding and unvested equity awards granted in prior years | — | $(1,068,031) | ||||
Plus (less), change in fair value from last day of prior fiscal year to vesting date for equity awards granted in prior years that vested in the year | — | $(420,636) | ||||
Less, prior year-end fair value for any equity awards forfeited in the year | — | — | ||||
Compensation Actually Paid to PEOs | $2,888,273 | $(1,135,353) | ||||
(4) | The dollar amounts reported in these columns represent the amount of “compensation actually paid” to our NEOs as a group (excluding our PEOs), as computed in accordance with Item 402(v) of Regulation S-K, for each covered fiscal year. In accordance with these rules, these amounts reflect total compensation as set forth in the Summary Compensation Table for each year, adjusted as shown below for 2025. Equity values are calculated in accordance with FASB ASC Topic 718, and the valuation assumptions used to calculate fair values did not materially differ from those disclosed at the time of grant. The dollar amounts do not reflect the actual amount of compensation earned or received by or paid to the NEOs as a group (excluding our PEOs) during the applicable fiscal year. |
2025 | |||
Average Summary Compensation Table Total | $2,654,666 | ||
Less, average value of “Option Awards” reported in Summary Compensation Table | $(2,230,168) | ||
Plus, average year-end fair value of outstanding and unvested equity awards granted in the year | $1,045,890 | ||
Plus, average fair value as of vesting date of equity awards granted and vested in the year | $139,010 | ||
Plus (less), average year over year change in fair value of outstanding and unvested equity awards granted in prior years | $(80,741) | ||
Plus (less), average change in fair value from last day of prior fiscal year to vesting date for equity awards granted in prior years that vested in the year | $(31,971) | ||
Less, average prior year-end fair value for any equity awards forfeited in the year | — | ||
Average Compensation Actually Paid to Non-PEO NEOs | $1,496,687 | ||
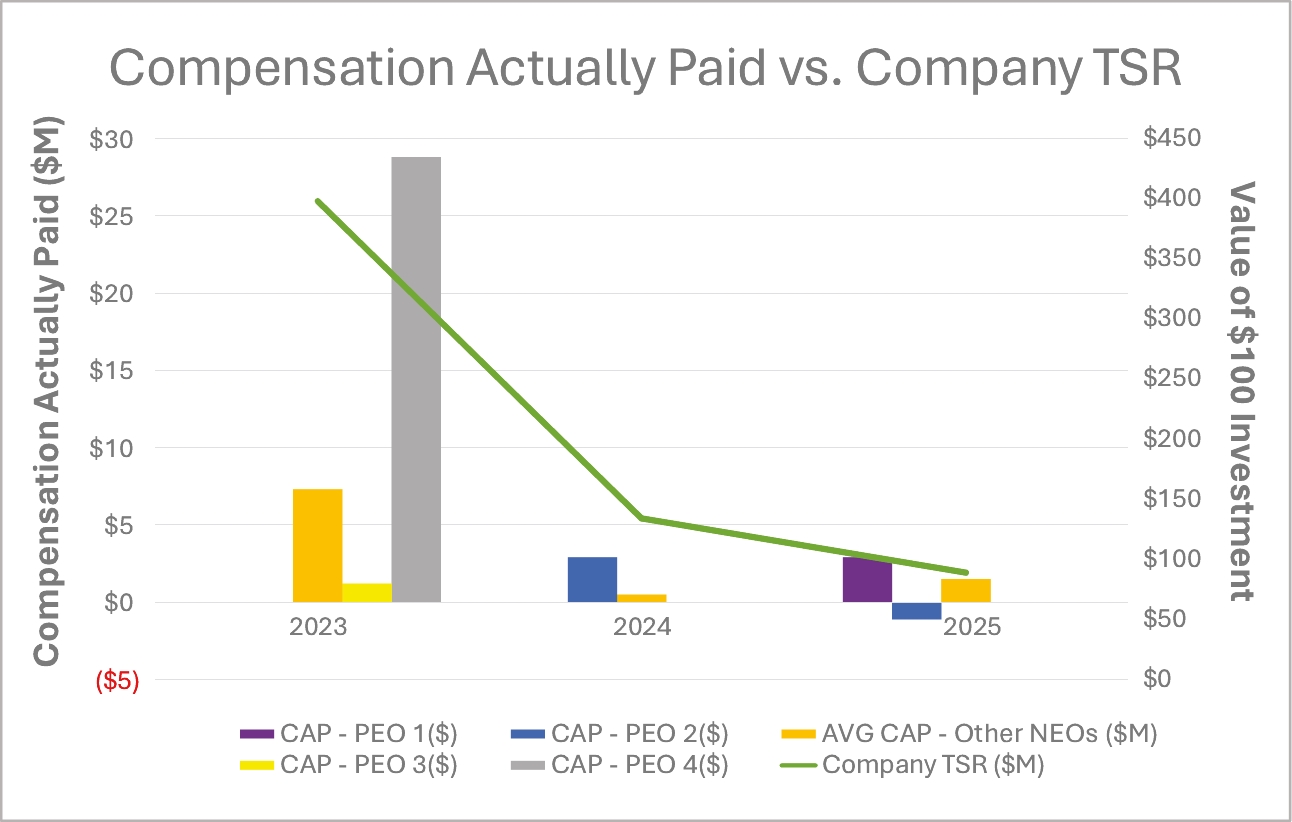
Compensation Actually Paid and Company TSR
The following graph displays the compensation actually paid to our NEOs compared to our TSR.
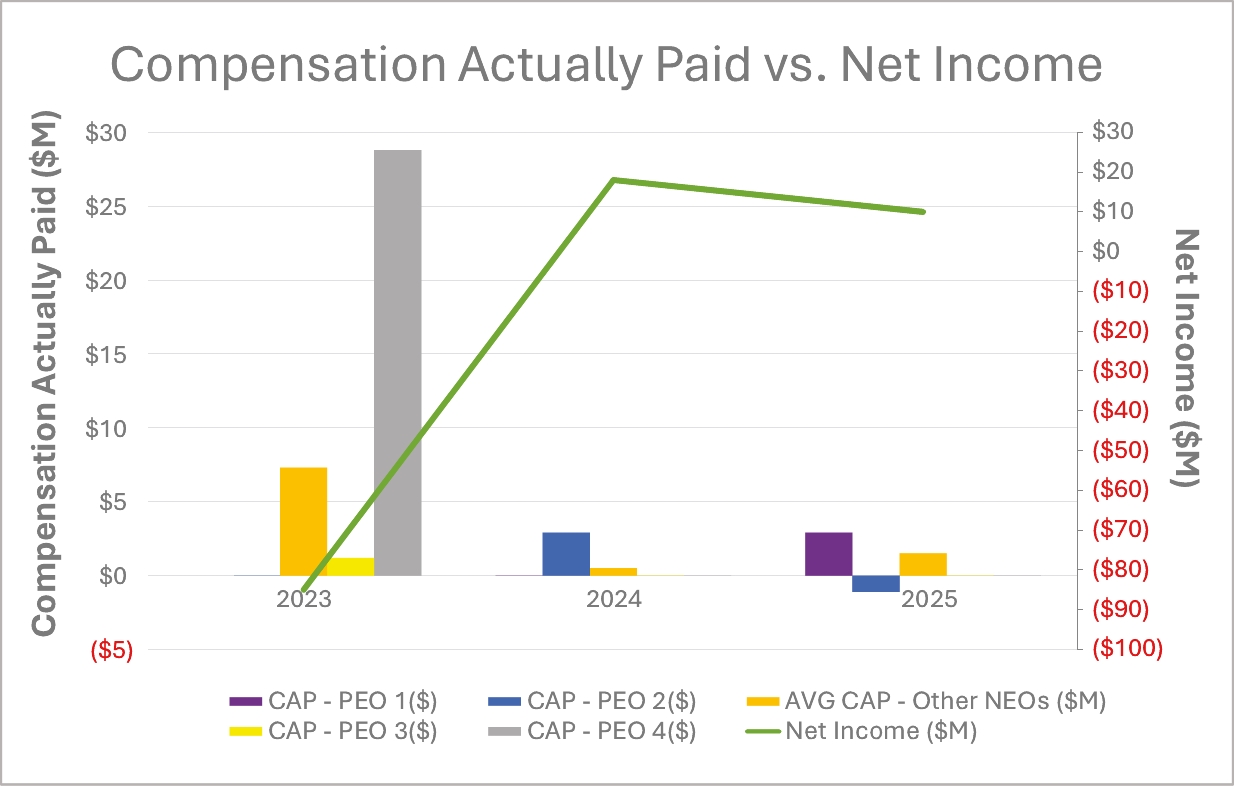
Compensation Actually Paid and Net Income
The following graph displays our compensation actually paid compared to our net income.