Pay vs Performance Disclosure - USD ($)
Feb. 12, 2025
Dec. 31, 2025
Dec. 31, 2025
Dec. 31, 2024
The following table sets forth the compensation for Kelly Goodman, our principal executive officer (“PEO”) from February 13, 2025 through the end of 2025, Eric Dresselhuys, our PEO for 2024 through February 13, 2025, and the average compensation for our named executive officers other than our PEO (“non-PEO NEOs”) for fiscal years 2025 and 2024 (each, a “Covered Year”), both as reported in the Summary Compensation Table and with certain adjustments to reflect the “compensation actually paid” to such individuals, as calculated in accordance with rules adopted by the SEC in August 2022. “Compensation actually paid” does not reflect amounts actually realized by our PEO and Non-PEO NEOs and may be higher or lower than amounts, if any, that are actually realized by such individuals. The table below also provides information for each Covered Year regarding our cumulative total shareholder return (“TSR”) and our net loss.
| Fiscal Year | Summary Compensation Table Total for PEO Eric Dresselhuys ($) | Compensation Actually Paid to PEO Eric Dresselhuys ($)(1)(2) | Summary Compensation Table Total for PEO Kelly Goodman ($) | Compensation Actually Paid to PEO Kelly Goodman ($)(1)(2) | Average Summary Compensation Table Total for Non-PEO NEOs ($)(3)(4) | Average Compensation Actually Paid to Non-PEO NEOs ($)(2)(4) | Value of Initial Fixed $100 Investment Based on TSR ($)(5) | Net Loss ($ in millions)(6) | |||||||||||||||||||||||||||||||||||||||||||||
| 2025 | 749,688 | (32,967) | 883,203 | 708,846 | 488,672 | 375,228 | 1.24 | 63.44 | |||||||||||||||||||||||||||||||||||||||||||||
| 2024 | 1,073,653 | (794,437) | — | — | 1,172,414 | 509,547 | 3.89 | 86.22 | |||||||||||||||||||||||||||||||||||||||||||||
(1) Compensation actually paid does not mean that our PEO was actually paid those amounts in the listed year, but this is a dollar amount derived from the starting point of summary compensation table total compensation under the methodology prescribed under the SEC’s rules, as shown in the adjustment table below.
PEO Eric Dresselhuys | ||||||||||||||
Fiscal Year | 2024 | 2025 | ||||||||||||
Summary Compensation Table Total for PEO ($) | 1,073,653 | 749,688 | ||||||||||||
Minus Grant Date Fair Value of Equity Awards in Summary Compensation Table ($) | (544,716) | — | ||||||||||||
Plus Year End Fair Value of Equity Awards Granted During Year That are Outstanding and Unvested at Fiscal Year End ($) | 198,350 | — | ||||||||||||
Plus Year over Year Change in Fair Value of Outstanding and Unvested Equity Awards ($) | (1,282,500) | — | ||||||||||||
Plus Fair Value as of Vesting Date of Equity Awards Granted and Vested in the Year ($) | 66,314 | — | ||||||||||||
Plus Change in Fair Value between the End of the Prior Year and the Vesting Date of Equity Awards Granted in Prior Years that Vested in the Year ($) | (305,538) | (45,698) | ||||||||||||
Minus Fair Value at the End of the Prior Year of Equity Awards that Failed to Meet Vesting Conditions in the Year ($) | — | (736,957) | ||||||||||||
Compensation Actually Paid to PEO ($) | (794,437) | (32,967) | ||||||||||||
PEO Kelly Goodman | ||||||||||||||
| Fiscal Year | 2024 | 2025 | ||||||||||||
| Summary Compensation Table Total for PEO ($) | — | 883,203 | ||||||||||||
| Minus Grant Date Fair Value of Equity Awards in Summary Compensation Table ($) | — | (142,770) | ||||||||||||
| Plus Year End Fair Value of Equity Awards Granted During Year That are Outstanding and Unvested at Fiscal Year End ($) | — | 59,474 | ||||||||||||
| Plus Year over Year Change in Fair Value of Outstanding and Unvested Equity Awards ($) | — | (56,716) | ||||||||||||
| Plus Fair Value as of Vesting Date of Equity Awards Granted and Vested in the Year ($) | — | 32,288 | ||||||||||||
| Plus Change in Fair Value between the End of the Prior Year and the Vesting Date of Equity Awards Granted in Prior Years that Vested in the Year ($) | — | (66,633) | ||||||||||||
| Minus Fair Value at the End of the Prior Year of Equity Awards that Failed to Meet Vesting Conditions in the Year ($) | — | — | ||||||||||||
| Compensation Actually Paid to PEO ($) | — | 708,846 | ||||||||||||
Non-PEO NEO | ||||||||||||||
| Fiscal Year | 2024 | 2025 | ||||||||||||
Summary Compensation Table Total for Non-PEO NEO ($) | 1,172,414 | 488,672 | ||||||||||||
| Minus Grant Date Fair Value of Equity Awards in Summary Compensation Table ($) | (549,900) | (196,689) | ||||||||||||
| Plus Year End Fair Value of Equity Awards Granted During Year That are Outstanding and Unvested at Fiscal Year End ($) | 175,165 | 180,248 | ||||||||||||
| Plus Year over Year Change in Fair Value of Outstanding and Unvested Equity Awards ($) | (262,492) | (4,755) | ||||||||||||
| Plus Fair Value as of Vesting Date of Equity Awards Granted and Vested in the Year ($) | 58,571 | 5,558 | ||||||||||||
| Plus Change in Fair Value between the End of the Prior Year and the Vesting Date of Equity Awards Granted in Prior Years that Vested in the Year ($) | (84,211) | (13,859) | ||||||||||||
| Minus Fair Value at the End of the Prior Year of Equity Awards that Failed to Meet Vesting Conditions in the Year ($) | — | (83,947) | ||||||||||||
Compensation Actually Paid to Non-PEO NEOs ($) | 509,547 | 375,228 | ||||||||||||
(2) For purposes of the adjustments to determine “compensation actually paid”, we computed the fair value of stock option awards and Restricted Stock Units in accordance with FASB ASC Topic 718 as of the end of the relevant fiscal year, other than fair values of equity awards that vested in the Covered Year, which are valued as of the applicable vesting.
(3) This figure is the average of the summary compensation table total compensation for the non-PEO NEOs in each listed year. The names of the non-PEO NEOs for each Covered Year are Anthony Rabb in 2024, and Anthony Rabb, Jigish Trivedi, and Kate Suhadolnik in 2025.
(4) This figure is the average of compensation actually paid for the non-PEO NEOs in each Covered Year. Compensation actually paid does not mean that these NEOs were actually paid those amounts in the listed year, but this is a dollar amount derived from the starting point of summary compensation table total compensation under the methodology prescribed under the SEC's rules, as shown in the adjustment table below.
(5) TSR is calculated by assuming that a $100 investment was made at the close of trading on December 31, 2023 and reinvesting all dividends until the last day of each reported fiscal year.
(6) The dollar amounts reported are the Company's net loss reflected in the Company’s audited financial statements.
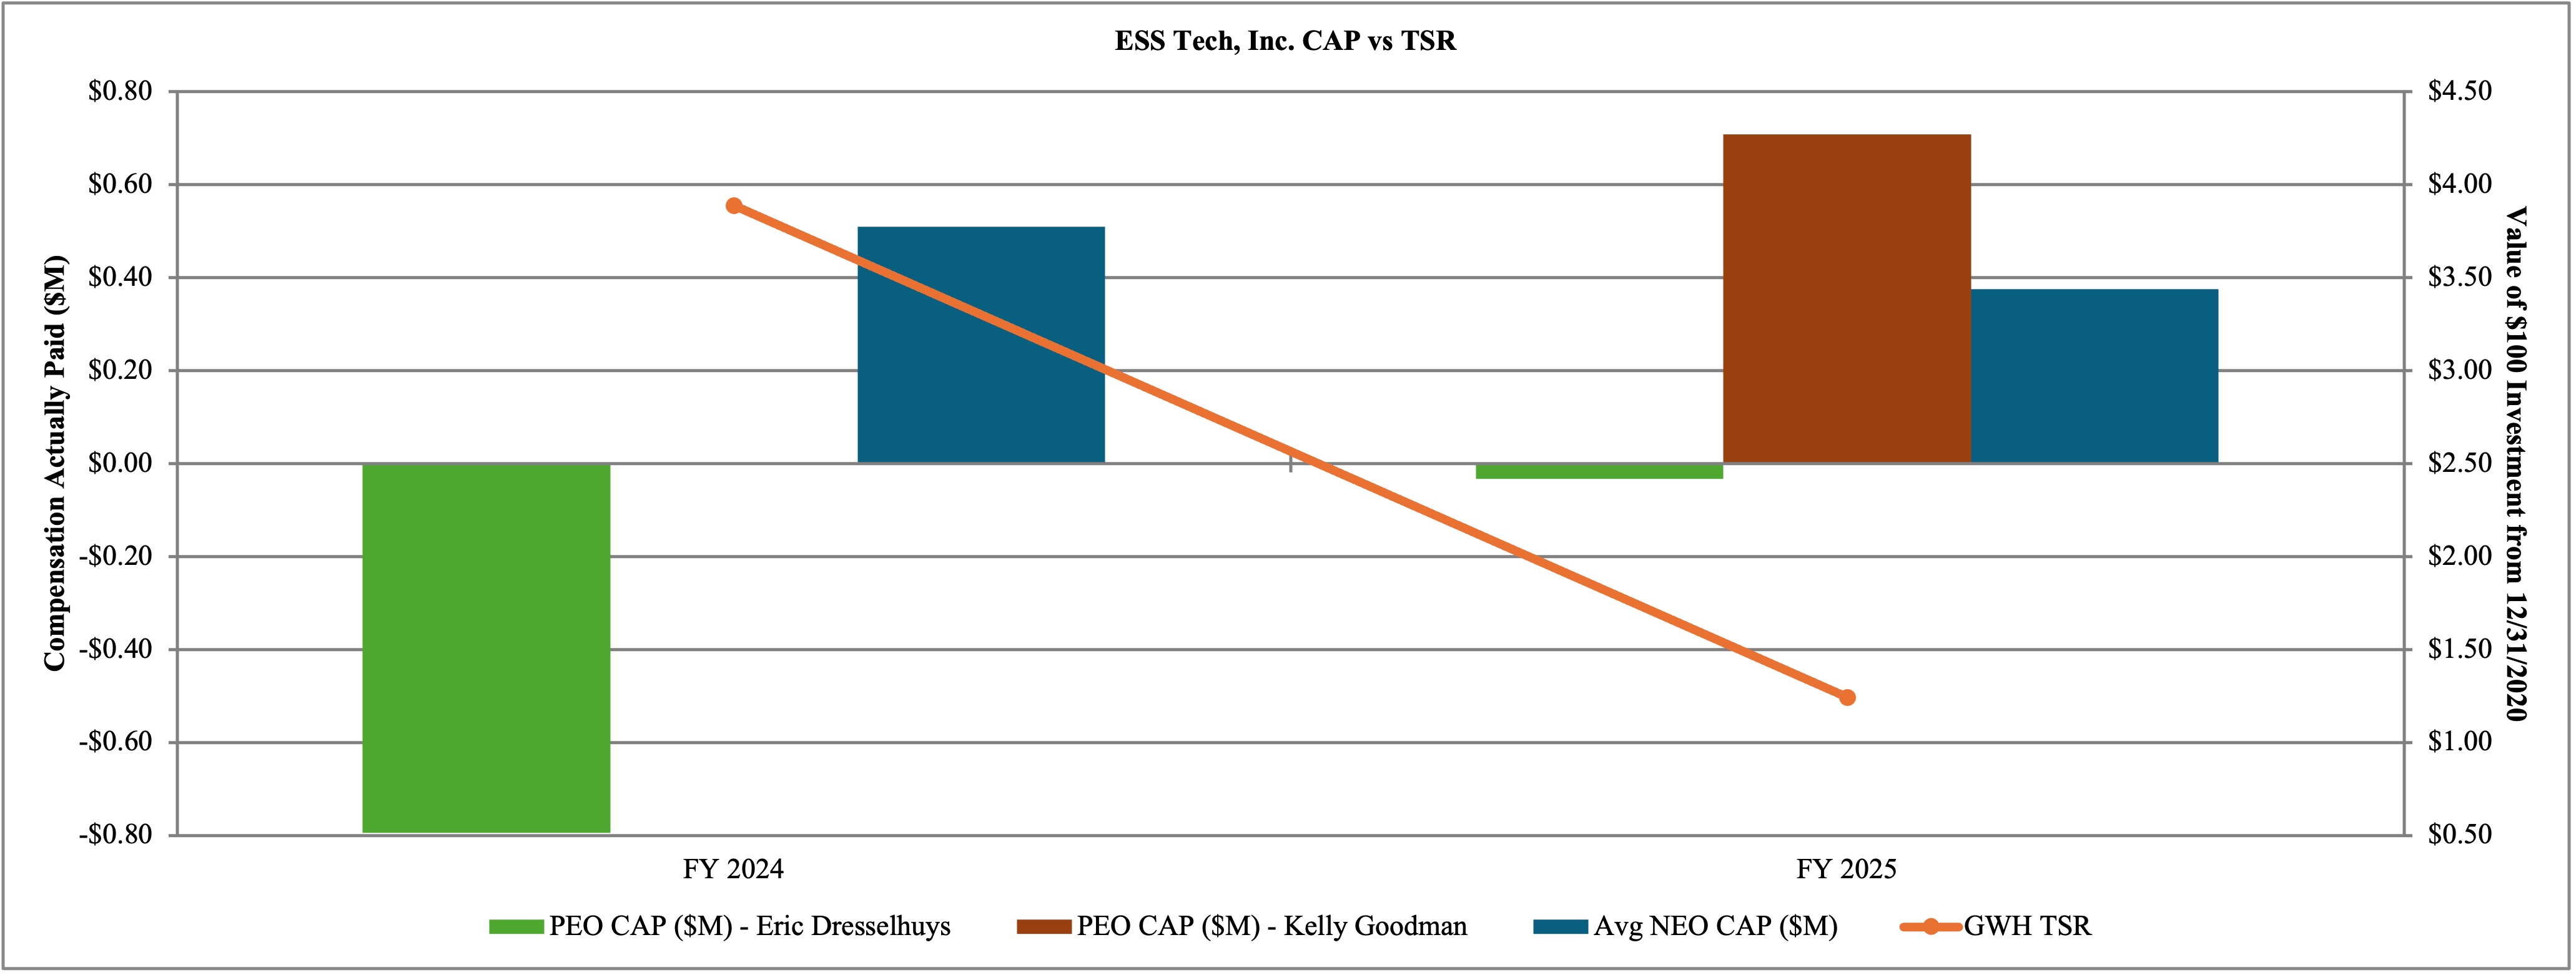
The following chart illustrates the relationship between compensation actually paid (“CA”) to our PEOs and to our non-PEO NEOs for the covered years and our cumulative TSR.
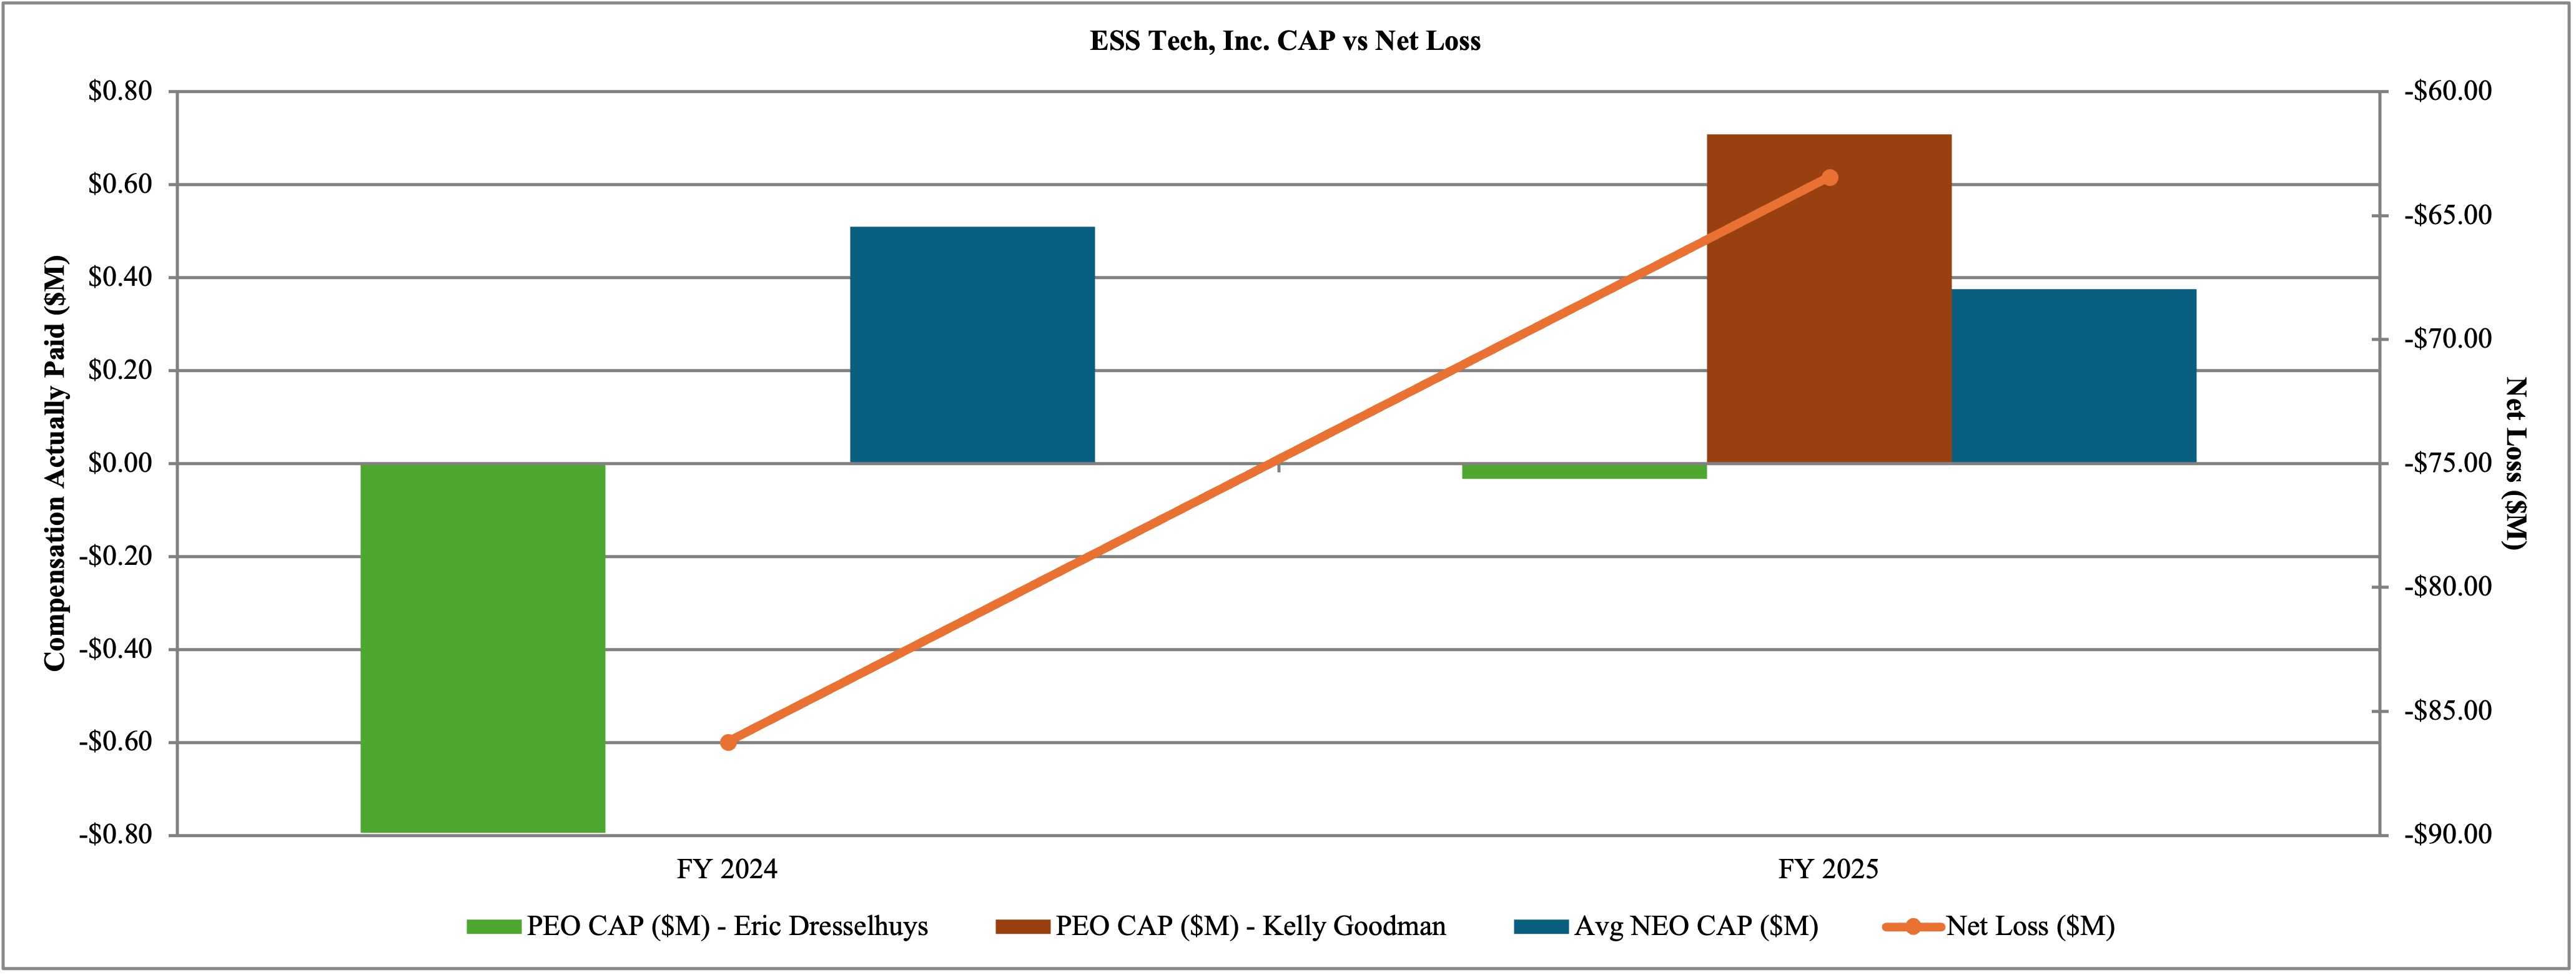
The following chart sets forth the relationship between CA to our PEOs and to our non-PEO NEOs for the covered years and our net loss.