Pay vs Performance Disclosure - USD ($)
Dec. 31, 2025
Dec. 31, 2024
Dec. 31, 2023
Dec. 31, 2022
Dec. 31, 2021
Summary Compensation Table ("SCT") Total For: | Compensation Actually Paid ("CAP") To: | Average SCT for Non-CEO Named Executive Officers(1) ($) | Average CAP to Non-CEO Named Executive Officers(2) ($) | Value of Initial Fixed $100 Investment Based On Total Shareholder Return: | ||||||||||||||||||||||||||||||||||||||||||||||
Year | CEO - Simonds(1) ($) | CEO - Goldfield(1) ($) | CEO - Simonds(2) ($) | CEO - Goldfield(2) ($) | TriNet Group, Inc.(3) ($) | Peer Group(3) ($) | Net Income ($, in millions) | Adjusted EBITDA(4) ($, in millions) | ||||||||||||||||||||||||||||||||||||||||||
| 2025 | 10,552,055 | — | 8,175,192 | — | 3,676,521 | 2,858,898 | 75 | 166 | 155 | 425 | ||||||||||||||||||||||||||||||||||||||||
| 2024 | 18,321,987 | 358,726 | 10,417,483 | (3,155,264) | 3,278,691 | 400,162 | 161 | 210 | 173 | 485 | ||||||||||||||||||||||||||||||||||||||||
| 2023 | — | 9,816,270 | — | 20,456,413 | 3,246,395 | 6,471,887 | 210 | 188 | 375 | 697 | ||||||||||||||||||||||||||||||||||||||||
| 2022 | — | 9,083,348 | — | 2,897,101 | 3,618,009 | 2,459,839 | 120 | 147 | 355 | 688 | ||||||||||||||||||||||||||||||||||||||||
| 2021 | — | 8,657,624 | — | 15,593,113 | 2,520,222 | 4,098,764 | 168 | 192 | 338 | 565 | ||||||||||||||||||||||||||||||||||||||||
Year | CEO | Non-CEO Named Executive Officers | ||||||||||||||||||
| 2025 | Michael Q. Simonds | Jeffery Hayward, Mala Murthy, Anthony Shea Treadway, Kelly Tuminelli, Jay Venkat | ||||||||||||||||||
| 2024 | Michael Q. Simonds, Burton M. Goldfield | Jeffery Hayward, Anthony Shea Treadway, Kelly Tuminelli, Jay Venkat, Alex Warren, Samantha Wellington | ||||||||||||||||||
| 2023 | Burton M. Goldfield | Kelly Tuminelli, Jay Venkat, Alex Warren, Samantha Wellington | ||||||||||||||||||
| 2022 | Burton M. Goldfield | Kelly Tuminelli, Jay Venkat, Alex Warren, Samantha Wellington | ||||||||||||||||||
| 2021 | Burton M. Goldfield | Edward Griese, Olivier Kohler, Kelly Tuminelli, Samantha Wellington | ||||||||||||||||||
Automatic Data Processing, Inc.
Barrett Business Services, Inc.
Insperity, Inc.
Intuit, Inc.
Paychex, Inc.
CEO - Simonds | |||||||||||||||||||||||
Year | Summary Compensation Table Total ($) | Reported Value of Equity Awards(a) ($) | Equity Awards Adjustments(b) ($) | Compensation Actually Paid ($) | |||||||||||||||||||
| 2025 | 10,552,055 | (8,250,004) | 5,873,141 | 8,175,192 | |||||||||||||||||||
| 2024 | 18,321,987 | (13,600,231) | 5,695,727 | 10,417,483 | |||||||||||||||||||
CEO - Goldfield | |||||||||||||||||||||||
Year | Summary Compensation Table Total ($) | Reported Value of Equity Awards(a) ($) | Equity Awards Adjustments(b) ($) | Compensation Actually Paid ($) | |||||||||||||||||||
| 2024 | 358,726 | — | (3,513,990) | (3,155,264) | |||||||||||||||||||
| 2023 | 9,816,270 | (7,000,070) | 17,640,213 | 20,456,413 | |||||||||||||||||||
| 2022 | 9,083,348 | (6,625,148) | 438,901 | 2,897,101 | |||||||||||||||||||
| 2021 | 8,657,624 | (6,000,024) | 12,935,513 | 15,593,113 | |||||||||||||||||||
Equity Component of CAP: | |||||||||||||||||||||||||||||||||||||||||
CEO - Simonds | |||||||||||||||||||||||||||||||||||||||||
Year | Fair Value of Current Year Equity Awards at the End of the Year ($) | Fair Value of Current Year Equity Awards That Vested in the Same Year ($) | Change in Value of Prior Years' Awards Unvested at the End of the Year ($) | Change in Value of Prior Years' Awards That Vested in the Year ($) | Prior Years' Awards that were Forfeited ($) | Equity Value Included in CAP ($) | |||||||||||||||||||||||||||||||||||
(a) | (b) | (c) | (d) | (e) | (a)+(b)+(c)+(d)+(e) | ||||||||||||||||||||||||||||||||||||
| 2025 | 6,535,107 | 694,336 | (923,445) | (432,857) | — | 5,873,141 | |||||||||||||||||||||||||||||||||||
2024(i) | 4,539,862 | 1,155,865 | — | — | — | 5,695,727 | |||||||||||||||||||||||||||||||||||
CEO - Goldfield | |||||||||||||||||||||||||||||||||||||||||
Year | Fair Value of Current Year Equity Awards at the End of the Year ($) | Fair Value of Current Year Equity Awards That Vested in the Same Year ($) | Change in Value of Prior Years' Awards Unvested at the End of the Year ($) | Change in Value of Prior Years' Awards That Vested in the Year ($) | Prior Years' Awards that were Forfeited ($) | Equity Value Included in CAP ($) | |||||||||||||||||||||||||||||||||||
(a) | (b) | (c) | (d) | (e) | (a)+(b)+(c)+(d)+(e) | ||||||||||||||||||||||||||||||||||||
2024(ii) | — | — | (1,738,204) | (1,775,786) | — | (3,513,990) | |||||||||||||||||||||||||||||||||||
| 2023 | 9,798,405 | 886,725 | 2,943,043 | 4,012,040 | — | 17,640,213 | |||||||||||||||||||||||||||||||||||
| 2022 | 5,006,217 | 541,916 | (2,121,477) | (2,987,755) | — | 438,901 | |||||||||||||||||||||||||||||||||||
| 2021 | 9,605,161 | 623,366 | 1,522,676 | 1,184,310 | — | 12,935,513 | |||||||||||||||||||||||||||||||||||
Average Non-CEO NEOs | |||||||||||||||||||||||||||||||||||||||||
Year | Fair Value of Current Year Equity Awards at the End of the Year ($) | Fair Value of Current Year Equity Awards That Vested in the Same Year ($) | Change in Value of Prior Years' Awards Unvested at the End of the Year ($) | Change in Value of Prior Years' Awards That Vested in the Year ($) | Prior Years' Awards that were Forfeited ($) | Equity Value Included in CAP ($) | |||||||||||||||||||||||||||||||||||
(a) | (b) | (c) | (d) | (e) | (a)+(b)+(c)+(d)+(e) | ||||||||||||||||||||||||||||||||||||
| 2025 | 2,188,330 | 136,347 | (312,584) | (289,635) | — | 1,722,458 | |||||||||||||||||||||||||||||||||||
| 2024 | 738,989 | 146,979 | (270,205) | (387,578) | (939,924) | (711,739) | |||||||||||||||||||||||||||||||||||
| 2023 | 2,739,315 | 221,656 | 1,100,484 | 1,101,607 | — | 5,163,062 | |||||||||||||||||||||||||||||||||||
| 2022 | 2,009,609 | 117,573 | (491,225) | (418,994) | — | 1,216,963 | |||||||||||||||||||||||||||||||||||
| 2021 | 2,138,063 | 119,467 | 492,451 | 349,414 | (58,294) | 3,041,101 | |||||||||||||||||||||||||||||||||||
(i)Mr. Simonds joined the Company in February 2024. The amounts reported represent (i) fair value of outstanding equity granted in 2024 and (ii) fair value of Mr. Simonds' new hire RSU award granted in March 2024 and fully vested on December 31, 2024.
(ii)Pursuant to Mr. Goldfield's transition agreement, all of his unvested equity remained outstanding and he continued to be eligible to vest in his equity awards during the term of his consulting agreement with the Company through March 31, 2025.
As reflected in the tables above, equity award values reported for purposes of CAP are calculated by adding or subtracting, as applicable, the following: (a) for any awards granted in the applicable year that are outstanding and unvested as of the end of the year, the year-end fair value of those awards; (b) for any awards that were granted and became vested in the same year, the fair value of those awards as of the vesting date; (c) for any awards granted in a prior year that are outstanding and unvested as of the end of that year, the change in fair value from the end of the prior fiscal year to the end of the applicable year; (d) for any awards granted in prior years that vested in the applicable year, the amount equal to the change in fair value of those awards as of the vesting date (from the end of the prior fiscal year) and (e) the values granted in prior years that were forfeited. The valuation assumptions used to calculate fair values did not materially differ from those disclosed as of the grant date of the equity awards. No dividends or other earnings were paid on unvested shares during the periods reported.
Average Non-CEO NEOs | |||||||||||||||||||||||
Year | Summary Compensation Table Total ($) | Reported Value of Equity Awards(a) ($) | Equity Awards Adjustments(b) ($) | Compensation Actually Paid ($) | |||||||||||||||||||
| 2025 | 3,676,521 | (2,540,081) | 1,722,458 | 2,858,898 | |||||||||||||||||||
| 2024 | 3,278,691 | (2,166,790) | (711,739) | 400,162 | |||||||||||||||||||
| 2023 | 3,246,395 | (1,937,570) | 5,163,062 | 6,471,887 | |||||||||||||||||||
| 2022 | 3,618,009 | (2,375,133) | 1,216,963 | 2,459,839 | |||||||||||||||||||
| 2021 | 2,520,222 | (1,462,559) | 3,041,101 | 4,098,764 | |||||||||||||||||||
Average Non-CEO NEOs | |||||||||||||||||||||||||||||||||||||||||
Year | Fair Value of Current Year Equity Awards at the End of the Year ($) | Fair Value of Current Year Equity Awards That Vested in the Same Year ($) | Change in Value of Prior Years' Awards Unvested at the End of the Year ($) | Change in Value of Prior Years' Awards That Vested in the Year ($) | Prior Years' Awards that were Forfeited ($) | Equity Value Included in CAP ($) | |||||||||||||||||||||||||||||||||||
(a) | (b) | (c) | (d) | (e) | (a)+(b)+(c)+(d)+(e) | ||||||||||||||||||||||||||||||||||||
| 2025 | 2,188,330 | 136,347 | (312,584) | (289,635) | — | 1,722,458 | |||||||||||||||||||||||||||||||||||
| 2024 | 738,989 | 146,979 | (270,205) | (387,578) | (939,924) | (711,739) | |||||||||||||||||||||||||||||||||||
| 2023 | 2,739,315 | 221,656 | 1,100,484 | 1,101,607 | — | 5,163,062 | |||||||||||||||||||||||||||||||||||
| 2022 | 2,009,609 | 117,573 | (491,225) | (418,994) | — | 1,216,963 | |||||||||||||||||||||||||||||||||||
| 2021 | 2,138,063 | 119,467 | 492,451 | 349,414 | (58,294) | 3,041,101 | |||||||||||||||||||||||||||||||||||
(i)Mr. Simonds joined the Company in February 2024. The amounts reported represent (i) fair value of outstanding equity granted in 2024 and (ii) fair value of Mr. Simonds' new hire RSU award granted in March 2024 and fully vested on December 31, 2024.
(ii)Pursuant to Mr. Goldfield's transition agreement, all of his unvested equity remained outstanding and he continued to be eligible to vest in his equity awards during the term of his consulting agreement with the Company through March 31, 2025.
As reflected in the tables above, equity award values reported for purposes of CAP are calculated by adding or subtracting, as applicable, the following: (a) for any awards granted in the applicable year that are outstanding and unvested as of the end of the year, the year-end fair value of those awards; (b) for any awards that were granted and became vested in the same year, the fair value of those awards as of the vesting date; (c) for any awards granted in a prior year that are outstanding and unvested as of the end of that year, the change in fair value from the end of the prior fiscal year to the end of the applicable year; (d) for any awards granted in prior years that vested in the applicable year, the amount equal to the change in fair value of those awards as of the vesting date (from the end of the prior fiscal year) and (e) the values granted in prior years that were forfeited. The valuation assumptions used to calculate fair values did not materially differ from those disclosed as of the grant date of the equity awards. No dividends or other earnings were paid on unvested shares during the periods reported.
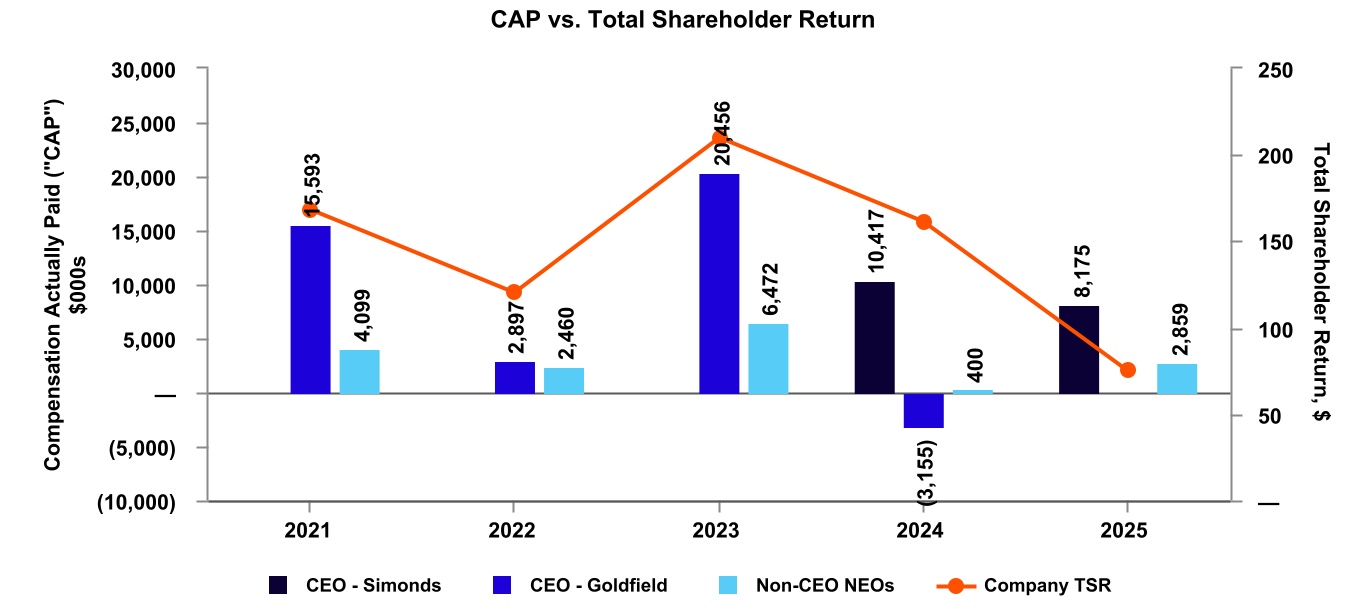
CAP versus TSR
As shown in the chart below, the CEO's and other NEOs' CAP amounts are generally well-aligned with the Company's TSR over the reported five-year period. This is due primarily to the Company's significant use of long-term equity incentives, which we believe creates alignment with our shareholders' interests. Given the significant emphasis we place on equity compensation for our NEOs, changes in CAP for our NEOs is significantly influenced by our stock price on the grant date and over the duration of the relevant years, reflecting general alignment of pay and performance over the periods shown.
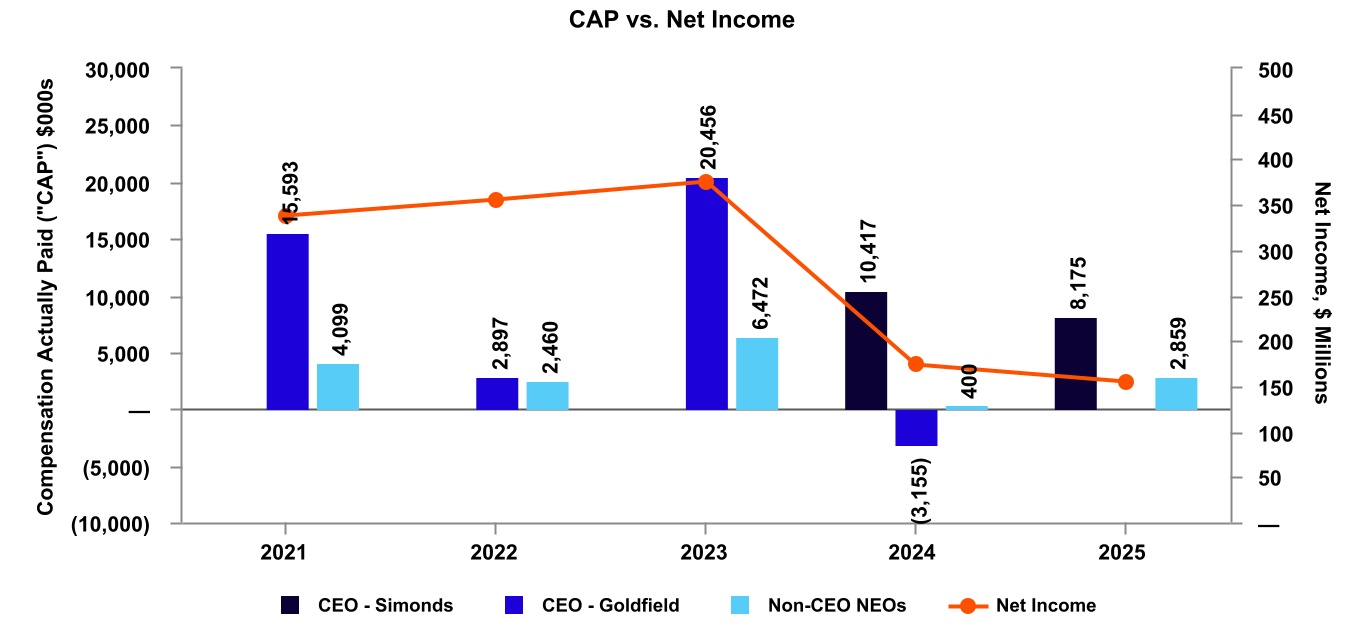
CAP versus Net Income
The chart below compares the CEO's and other NEOs' CAP amounts and the Company's net income over the reported five-year period. While the Company does not use year-over-year changes in net income to determine compensation levels or incentive plan payouts, the measure of net income is correlated with the measure of Adjusted EBITDA, which the Company used when setting goals for the Company's 2025 Executive Bonus Plan. As shown in the chart below, compensation actually paid and net income are generally aligned for the years indicated.
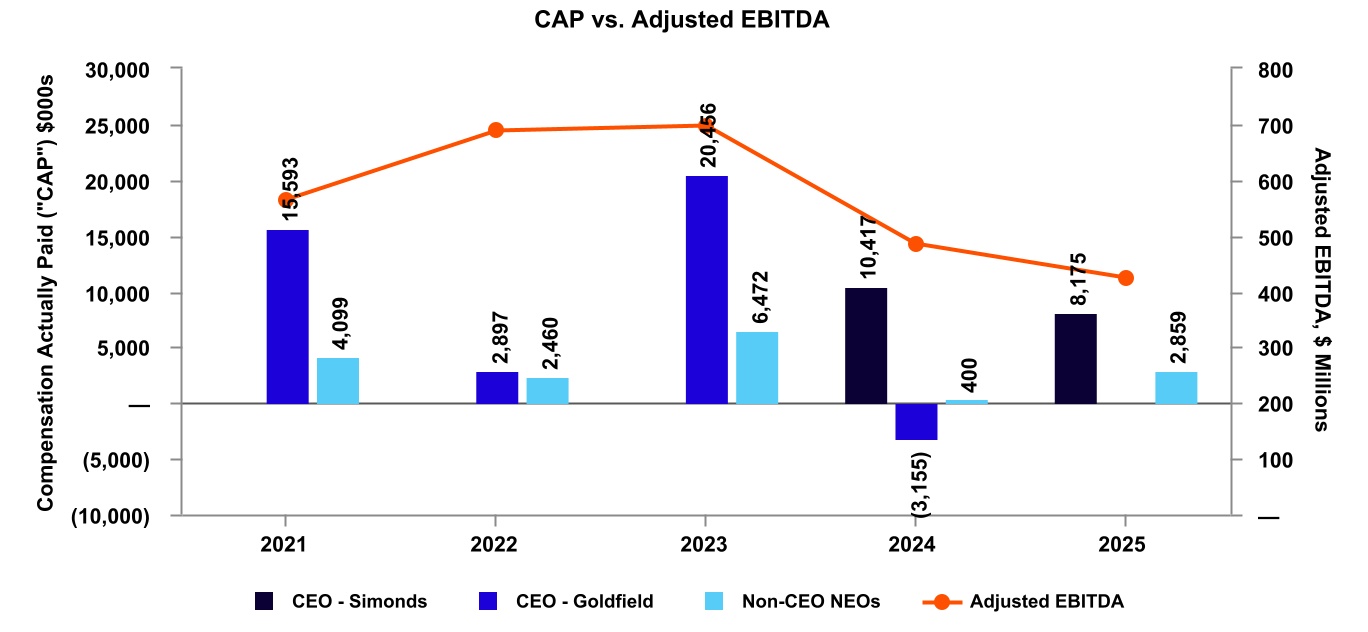
CAP versus Adjusted EBITDA
The chart below compares the CEO's and the other NEOs' CAP amounts to the Company's Adjusted EBITDA over the five-year reported period. As explained in the CD&A, Adjusted EBITDA, our Company-Selected Measure, is a financial performance objective in our 2025 Executive Bonus Plan, constituting 30% of each NEO's total target bonus opportunity. As reflected in the Pay Versus Performance Disclosure table above and the chart below, CAP generally aligns with Adjusted EBITDA, and is significantly impacted by stock price, as described above.
TSR: Company versus Peer Group
The chart below compares the 3-year and 5-year cumulative TSR(1) for the Company and for the companies included in our Peer Index Group. Our Peer Index Group is the peer group index reported in Part II, Item 5, "Market for Registrant's Common Equity, Related Stockholder Matters and Issuer Purchases of Equity Securities," in the Notes to Consolidated Financial Statements in the Annual Report on Form 10-K, for the fiscal year ended December 31, 2025(2).
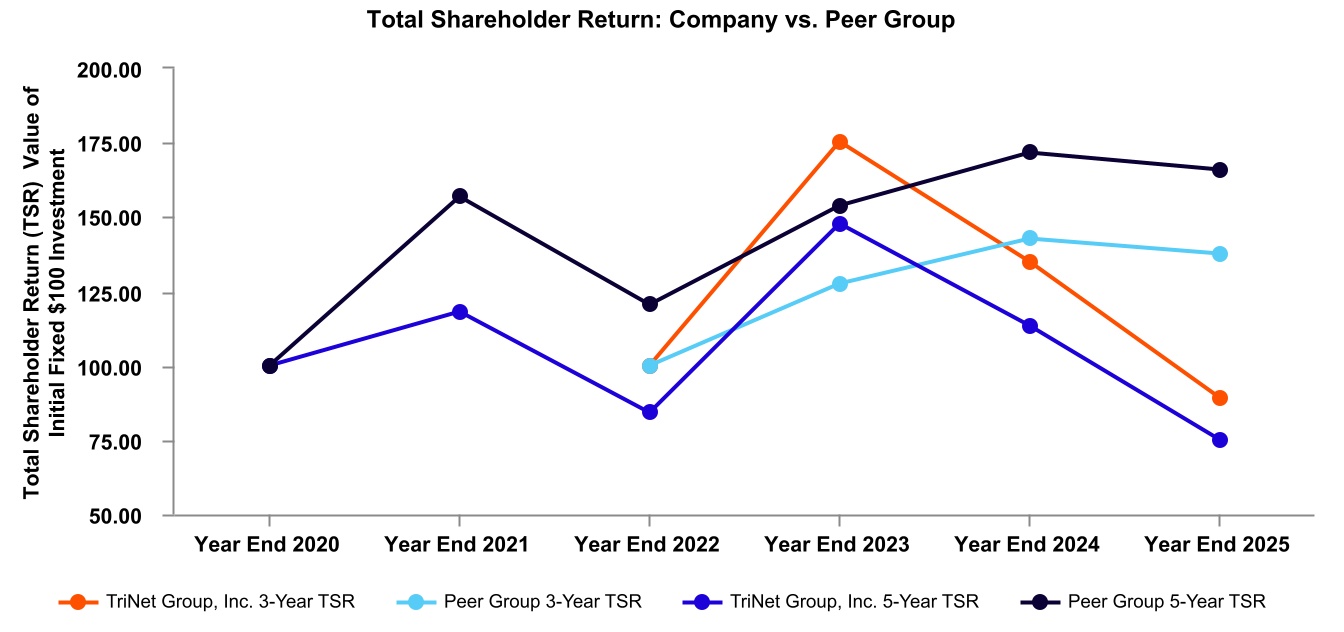
(1)TSR reflected in this table is calculated as described in footnote 3 to the Equity Component of CAP table above.
(2)The Peer Group Index used in the chart above consists of the following companies:
Automatic Data Processing, Inc.
Barrett Business Services, Inc.
Insperity, Inc.
Intuit, Inc.
Paychex, Inc.
Most Important Performance Measures | ||||||||
Adjusted EBITDA | ||||||||
Professional Service Revenue | ||||||||
GAAP EPS | ||||||||