Pay vs Performance Disclosure - USD ($)
Dec. 31, 2025
Dec. 31, 2024
Dec. 31, 2023
Dec. 31, 2022
Dec. 31, 2021
Pay Versus Performance Disclosure
In accordance with Section 953(a) of the Dodd-Frank Wall Street Reform and Consumer Protection Act of 2010, and Item 402(v) of Regulation S-K, we are providing the following disclosure regarding the relationship between executive compensation actually paid to our principal executive officer (“PEO”) and Non-PEO NEOs and certain Company financial performance for the fiscal years listed below. The Compensation Committee did not consider the pay versus performance disclosure in making its pay decision for any of the fiscal years shown. For further information concerning the Company pay-for-performance philosophy and how the Company aligns executive compensation with the Company’s performance, refer to “Executive Compensation – Compensation Discussion and Analysis.”
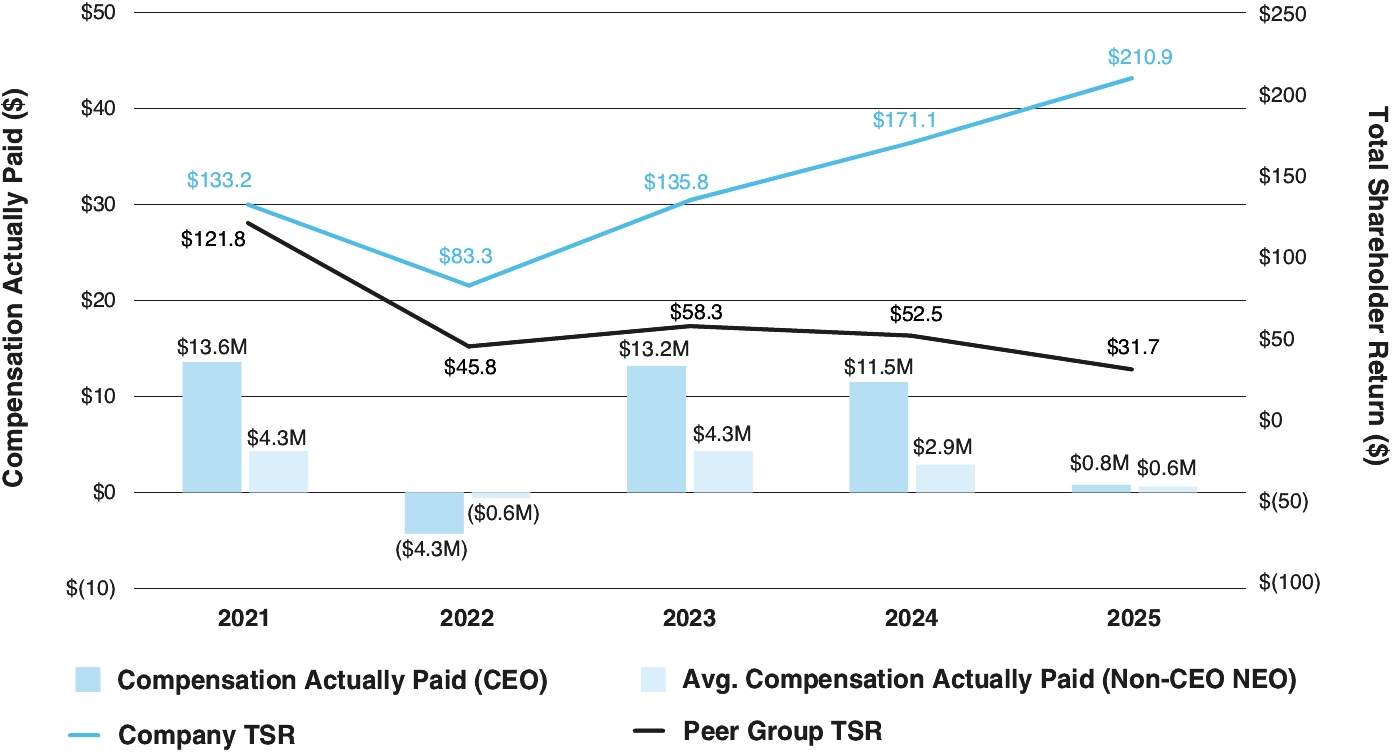
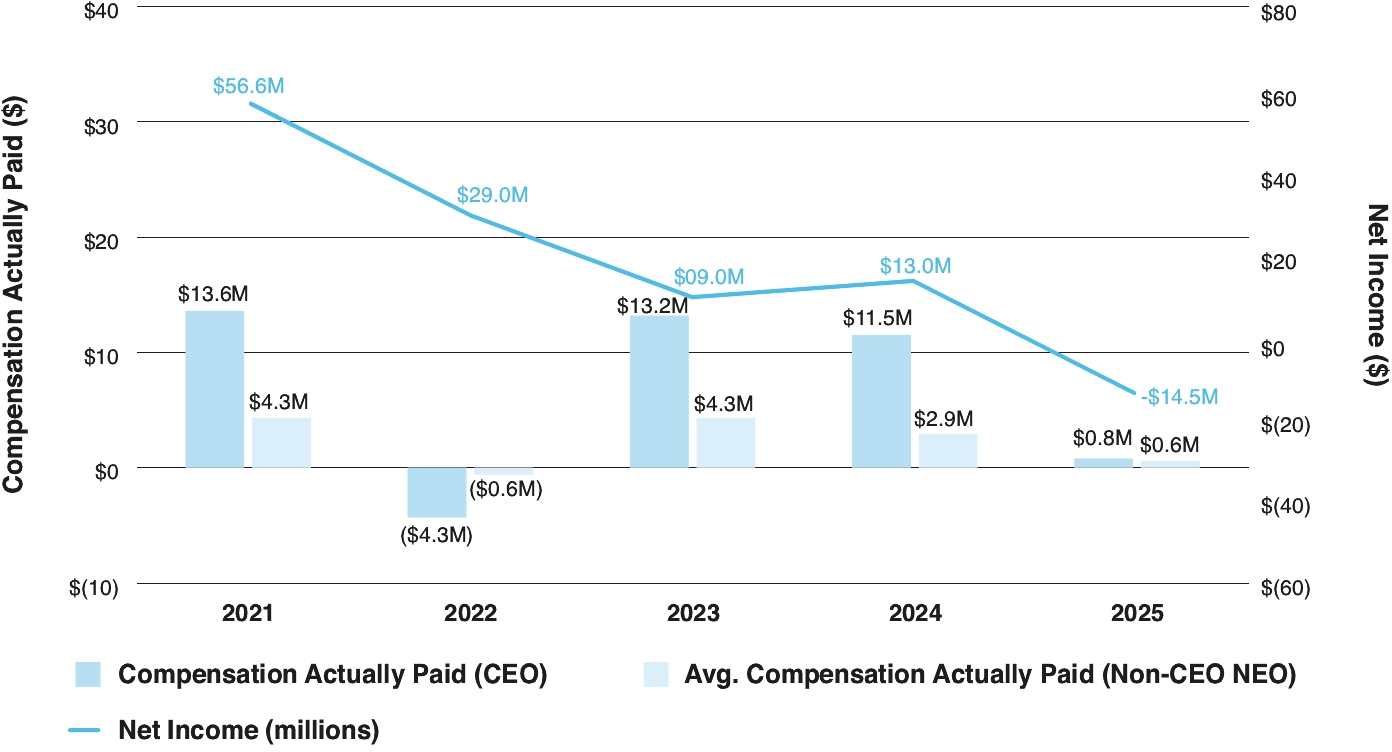
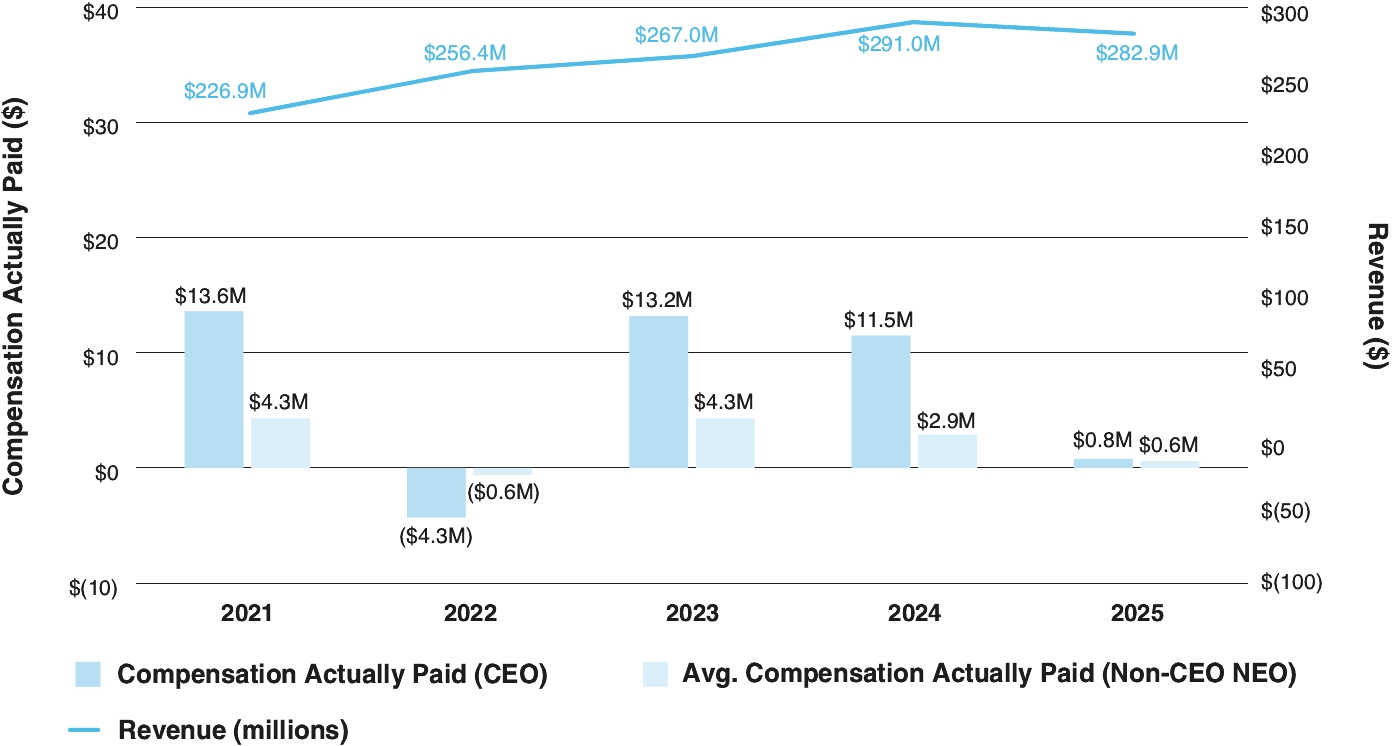
The following table summarizes the executive compensation included in the summary compensation table for the Company’s PEO and the other NEOs, the executive compensation actually paid to the Company’s PEO and other NEO’s (as determined pursuant to SEC disclosure rules) and certain financial performance measures of the Company and its peer group for the fiscal years ended December 31, 2025, 2024, 2023, 2022, and 2021 (each a “Covered Year”).
Year1 | Summary Compensation Table (“SCT”) Total for PEO2 (a) | Compensation Actually Paid to PEO3 | Average Summary Compensation Table Total for Non-PEO NEOs2 (b) | Average Compensation Actually Paid to Non-PEO NEOs3 | Value of Initial Fixed $100 Investment Based On4 | Net Income (in millions) | Revenue (in millions)5 | |||||||||||||||||||
Total Shareholder Return | Peer Group Total Shareholder Return | |||||||||||||||||||||||||
2025 | $9,070,956 | $772,605 | $2,808,289 | $593,706 | $32 | $211 | ($14) | $283 | ||||||||||||||||||
2024 | $9,165,522 | $11,453,669 | $2,873,862 | $2,898,143 | $53 | $171 | $13 | $291 | ||||||||||||||||||
2023 | $10,271,412 | $13,184,909 | $3,427,113 | $4,310,070 | $58 | $136 | $9 | $267 | ||||||||||||||||||
2022 | $7,444,082 | ($4,325,656) | $2,430,191 | ($610,944) | $46 | $83 | $29 | $256 | ||||||||||||||||||
2021 | $8,609,029 | $13,606,543 | $3,012,452 | $4,317,545 | $122 | $133 | $57 | $227 | ||||||||||||||||||
(1) | Rajeev Goel served as the Company’s principal executive officer (“PEO”) for the entirety of fiscal years 2021, 2022, 2023, 2024, and 2025. For fiscal years 2025, 2024, and 2023, The Company’s non-PEO NEOs were Amar Goel, Steven Pantelick, Paulina Klimenko, and Mukul Kumar. Mukul Kumar was also a non-PEO NEO in fiscal years 2021 and 2022. The Company’s non-PEO NEOs for fiscal years 2021 and 2022 were Amar Goel, Steven Pantelick and Jeffrey Hirsch. |
(2) | Amounts reported in these columns represent (i) the total compensation reported in the Summary Compensation Table for the applicable year for our PEO and (ii) the average of the total compensation reported in the Summary Compensation Table for the applicable year for our non-PEO NEOs. |
(3) | Amounts reported in these columns represent (i) the compensation actually paid to the PEO, based on his total compensation reported in the Summary Compensation Table for the indicated fiscal years and adjusted as shown in the table below and (ii) the compensation actually paid to the PEO, based on his total compensation reported in the Summary Compensation Table for the indicated fiscal years and adjusted as shown in the table below. |
(4) | The Peer Group Total Shareholder Return (“TSR”) set forth in this table is based on Nasdaq US Benchmark Software & Computer Services Total Return Index. The comparison assumes $100 was invested for the period starting December 8, 2020, the first day the Company’s common stock began trading on the Nasdaq, through the end of the listed year in the Company and in Nasdaq US Benchmark software & Computer Services Total Return Index, respectively. Historical stock performance is not necessarily indicative of future stock performance. |
(5) | The Company’s Revenue is a key driver of the Company’s performance and stockholder value creation and Revenue achievement was one of two factors under our Bonus Plan for calendar year 2025 (the other being Adjusted Pre-Tax Net Income). |
For each Covered Year, in determining the Compensation Actually Paid to our PEO and the average Compensation Actually Paid to our other NEOs, we deducted and added back the following amounts from the total amounts of compensation reported in columns (a) and (b) for each Covered Year. Note that the dollar amounts shown in this table do not reflect the actual amount of compensation earned by or paid to our PEO or other NEOs during the applicable years.
2025 | ||||||||
PEO | Average Other NEOs | |||||||
Total Compensation, as reported in the “Summary Compensation Table” for the indicated fiscal year | $9,070,956 | $2,808,289 | ||||||
Minus Aggregate grant date fair value of the stock awards and option awards granted during the indicated fiscal year. Amounts shown are the amounts reported in the Summary Compensation Table | ($7,793,276) | ($2,187,098) | ||||||
Plus: Fair Value at Fiscal Year End of Outstanding and Unvested Equity Awards Granted in the Fiscal Year | $3,234,959 | $929,327 | ||||||
Plus (Minus) Change in Fair Value of Outstanding and Unvested Equity Awards Granted in Prior Fiscal Years | ($3,274,459) | ($845,872) | ||||||
Plus Fair Value at Vesting of Equity Awards Granted and Vested in the Fiscal Year | $956,337 | $274,734 | ||||||
Plus (Minus) Change in Fair Value as of the Vesting Date of Equity Awards Granted in Prior Fiscal Years that Vested in the Fiscal Year | ($1,421,912) | ($385,674) | ||||||
Minus Fair Value at the End of the Prior Year of Equity Awards that Failed to Meet Vesting Conditions in the Fiscal Year | $0 | $0 | ||||||
Plus Value of Dividends or Other Earnings Paid on Unvested Awards not Otherwise Reflected in Fair Values | $0 | $0 | ||||||
Compensation Actually Paid | $772,605 | $593,706 | ||||||
For purposes of the above adjustments, the fair value of equity awards on the applicable date were determined in accordance with FASB’s ASC Topic 718, using valuation methodologies that are generally consistent with those used to determine the grant-date fair value for accounting purposes.
(1) | Rajeev Goel served as the Company’s principal executive officer (“PEO”) for the entirety of fiscal years 2021, 2022, 2023, 2024, and 2025. For fiscal years 2025, 2024, and 2023, The Company’s non-PEO NEOs were Amar Goel, Steven Pantelick, Paulina Klimenko, and Mukul Kumar. Mukul Kumar was also a non-PEO NEO in fiscal years 2021 and 2022. The Company’s non-PEO NEOs for fiscal years 2021 and 2022 were Amar Goel, Steven Pantelick and Jeffrey Hirsch. |
(4) | The Peer Group Total Shareholder Return (“TSR”) set forth in this table is based on Nasdaq US Benchmark Software & Computer Services Total Return Index. The comparison assumes $100 was invested for the period starting December 8, 2020, the first day the Company’s common stock began trading on the Nasdaq, through the end of the listed year in the Company and in Nasdaq US Benchmark software & Computer Services Total Return Index, respectively. Historical stock performance is not necessarily indicative of future stock performance. |
(2) | Amounts reported in these columns represent (i) the total compensation reported in the Summary Compensation Table for the applicable year for our PEO and (ii) the average of the total compensation reported in the Summary Compensation Table for the applicable year for our non-PEO NEOs. |
(3) | Amounts reported in these columns represent (i) the compensation actually paid to the PEO, based on his total compensation reported in the Summary Compensation Table for the indicated fiscal years and adjusted as shown in the table below and (ii) the compensation actually paid to the PEO, based on his total compensation reported in the Summary Compensation Table for the indicated fiscal years and adjusted as shown in the table below. |
For each Covered Year, in determining the Compensation Actually Paid to our PEO and the average Compensation Actually Paid to our other NEOs, we deducted and added back the following amounts from the total amounts of compensation reported in columns (a) and (b) for each Covered Year. Note that the dollar amounts shown in this table do not reflect the actual amount of compensation earned by or paid to our PEO or other NEOs during the applicable years.
2025 | ||||||||
PEO | Average Other NEOs | |||||||
Total Compensation, as reported in the “Summary Compensation Table” for the indicated fiscal year | $9,070,956 | $2,808,289 | ||||||
Minus Aggregate grant date fair value of the stock awards and option awards granted during the indicated fiscal year. Amounts shown are the amounts reported in the Summary Compensation Table | ($7,793,276) | ($2,187,098) | ||||||
Plus: Fair Value at Fiscal Year End of Outstanding and Unvested Equity Awards Granted in the Fiscal Year | $3,234,959 | $929,327 | ||||||
Plus (Minus) Change in Fair Value of Outstanding and Unvested Equity Awards Granted in Prior Fiscal Years | ($3,274,459) | ($845,872) | ||||||
Plus Fair Value at Vesting of Equity Awards Granted and Vested in the Fiscal Year | $956,337 | $274,734 | ||||||
Plus (Minus) Change in Fair Value as of the Vesting Date of Equity Awards Granted in Prior Fiscal Years that Vested in the Fiscal Year | ($1,421,912) | ($385,674) | ||||||
Minus Fair Value at the End of the Prior Year of Equity Awards that Failed to Meet Vesting Conditions in the Fiscal Year | $0 | $0 | ||||||
Plus Value of Dividends or Other Earnings Paid on Unvested Awards not Otherwise Reflected in Fair Values | $0 | $0 | ||||||
Compensation Actually Paid | $772,605 | $593,706 | ||||||
For purposes of the above adjustments, the fair value of equity awards on the applicable date were determined in accordance with FASB’s ASC Topic 718, using valuation methodologies that are generally consistent with those used to determine the grant-date fair value for accounting purposes.
The table below contains ranges of assumptions used in the valuation of outstanding equity awards for the relevant fiscal year(s). For more information, please see the notes to our financial statements in our Annual Report on Form 10-K and the footnotes to the Summary Compensation Table of this proxy statement.
Fiscal Year 2025 | |||||
Stock Options | |||||
Expected Term (years) | 4.0 – 9.8 | ||||
Strike Price | $15.33 - $36.25 | ||||
Volatility | 70.9% - 74.4% | ||||
Dividend Yield | 0% | ||||
Risk-Free Interest Rate | 3.6% - 4.4% | ||||
Tabular List of Most Important Financial Performance Measures
The following table presents what we believe are the most important financial measures we used to link executive pay for our PEO and other NEOs for 2025 to our performance and are the sole performance measures utilized under our Bonus Plan. The measures included in this list are not ranked.
Performance Measure | Type of Performance Disclosure | ||||
Revenue | Financial | ||||
Adjusted Pre-Tax Net Income | Financial | ||||