Pay vs Performance Disclosure - USD ($)
Dec. 31, 2025
Dec. 31, 2024
Dec. 31, 2023
Dec. 31, 2022
Dec. 31, 2021
Year | Summary Compensation Table Total for PEO ($) (1) | Compensation Actually Paid to PEO ($) (3) | Average Summary Compensation Table Total for Non-PEO NEOs ($) (2) | Average Compensation Actually Paid to Non-PEO NEOs ($) (3) | Value of Initial Fixed $100 Investment Based On: (4) | Net Income (millions) ($) | Company-Selected Measure (millions) ($) (6) | |||||||||||||||||||
Total Shareholder Return ($) | Peer Group Total Shareholder Return ($) (5) | |||||||||||||||||||||||||
| 2025 | 19,226,580 | (7,029,765) | 4,769,420 | (569,686) | 158 | 130 | 729 | 5,155 | ||||||||||||||||||
| 2024 | 18,352,293 | 25,993,075 | 4,781,809 | 6,343,860 | 302 | 129 | 1,254 | 5,262 | ||||||||||||||||||
| 2023 | 16,299,489 | 40,034,283 | 4,232,352 | 9,055,703 | 282 | 115 | 882 | 4,839 | ||||||||||||||||||
| 2022 | 15,452,138 | 16,037,507 | 3,993,018 | 3,930,345 | 210 | 85 | 808 | 4,660 | ||||||||||||||||||
| 2021 | 14,096,168 | 80,424,211 | 3,719,960 | 17,061,159 | 209 | 105 | 794 | 4,247 | ||||||||||||||||||
(1) Mr. Hall was our PEO for each of the years presented.
(2) During 2025, our non-PEO NEOs consisted of Messrs. Safian, Hensel, Kim and Ms. Kranich. During 2024 and 2023, our non-PEO NEOs consisted of Messrs. Safian, Hensel, and Alwyn Dawkins (our former EVP, Global Business Sales) and Ms. Kranich. During 2022, our non-PEO NEOs consisted of Messrs. Safian, Dawkins, Hensel and Jules P. Kaufman (our former General Counsel) and Ms. Kranich. During 2021, our non-PEO NEOs consisted of Messrs. Safian, Dawkins and Kaufman and Ms. Kranich.
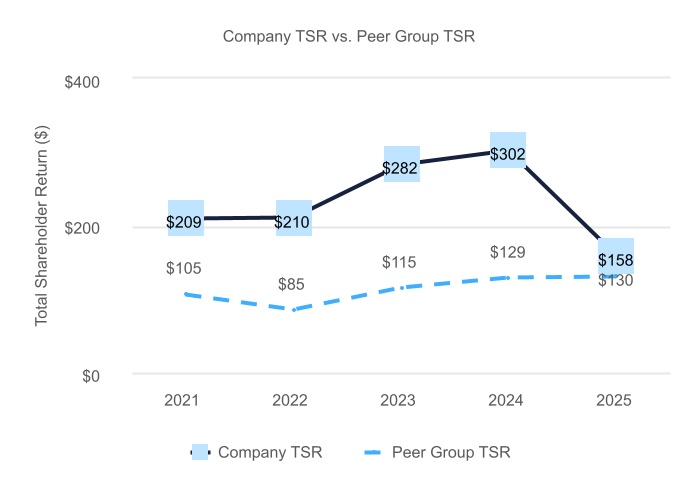
(5) The peer group used by the Company consists of the companies used in the Company’s performance graph as required by Item 201(e) of Regulation S-K and reported in Part II, Item 5 of its annual report for the fiscal year ended December 31, 2025, namely, the S&P 500 IT Services Index.
(3) “Compensation actually paid” is calculated in accordance with Item 402(v) of Regulation S-K. Our NEOs are not eligible to participate in the Company's pension plans, so no adjustments have been recorded related to pension service. The tables below set forth each adjustment made during each year presented in the table to calculate the “compensation actually paid” to our NEOs during each year in the table (any aggregate sum discrepancies are due to rounding):
| Reconciliation of Summary Compensation Table Total Compensation to “Compensation Actually Paid” | for PEO (i) 2025 | for Non-PEO NEOs (Average) (i) 2025 | |||||||||
| Summary Compensation Table Total Compensation | 19,226,580 | 4,769,420 | |||||||||
| Adjustments: | |||||||||||
| Deduction for amounts reported under the “Stock Awards” column in the Summary Compensation Table for the covered fiscal year | (11,619,477) | (2,334,478) | |||||||||
| Deduction for amounts reported under the “Option Awards” column in the Summary Compensation Table for the covered fiscal year | (4,979,932) | (1,000,564) | |||||||||
| Fair value of awards granted during year that remain unvested and outstanding as of covered year end | 5,071,968 | 815,097 | |||||||||
| Fair value as of vest date of awards granted during year that vested during covered year | — | — | |||||||||
| Change in fair value from prior year-end to covered year-end of awards granted prior to covered year that were outstanding and unvested as of year-end | (18,202,280) | (3,389,360) | |||||||||
| Change in fair value from prior year-end to vesting date of awards granted prior to covered year that vested during covered year | 3,473,376 | 570,198 | |||||||||
| Deduction of fair value as of prior year-end of awards granted prior to covered year that were forfeited during covered year | — | — | |||||||||
| Increase based upon incremental fair value of awards modified during year | — | — | |||||||||
| Increase based on dividends or other earnings paid during covered year, prior to vesting date of award | — | — | |||||||||
| Compensation Actually Paid | (7,029,765) | (569,686) | |||||||||
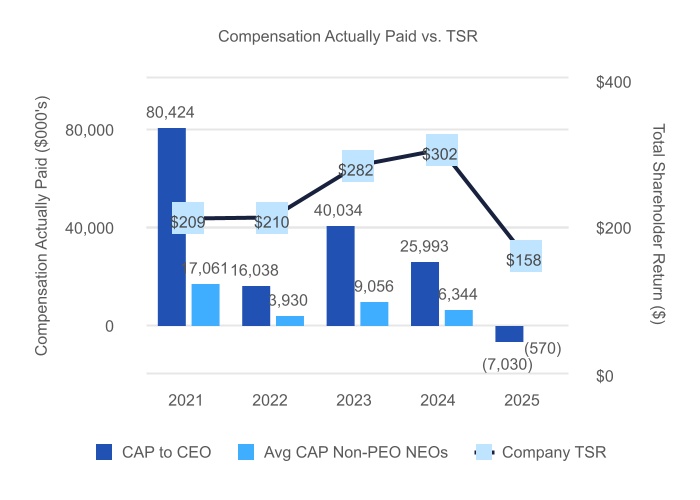
The following graphs provide a comparison of the Company’s five-year cumulative TSR with that of the peer group index, as well as comparisons of “compensation actually paid” as disclosed in the Pay Versus Performance Table with each of Company TSR, net income and CV (the Company-Selected Measure).
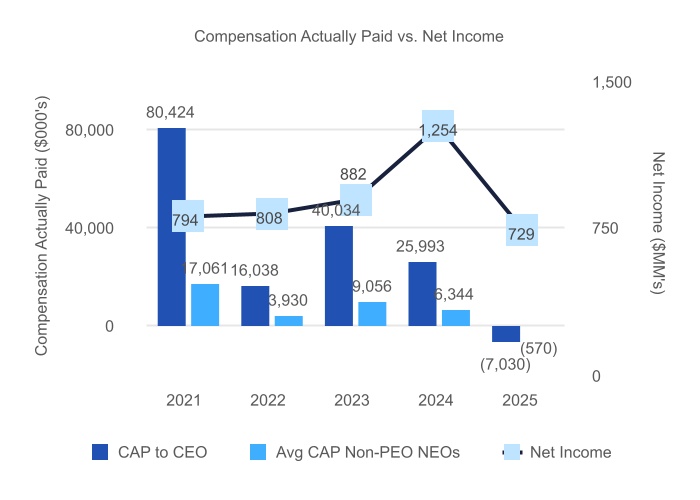
The following graphs provide a comparison of the Company’s five-year cumulative TSR with that of the peer group index, as well as comparisons of “compensation actually paid” as disclosed in the Pay Versus Performance Table with each of Company TSR, net income and CV (the Company-Selected Measure).
The following graphs provide a comparison of the Company’s five-year cumulative TSR with that of the peer group index, as well as comparisons of “compensation actually paid” as disclosed in the Pay Versus Performance Table with each of Company TSR, net income and CV (the Company-Selected Measure).
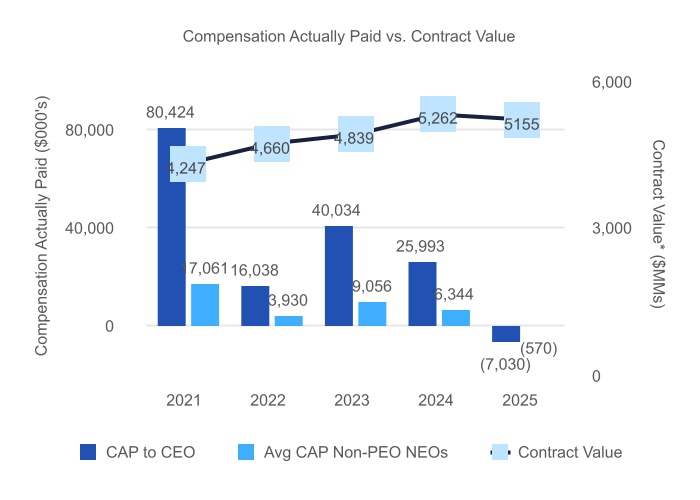
* Each year’s CV has been calculated using the foreign currency rates for such year. | |||||
The following graphs provide a comparison of the Company’s five-year cumulative TSR with that of the peer group index, as well as comparisons of “compensation actually paid” as disclosed in the Pay Versus Performance Table with each of Company TSR, net income and CV (the Company-Selected Measure).
The following provides a list of the financial performance measures that we believe are the most important financial performance measures used to link NEO compensation to company performance for the most recent fiscal year. For more information, see Compensation Discussion and Analysis.
Most Important Financial Performance Measures | ||
| Contract Value (CV) | ||
| Revenue | ||
| Earnings Before Interest, Taxes, Depreciation and Amortization (EBITDA) | ||
(4) Assumes $100 was invested in our Common Stock (with the reinvestment of all dividends) from December 31, 2020 to December 31, 2025.
(6) Contract Value (“CV”) represents the dollar value attributable to all of our subscription-related contracts. It is calculated as the annualized value of contracts in effect at a specific point in time, without regard to the duration of the contract. CV primarily includes Insights deliverables for which revenue is recognized on a ratable basis and other deliverables (primarily conferences tickets) included with subscription-based Insights products for which revenue is recognized when the deliverable is utilized.