Pay vs Performance Disclosure - USD ($)
Dec. 31, 2025
Dec. 31, 2024
Dec. 31, 2023
Dec. 31, 2022
Dec. 31, 2021
| Pay versus Performance | ||||||||||||||
As required by Item 402(v) of Regulation S-K, we are providing the following disclosure regarding executive compensation paid to our current principal executive officer and former principal executive officer (“PEOs”), our NEOs other than our PEOs (the “Other NEOs”), and company performance for the fiscal years listed below. Our Compensation Committee did not consider the pay versus performance disclosure below in making its pay decisions for any of the years shown. For further information concerning our pay-for-performance philosophy and how we structure our executive compensation to drive and reward performance, refer to “Executive Compensation—Compensation Discussion and Analysis.”
The amounts shown below are calculated in accordance with Item 402(v) of Regulation S-K.
| Value of Initial Fixed $100 Investment Based On: | ||||||||||||||||||||||||||||||||||||||
| Year | Summary Compensation Table Total for Jacob Leach $(1) | Summary Compensation Table Total for Kevin Sayer $(1) | Compensation Actually Paid to Jacob Leach $(1)(2)(3) | Compensation Actually Paid to Kevin Sayer $(1)(2)(3) | Average Summary Compensation Table Total for Other NEOs $(2)(3)(4) | Average Compensation Actually Paid to Other NEOs $(2)(3)(4) | Total Shareholder Return $(5) | Peer Group Total Shareholder Return $(5) | Net Income (in millions) $ | Company Selected Measure: Revenue (in millions) $ | ||||||||||||||||||||||||||||
| 2025 | 7,985,960 | 16,282,598 | 6,679,778 | 12,992,295 | 6,605,046 | 4,205,605 | 71.81 | 78.69 | 836.3 | 4,635.5 | (6) | |||||||||||||||||||||||||||
| 2024 | — | 15,828,797 | — | (8,689,910) | 5,619,919 | 532,201 | 84.14 | 78.89 | 576.2 | 4,034.6 | (7) | |||||||||||||||||||||||||||
| 2023 | — | 15,712,244 | — | 22,999,097 | 5,015,577 | 6,071,441 | 134.25 | 74.82 | 541.5 | 3,608.6 | (8) | |||||||||||||||||||||||||||
| 2022 | — | 15,435,652 | — | 5,735,702 | 4,440,975 | 3,929,405 | 122.51 | 79.32 | 341.2 | 2,964.9 | (9) | |||||||||||||||||||||||||||
| 2021 | — | 11,985,324 | — | 36,052,076 | 4,962,060 | 6,403,115 | 145.23 | 103.50 | 216.9 | 2,422.5 | (10) | |||||||||||||||||||||||||||
(1)Kevin Sayer served as Dexcom’s PEO for the years 2021 through September 13, 2025. Mr. Sayer took a medical leave of absence effective September 14, 2025. Effective September 14, 2025, Dexcom’s Board of Directors appointed Jacob Leach as interim PEO. Effective January 1, 2026, Mr. Leach was appointed our President and Chief Executive Officer.
| 2025 | ||||||||||||||
Jacob Leach ($) | Kevin Sayer ($) | Average for Other NEOs ($) | ||||||||||||
| Summary Compensation Table | 7,985,960 | 16,282,598 | 6,605,046 | |||||||||||
| Adjustments for Grant Date Fair Value | ||||||||||||||
| Deductions for equity awards reported in Summary Compensation Table | (5,936,062) | (13,853,723) | (5,563,024) | |||||||||||
| Adjustments for Changes in Equity Fair Value | ||||||||||||||
| Year-end Fair Value of Equity Awards Granted During the Year that Remained Unvested as of the End of the Covered Year | 4,930,431 | 11,103,100 | 3,413,069 | |||||||||||
| Vesting Date Fair Value for Awards Granted and Vested in the Same Fiscal Year | — | — | — | |||||||||||
| Change in Year-end Fair Value of Equity Awards Granted During Prior Years that Remained Unvested as of the End of the Covered Year | (371,745) | (1,201,686) | (277,990) | |||||||||||
| Change in Fair Value from Prior Year-end to Vesting Date for Awards Granted in Prior Years that Vested in Covered Fiscal Year | 71,194 | 662,006 | 28,504 | |||||||||||
| Prior Year-End Fair Value for Awards Granted in Prior Years that are forfeited during the Covered Year | — | — | — | |||||||||||
Net Increases for the Inclusion of Rule 402(v) Equity Values | 4,629,880 | 10,563,420 | 3,163,583 | |||||||||||
| Compensation Actually Paid | 6,679,778 | 12,992,295 | 4,205,605 | |||||||||||
(3)The SCT totals reported for the PEOs and the average for the Other NEOs for each other year were subject to the adjustments as required by Regulation S-K Item 402(v) (2)(iii) to calculate CAP. Equity values are calculated in accordance with ASC Topic 718, and the valuation assumptions used to calculate fair values did not materially differ from those disclosed at the time of the grant.
(4)For the applicable fiscal year, other NEOs include:
2025: Jereme Sylvain, Michael Brown, Jon Coleman and Sadie Stern;
2024: Jereme Sylvain, Michael Brown, Jacob Leach, Sadie Stern, and Teri Lawver;
2023: Jereme Sylvain, Michael Brown, Teri Lawver, and Jacob Leach;
2022: Jereme Sylvain, Michael Brown, Girish Naganathan, and Jacob Leach;
2021: Jereme Sylvain, Paul Flynn, Jacob Leach, Chad Patterson, and Quentin Blackford.
(5)$100 invested on December 31, 2020 in Dexcom common stock or the S&P Health Care Equipment Select Industry index, including reinvestment of any dividends.
(6)We have identified 2025 Adjusted Revenue as described in the Compensation Discussion and Analysis, as the most important financial performance measure used to link compensation actually paid to the PEO and Other NEOs for 2025 to the Company’s performance. We may determine a different financial performance measure to be the most important financial performance measure in future years. A reconciliation of this Non-GAAP financial measure to its nearest GAAP comparable financial measure is included in Annex A.
(7)For a description of 2024 revenue, please refer to our 2025 Proxy Statement.
(8)For a description of 2023 revenue, please refer to our 2024 Proxy Statement.
(9)For a description of 2022 revenue, please refer to our 2023 Proxy Statement.
(10)For a description of 2021 revenue, please refer to our 2022 Proxy Statement.
Total compensation for the PEO and Other NEOs, as disclosed in the Summary Compensation Table, is comprised of salaries, annual cash incentives, and equity awards. The CAP calculation for each year includes changes in fair market value adjustments on vesting and outstanding equity awards during the year. The CAP adjustment fluctuates due to changes in the Company’s stock price in each of the years presented.
The following graph shows the relationship between the CAP to our PEO, average CAP to our Other NEOs, and Dexcom’s cumulative total shareholder return, or TSR, and the peer group’s cumulative TSR (S&P Health Care Equipment Select Industry index) for the fiscal years ended December 31, 2025, 2024, 2023, 2022, and 2021:
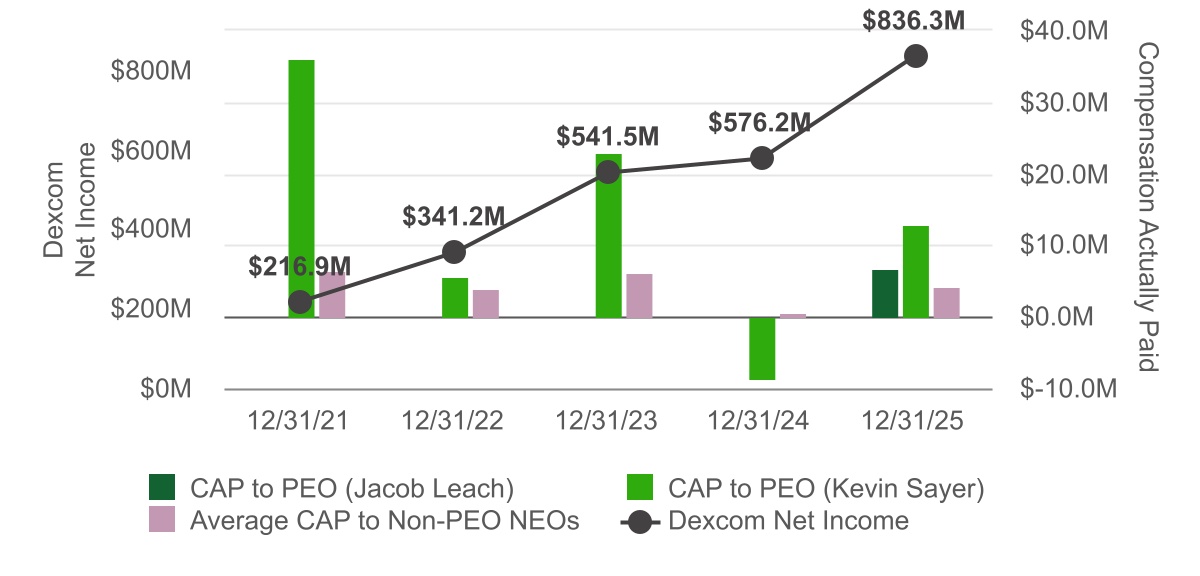
The following graph shows the relationship between the CAP to our PEO, the average CAP to our Other NEOs, and the Company’s net income for the fiscal years ended December 31, 2025, 2024, 2023, 2022, and 2021:
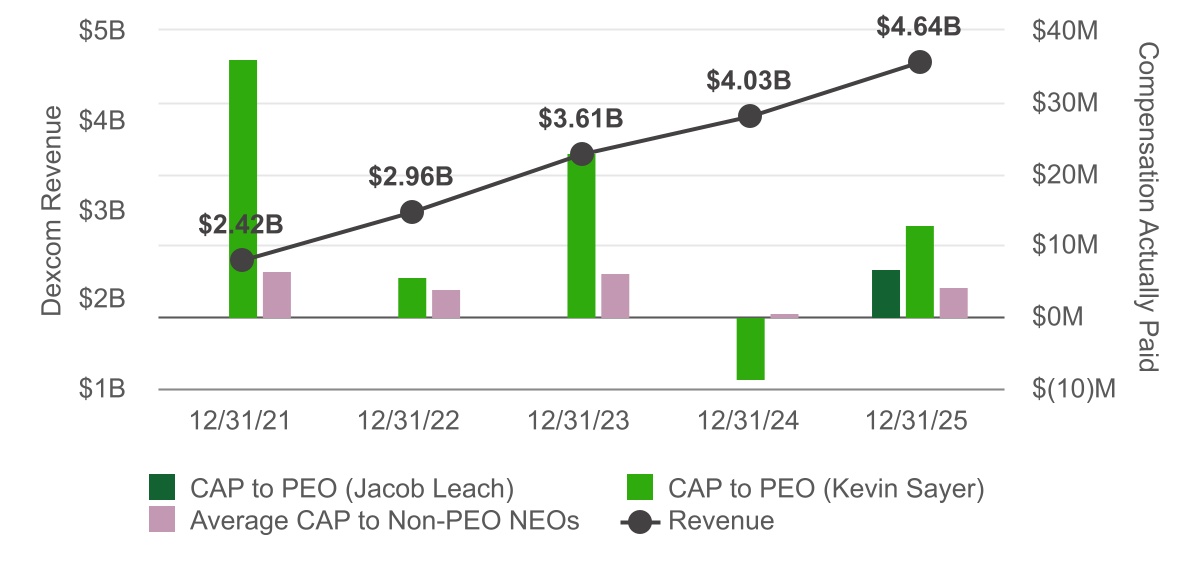
The following graph shows the relationship between the CAP to our PEO, the average CAP to our Other NEOs, and the Company’s Revenue for the fiscal years ended December 31, 2025, 2024, 2023, 2022, and 2021:
Tabular List of Financial Performance Measures
Dexcom considers the following to be the most important financial performance measures it used to link compensation actually paid to its NEOs, for 2025, to Company performance:
2025 Adjusted Revenue | Non-GAAP Operating Margin | Relative Total Shareholder Return | ||||||