Pay vs Performance Disclosure - USD ($)
Dec. 31, 2025
Dec. 31, 2024
Dec. 31, 2023
Dec. 31, 2022
Dec. 31, 2021
Value of Initial Fixed $100 Investment Based on: | ||||||||||||||||||||||||||||||||||||||||||||||||||
| Year (a) | Summary Compensation Table Total for PEO (1) $ (b) | Compensation Actually Paid to PEO (2)(3) $ (c) | Average Summary Compensation Table Total for Non-PEO Named Executive Officers (4) $ (d) | Average Compensation Actually Paid to Non-PEO Named Executive Officers (2)(3)(4) $ (e) | Total Shareholder Return $ (f) | Peer Group Total Shareholder Return (5) $ (g) | Net Income (Loss) (in millions) $ (h) | Net Product Revenue (6) (in millions) $ (i) | ||||||||||||||||||||||||||||||||||||||||||
| 2025 | 5,652,339 | 4,222,168 | 1,793,527 | 1,537,456 | 57.50 | 124.75 | (5.3) | 227.3 | ||||||||||||||||||||||||||||||||||||||||||
| 2024 | 4,260,114 | 5,569,779 | 1,428,373 | 1,388,958 | 67.86 | 93.49 | (69.4) | 152.2 | ||||||||||||||||||||||||||||||||||||||||||
| 2023 | 2,775,123 | 4,501,506 | 1,232,633 | 1,518,205 | 44.29 | 94.03 | (51.9) | 170.3 | ||||||||||||||||||||||||||||||||||||||||||
| 2022 | 3,072,539 | 707,639 | 1,372,956 | 623,367 | 20.61 | 89.90 | (94.2) | 177.1 | ||||||||||||||||||||||||||||||||||||||||||
| 2021 | 3,133,316 | 2,424,435 | 1,402,223 | 1,167,442 | 80.71 | 100.02 | (282.0) | 142.2 | ||||||||||||||||||||||||||||||||||||||||||
2025: Erik J. Ostrowski, Steven K. Burke, M.D., Nicholas P. Grund
2024: Erik J. Ostrowski, Ellen E. Snow, Steven K. Burke, M.D., Nicholas P. Grund, Michel Dahan
2023: David A. Spellman, Steven K. Burke, M.D., Michel Dahan, Nicole Hadas, Ellen Snow
2022: David A. Spellman, Steven K. Burke, M.D., Michel Dahan, Nicole R. Hadas
2021: David A. Spellman, Steven K. Burke, M.D., Michel Dahan, Dell Faulkingham
| 2025 | 2024 | 2023 | 2022 | 2021 | |||||||||||||||||||||||||||||||||||||||||||||||||||||||
| Adjustments | PEO | Average Non-PEO NEOs | PEO | Average Non-PEO NEOs | PEO | Average Non-PEO NEOs | PEO | Average Non-PEO NEOs | PEO | Average Non-PEO NEOs | |||||||||||||||||||||||||||||||||||||||||||||||||
| Total Compensation from Summary Compensation Table | $ | 5,652,339 | $ | 1,793,527 | $ | 4,260,114 | $ | 1,428,373 | $ | 2,775,123 | $ | 1,232,633 | $ | 3,072,539 | $ | 1,372,956 | $ | 3,133,316 | $ | 1,402,223 | |||||||||||||||||||||||||||||||||||||||
| Adjustments for Pension | |||||||||||||||||||||||||||||||||||||||||||||||||||||||||||
| Adjustment Summary Compensation Table Pension | $ | — | $ | — | $ | — | $ | — | $ | — | $ | — | $ | — | $ | — | $ | — | $ | — | |||||||||||||||||||||||||||||||||||||||
| Amount added for current year service cost | $ | — | $ | — | $ | — | $ | — | $ | — | $ | — | $ | — | $ | — | $ | — | $ | — | |||||||||||||||||||||||||||||||||||||||
| Amount added for prior service cost impacting current year | $ | — | $ | — | $ | — | $ | — | $ | — | $ | — | $ | — | $ | — | $ | — | $ | — | |||||||||||||||||||||||||||||||||||||||
| Total Adjustments for Pension | $ | — | $ | — | $ | — | $ | — | $ | — | $ | — | $ | — | $ | — | $ | — | $ | — | |||||||||||||||||||||||||||||||||||||||
| Adjustments for Equity Awards | |||||||||||||||||||||||||||||||||||||||||||||||||||||||||||
| (Subtract): Aggregate value for stock awards and option awards included in the Summary Compensation Table for the covered fiscal year | $ | (4,189,136) | $ | (999,491) | $ | (2,328,778) | $ | (781,080) | $ | (964,987) | $ | (458,963) | $ | (1,749,327) | $ | (585,304) | $ | (1,772,676) | $ | (600,887) | |||||||||||||||||||||||||||||||||||||||
| Add: Fair value at year end of awards granted during the covered fiscal year that were outstanding and unvested at the covered fiscal year end | $ | 2,758,591 | $ | 668,599 | $ | 2,598,318 | $ | 814,509 | $ | 2,019,961 | $ | 428,553 | $ | 444,435 | $ | 216,457 | $ | 1,126,591 | $ | 395,336 | |||||||||||||||||||||||||||||||||||||||
| 2025 | 2024 | 2023 | 2022 | 2021 | |||||||||||||||||||||||||||||||||||||||||||||||||||||||
| Adjustments | PEO | Average Non-PEO NEOs | PEO | Average Non-PEO NEOs | PEO | Average Non-PEO NEOs | PEO | Average Non-PEO NEOs | PEO | Average Non-PEO NEOs | |||||||||||||||||||||||||||||||||||||||||||||||||
| (Subtract): Year-over-year change in fair value at covered fiscal year end of awards granted in any prior fiscal year that were outstanding and unvested at the covered fiscal year end | $ | (566,748) | $ | (175,372) | $ | 786,724 | $ | 61,202 | $ | 491,497 | $ | 89,830 | $ | (811,280) | $ | (279,696) | $ | (282,800) | $ | (87,551) | |||||||||||||||||||||||||||||||||||||||
| Vesting date fair value of awards granted and vested during the covered fiscal year | $ | — | $ | — | $ | — | $ | — | $ | — | $ | — | $ | — | $ | — | $ | — | $ | — | |||||||||||||||||||||||||||||||||||||||
| Add (Subtract): Change as of the vesting date (from the end of the prior fiscal year) in fair value of awards granted in any prior fiscal year for which vesting conditions were satisfied during the covered fiscal year | $ | 567,122 | $ | 250,193 | $ | 253,401 | $ | 21,802 | $ | 179,912 | $ | 241,751 | $ | (248,729) | $ | (101,046) | $ | 220,005 | $ | 58,321 | |||||||||||||||||||||||||||||||||||||||
| (Subtract): Fair value at end of prior fiscal year of awards granted in any prior fiscal year that failed to meet the applicable vesting conditions during the covered fiscal year | $ | — | $ | — | $ | — | $ | (155,848) | $ | — | $ | (15,600) | $ | — | $ | — | $ | — | $ | — | |||||||||||||||||||||||||||||||||||||||
| Add: Dividends or other earnings paid on stock or option awards in the covered fiscal year prior to vesting if not otherwise included in the total compensation for the covered fiscal year | $ | — | $ | — | $ | — | $ | — | $ | — | $ | — | $ | — | $ | — | $ | — | $ | — | |||||||||||||||||||||||||||||||||||||||
| Total Adjustments for Equity Awards | $ | (1,430,171) | $ | (256,071) | $ | 1,309,665 | $ | (39,415) | $ | 1,726,383 | $ | 285,571 | $ | (2,364,900) | $ | (749,588) | $ | (708,881) | $ | (234,781) | |||||||||||||||||||||||||||||||||||||||
| Compensation Actually Paid (as calculated) | $ | 4,222,168 | $ | 1,537,456 | $ | 5,569,779 | $ | 1,388,958 | $ | 4,501,506 | $ | 1,518,205 | $ | 707,639 | $ | 623,367 | $ | 2,424,435 | $ | 1,167,442 | |||||||||||||||||||||||||||||||||||||||
| 2025 | 2024 | 2023 | 2022 | 2021 | |||||||||||||||||||||||||||||||||||||||||||||||||||||||
| Adjustments | PEO | Average Non-PEO NEOs | PEO | Average Non-PEO NEOs | PEO | Average Non-PEO NEOs | PEO | Average Non-PEO NEOs | PEO | Average Non-PEO NEOs | |||||||||||||||||||||||||||||||||||||||||||||||||
| Total Compensation from Summary Compensation Table | $ | 5,652,339 | $ | 1,793,527 | $ | 4,260,114 | $ | 1,428,373 | $ | 2,775,123 | $ | 1,232,633 | $ | 3,072,539 | $ | 1,372,956 | $ | 3,133,316 | $ | 1,402,223 | |||||||||||||||||||||||||||||||||||||||
| Adjustments for Pension | |||||||||||||||||||||||||||||||||||||||||||||||||||||||||||
| Adjustment Summary Compensation Table Pension | $ | — | $ | — | $ | — | $ | — | $ | — | $ | — | $ | — | $ | — | $ | — | $ | — | |||||||||||||||||||||||||||||||||||||||
| Amount added for current year service cost | $ | — | $ | — | $ | — | $ | — | $ | — | $ | — | $ | — | $ | — | $ | — | $ | — | |||||||||||||||||||||||||||||||||||||||
| Amount added for prior service cost impacting current year | $ | — | $ | — | $ | — | $ | — | $ | — | $ | — | $ | — | $ | — | $ | — | $ | — | |||||||||||||||||||||||||||||||||||||||
| Total Adjustments for Pension | $ | — | $ | — | $ | — | $ | — | $ | — | $ | — | $ | — | $ | — | $ | — | $ | — | |||||||||||||||||||||||||||||||||||||||
| Adjustments for Equity Awards | |||||||||||||||||||||||||||||||||||||||||||||||||||||||||||
| (Subtract): Aggregate value for stock awards and option awards included in the Summary Compensation Table for the covered fiscal year | $ | (4,189,136) | $ | (999,491) | $ | (2,328,778) | $ | (781,080) | $ | (964,987) | $ | (458,963) | $ | (1,749,327) | $ | (585,304) | $ | (1,772,676) | $ | (600,887) | |||||||||||||||||||||||||||||||||||||||
| Add: Fair value at year end of awards granted during the covered fiscal year that were outstanding and unvested at the covered fiscal year end | $ | 2,758,591 | $ | 668,599 | $ | 2,598,318 | $ | 814,509 | $ | 2,019,961 | $ | 428,553 | $ | 444,435 | $ | 216,457 | $ | 1,126,591 | $ | 395,336 | |||||||||||||||||||||||||||||||||||||||
| 2025 | 2024 | 2023 | 2022 | 2021 | |||||||||||||||||||||||||||||||||||||||||||||||||||||||
| Adjustments | PEO | Average Non-PEO NEOs | PEO | Average Non-PEO NEOs | PEO | Average Non-PEO NEOs | PEO | Average Non-PEO NEOs | PEO | Average Non-PEO NEOs | |||||||||||||||||||||||||||||||||||||||||||||||||
| (Subtract): Year-over-year change in fair value at covered fiscal year end of awards granted in any prior fiscal year that were outstanding and unvested at the covered fiscal year end | $ | (566,748) | $ | (175,372) | $ | 786,724 | $ | 61,202 | $ | 491,497 | $ | 89,830 | $ | (811,280) | $ | (279,696) | $ | (282,800) | $ | (87,551) | |||||||||||||||||||||||||||||||||||||||
| Vesting date fair value of awards granted and vested during the covered fiscal year | $ | — | $ | — | $ | — | $ | — | $ | — | $ | — | $ | — | $ | — | $ | — | $ | — | |||||||||||||||||||||||||||||||||||||||
| Add (Subtract): Change as of the vesting date (from the end of the prior fiscal year) in fair value of awards granted in any prior fiscal year for which vesting conditions were satisfied during the covered fiscal year | $ | 567,122 | $ | 250,193 | $ | 253,401 | $ | 21,802 | $ | 179,912 | $ | 241,751 | $ | (248,729) | $ | (101,046) | $ | 220,005 | $ | 58,321 | |||||||||||||||||||||||||||||||||||||||
| (Subtract): Fair value at end of prior fiscal year of awards granted in any prior fiscal year that failed to meet the applicable vesting conditions during the covered fiscal year | $ | — | $ | — | $ | — | $ | (155,848) | $ | — | $ | (15,600) | $ | — | $ | — | $ | — | $ | — | |||||||||||||||||||||||||||||||||||||||
| Add: Dividends or other earnings paid on stock or option awards in the covered fiscal year prior to vesting if not otherwise included in the total compensation for the covered fiscal year | $ | — | $ | — | $ | — | $ | — | $ | — | $ | — | $ | — | $ | — | $ | — | $ | — | |||||||||||||||||||||||||||||||||||||||
| Total Adjustments for Equity Awards | $ | (1,430,171) | $ | (256,071) | $ | 1,309,665 | $ | (39,415) | $ | 1,726,383 | $ | 285,571 | $ | (2,364,900) | $ | (749,588) | $ | (708,881) | $ | (234,781) | |||||||||||||||||||||||||||||||||||||||
| Compensation Actually Paid (as calculated) | $ | 4,222,168 | $ | 1,537,456 | $ | 5,569,779 | $ | 1,388,958 | $ | 4,501,506 | $ | 1,518,205 | $ | 707,639 | $ | 623,367 | $ | 2,424,435 | $ | 1,167,442 | |||||||||||||||||||||||||||||||||||||||
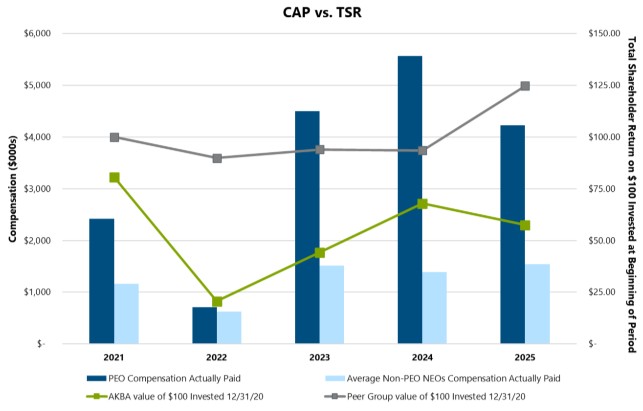
The following charts show the relationships over the past five years of the Compensation Actually Paid, or CAP, amounts for our PEO and Non-PEO NEOs as compared to our cumulative total shareholder return, or TSR, peer group TSR, Net Income (Loss) and Net Product Revenue, as well as the relationship between our TSR and our peer group TSR:
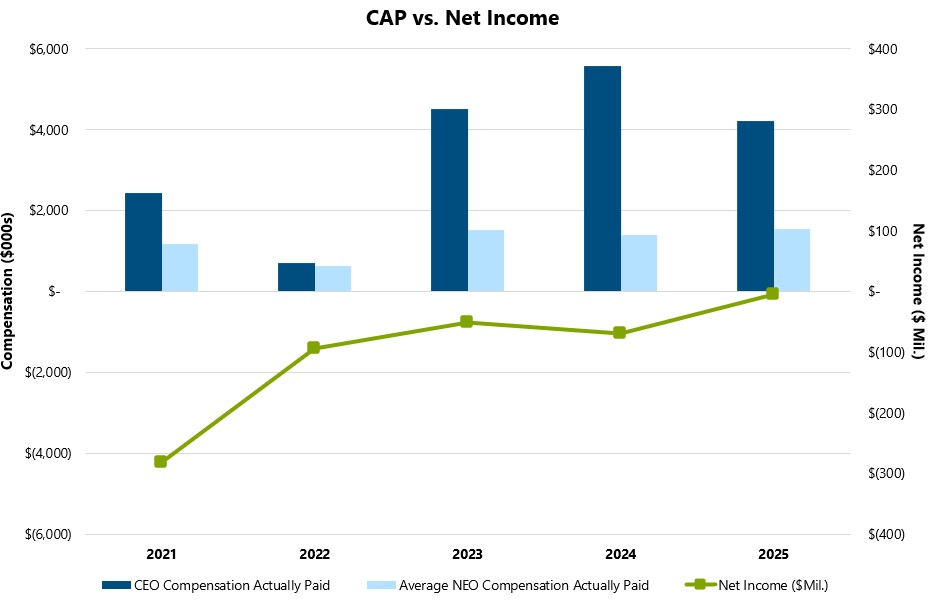
The following charts show the relationships over the past five years of the Compensation Actually Paid, or CAP, amounts for our PEO and Non-PEO NEOs as compared to our cumulative total shareholder return, or TSR, peer group TSR, Net Income (Loss) and Net Product Revenue, as well as the relationship between our TSR and our peer group TSR:
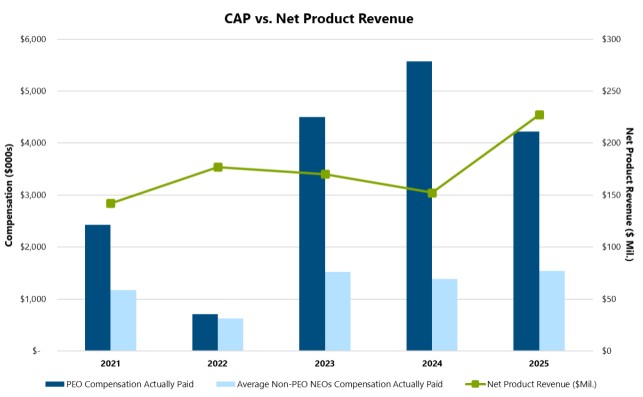
The following charts show the relationships over the past five years of the Compensation Actually Paid, or CAP, amounts for our PEO and Non-PEO NEOs as compared to our cumulative total shareholder return, or TSR, peer group TSR, Net Income (Loss) and Net Product Revenue, as well as the relationship between our TSR and our peer group TSR:
The following charts show the relationships over the past five years of the Compensation Actually Paid, or CAP, amounts for our PEO and Non-PEO NEOs as compared to our cumulative total shareholder return, or TSR, peer group TSR, Net Income (Loss) and Net Product Revenue, as well as the relationship between our TSR and our peer group TSR:
Net Product Revenue
Vafseo Lifecycle Management & Progressing Pipeline
Cash Management
Stock Price Performance
-Expected life of each stock option is based on the "simplified method" using an average of the remaining vest and remaining term, as of the vest/fiscal year end date.
-Exercise price is based on each grant date closing price and asset price is based on each vest/fiscal year end closing price.
-Risk free rate is based on the Treasury Constant Maturity rate closest to the remaining expected life as of the vest/fiscal year end date.
-Historical volatility is based on daily price history for each expected life (years) prior to each vest/fiscal year end date. Closing prices provided by S&P Capital IQ are adjusted for dividends and splits.
We determined net product revenue to be the most important financial performance measure used to link our performance to Compensation Actually Paid to our PEO and Non-PEO NEOs in 2025. This performance measure may not have been the most important financial performance measure for prior years, and we may determine a different financial performance measure to be the most important financial performance measure in future years.