Pay vs Performance Disclosure
Dec. 31, 2025
USD ($)
Dec. 31, 2024
USD ($)
Dec. 31, 2023
USD ($)
Dec. 31, 2022
USD ($)
Dec. 31, 2021
USD ($)
As required by Section 953(a) of the Dodd-Frank Wall Street Reform and Consumer Protection Act and Item 402(v) of Regulation S-K, we are providing the following information about the relationship between named executive officer Compensation Actually Paid (“CAP”) and certain financial performance of the Company. For further information concerning our compensation philosophy and how we align executive compensation with the Company’s performance, refer to the “Compensation Discussion and Analysis section of this proxy statement.
| Value of Initial Fixed $100 Investment Based on: | ||||||||||||||||||||||||||||||||||||||||||||||||||
Year(1) | Summary Compensation Table Total for CEO(2) | Compensation Actually Paid to CEO(3)(4) | Average Summary Compensation Table Total for Non-CEO NEOs(5) | Average Compensation Actually Paid to Non-CEO NEOs(4)(6) | Total Shareholder Return(7) | Peer Group Total Shareholder Return(7)(8) | Net Income(9) (Millions) | ROIC(10) | ||||||||||||||||||||||||||||||||||||||||||
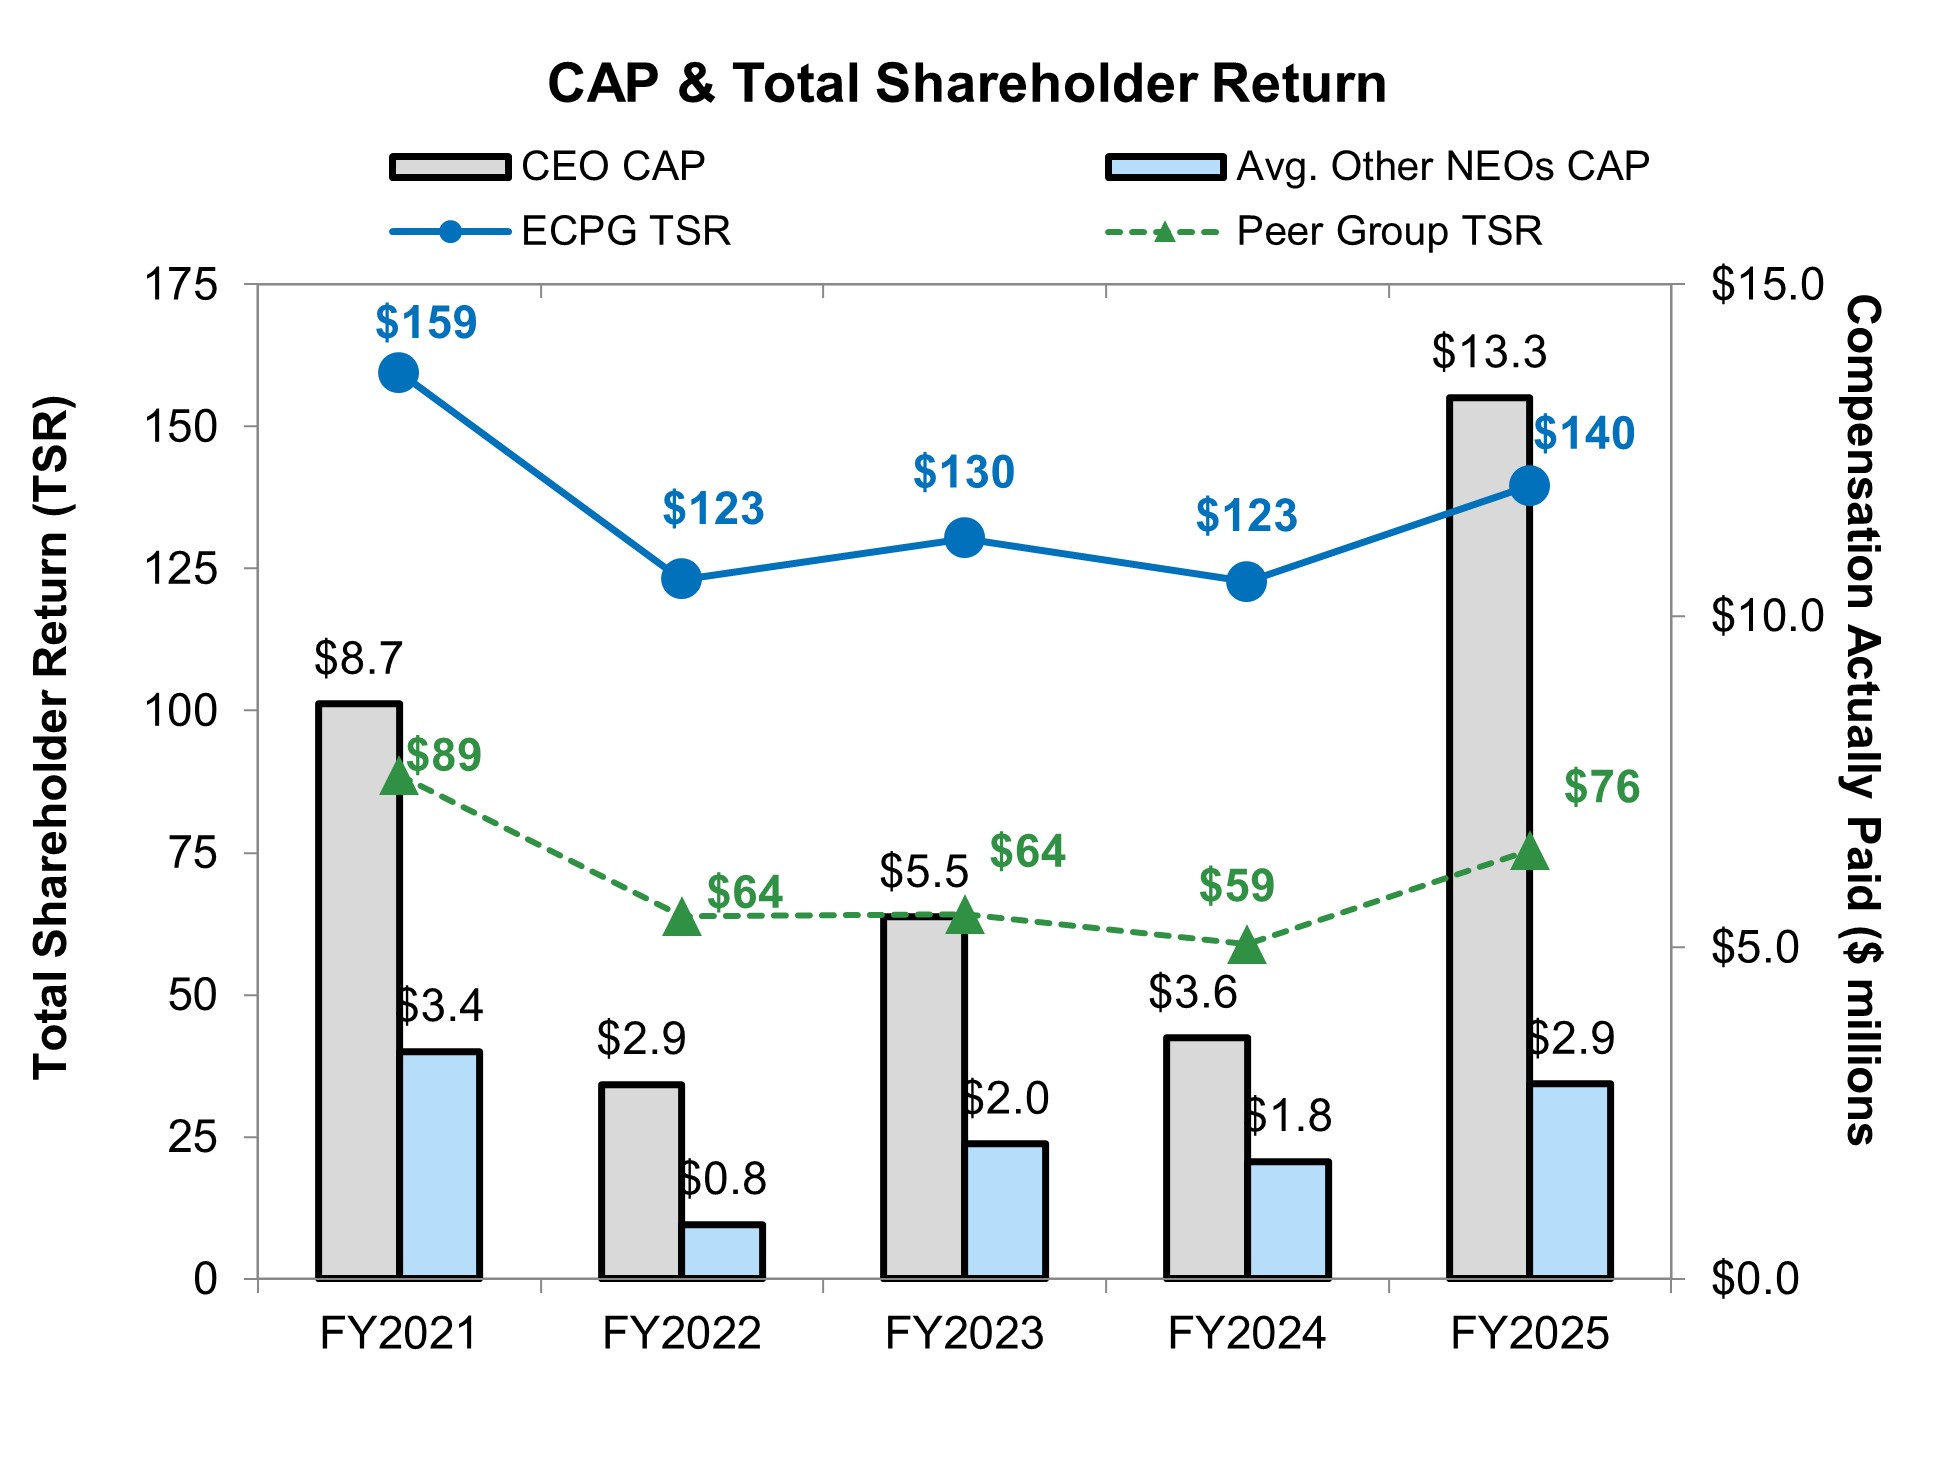
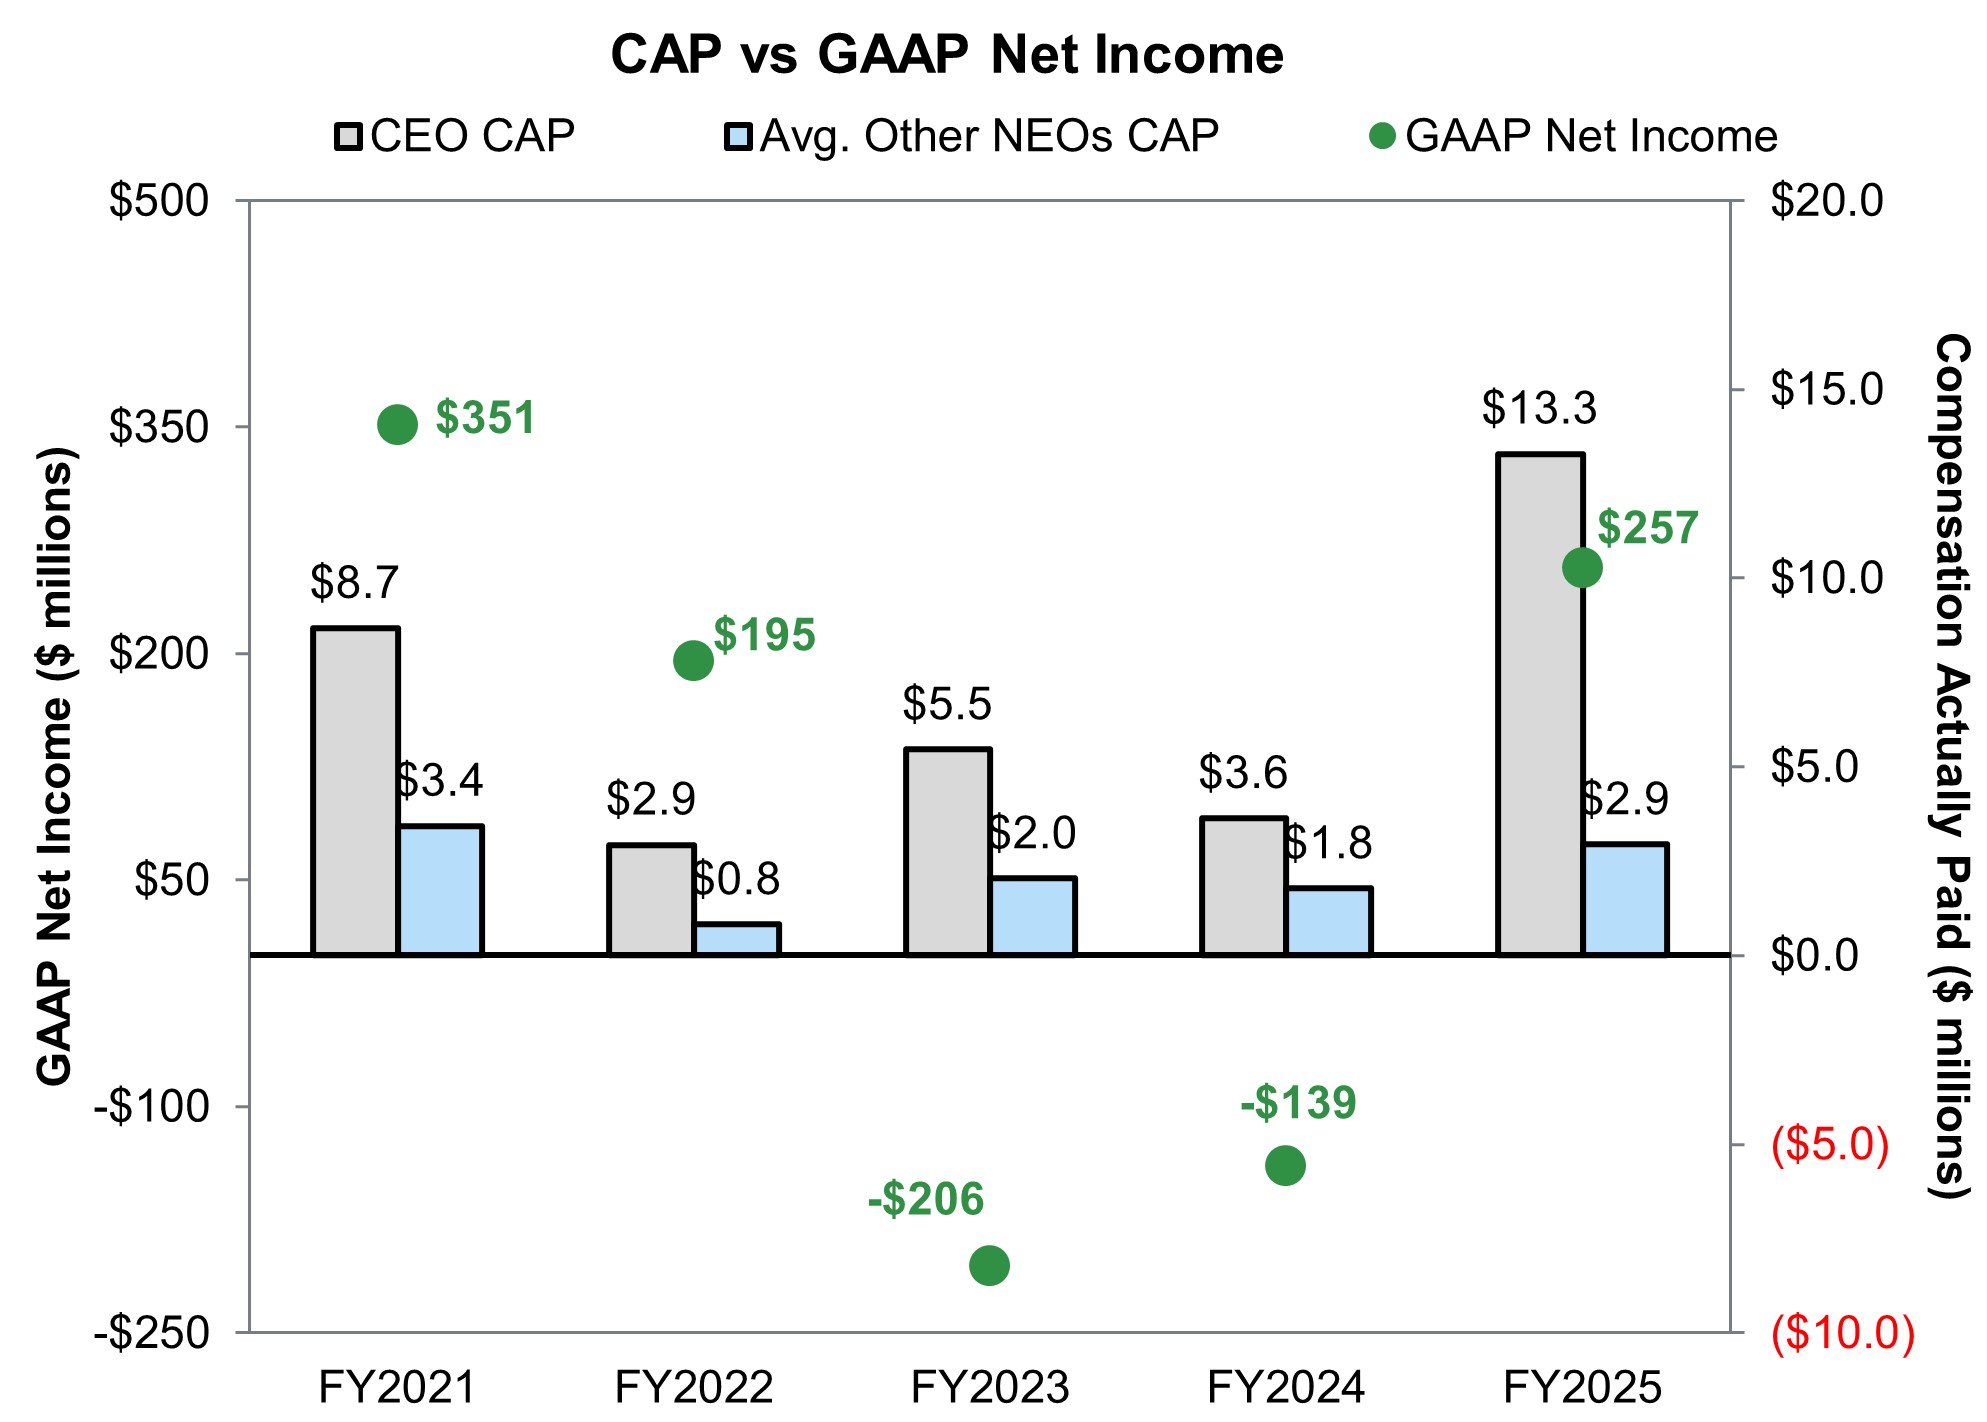
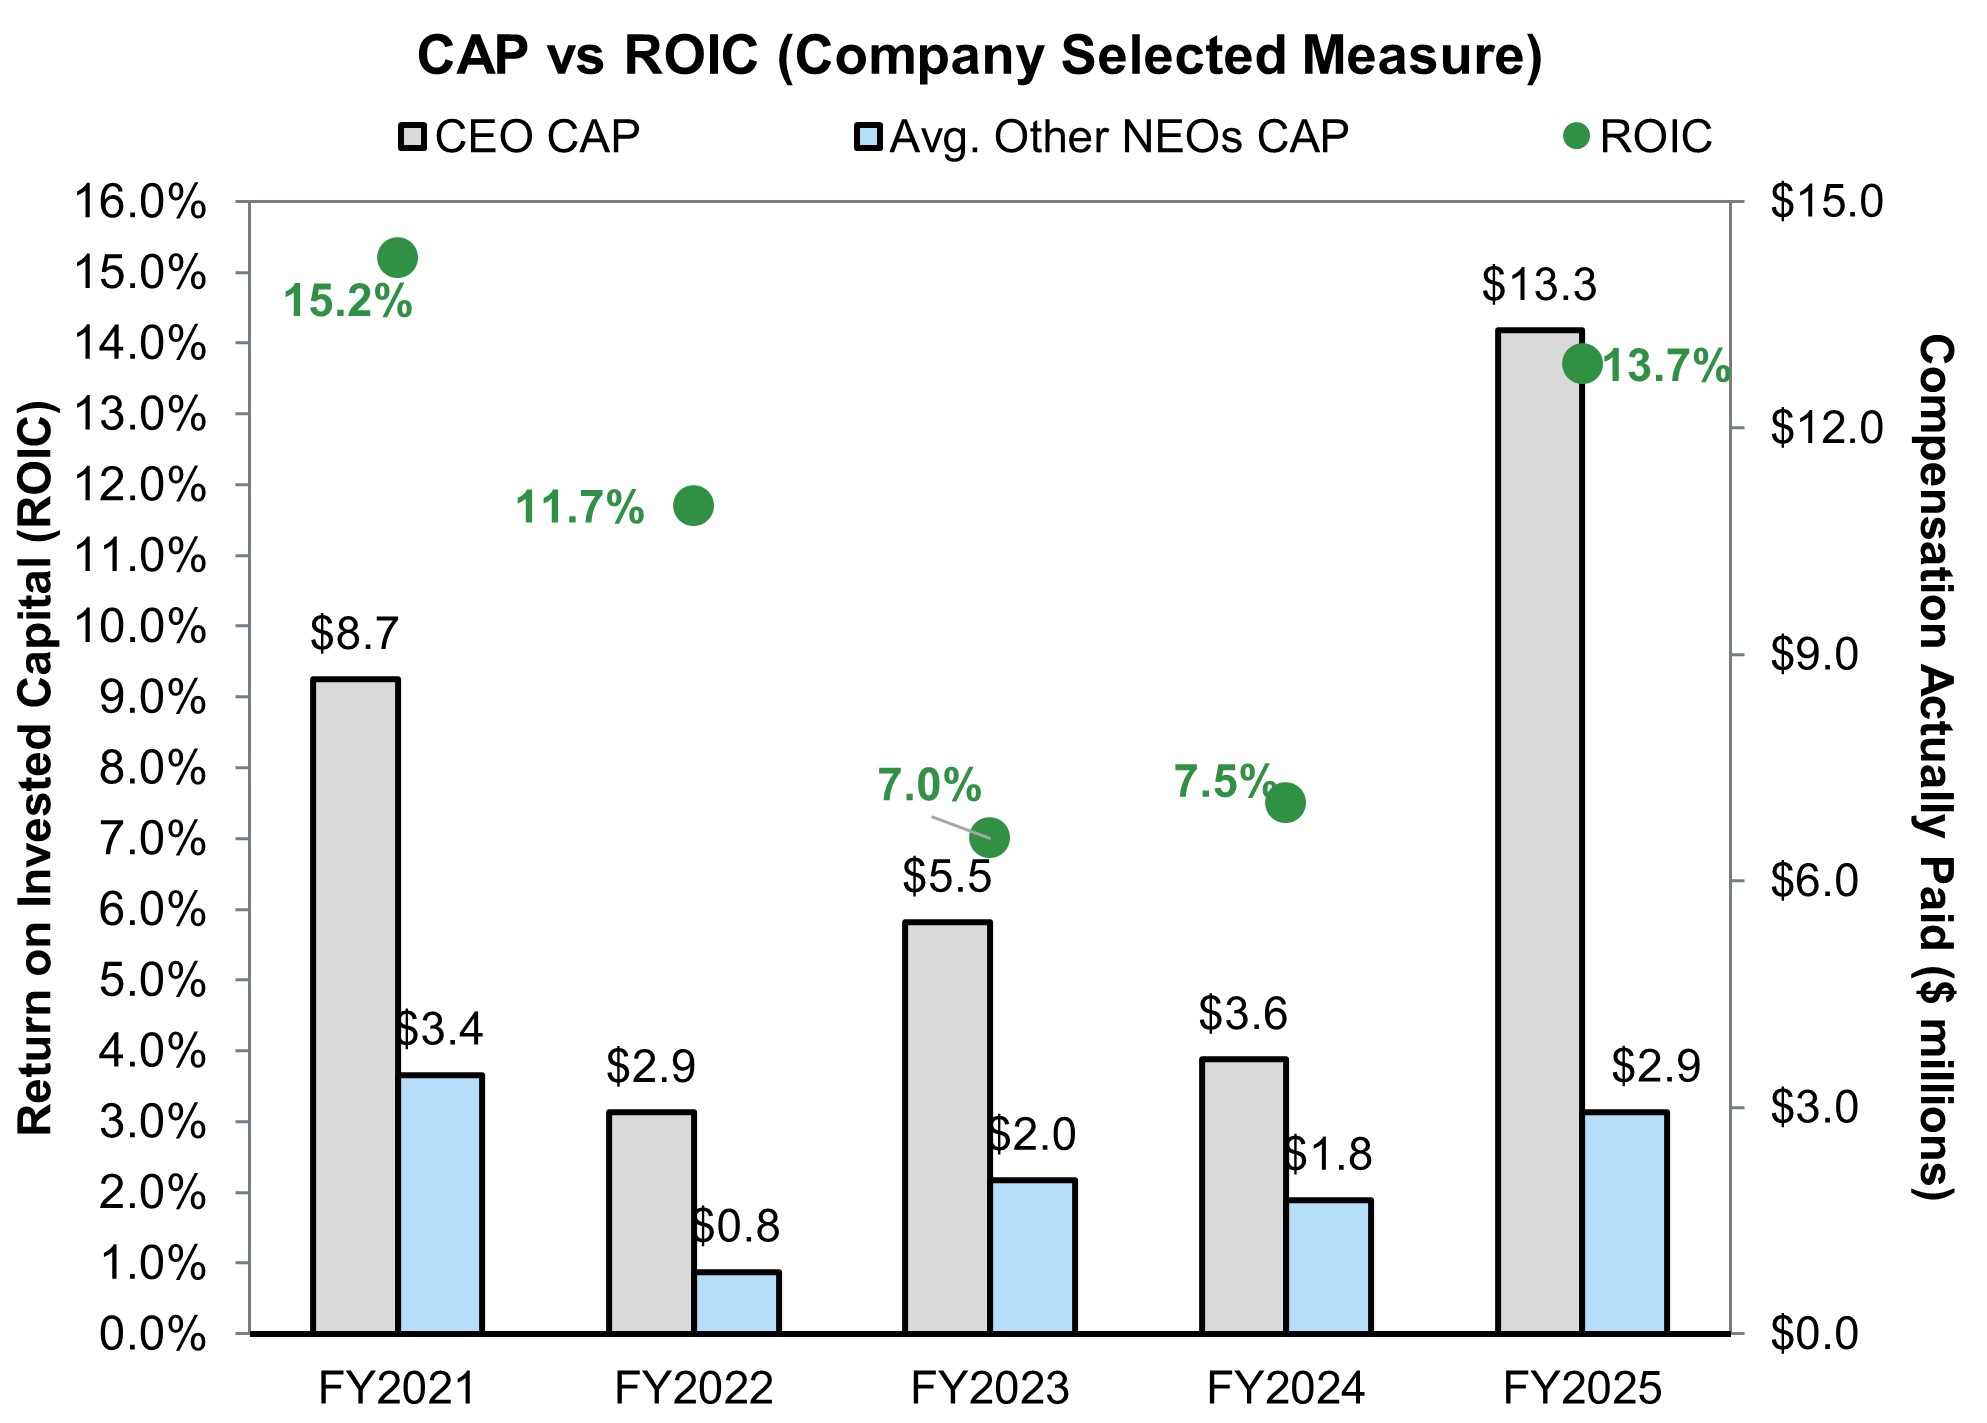
2025 | $8,106,453 | $13,293,562 | $2,142,861 | $2,940,110 | $140 | $76 | $257 | 13.7 | % | |||||||||||||||||||||||||||||||||||||||||
2024 | $5,335,337 | $3,635,475 | $2,168,630 | $1,773,570 | $123 | $59 | ($139) | 7.5 | % | |||||||||||||||||||||||||||||||||||||||||
2023 | $5,023,957 | $5,456,509 | $1,961,809 | $2,036,585 | $130 | $64 | ($206) | 7.0 | % | |||||||||||||||||||||||||||||||||||||||||
| 2022 | $5,101,918 | $2,935,179 | $1,646,198 | $822,005 | $123 | $64 | $195 | 11.7 | % | |||||||||||||||||||||||||||||||||||||||||
| 2021 | $4,600,775 | $8,670,303 | $2,006,061 | $3,431,675 | $159 | $89 | $351 | 15.2 | % | |||||||||||||||||||||||||||||||||||||||||
(1)Mr. Masih was our CEO for each of the five fiscal years included in the table. The following officers are included in the Non-CEO NEO group:
| Year | Non-CEO NEOs | |||||||
| 2025 | Tomas Hernanz, Ryan B. Bell, Andrew E. Asch, John Yung, Jonathan C. Clark | |||||||
| 2024 | Jonathan C. Clark, Ryan B. Bell, Andrew E. Asch, John Yung | |||||||
| 2023 | Jonathan C. Clark, Ryan B. Bell, Craig A. Buick, Andrew E. Asch, John Yung | |||||||
| 2022 | Jonathan C. Clark, Ryan B. Bell, Craig A. Buick, Andrew E. Asch, Greg L. Call | |||||||
| 2021 | Jonathan C. Clark, Ryan B. Bell, Craig A. Buick, Greg L. Call | |||||||
(2)Reflects compensation amounts reported in the “Total” column of the Summary Compensation Table (“SCT”) for the CEO for the respective years shown.
(3)Amounts reflect the amounts reported in the “Summary Compensation Table Total for CEO” column adjusted as set forth in the table below, as determined in accordance with SEC rules. Amounts do not reflect the actual amount of compensation earned by or paid to our CEO during the year. For information regarding the decisions made by the Compensation Committee in regards to the CEO’s compensation, please see the Compensation Discussion and Analysis section.
2025 | |||||||||||
| SCT Total Compensation | $8,106,453 | ||||||||||
| Less: Amounts Reported under the “Stock Awards” and “Option Awards” Columns in the SCT for the Applicable Fiscal Year | $4,863,999 | ||||||||||
| Increase based on ASC 718 Fair Value of Awards Granted during Applicable FY that Remain Unvested as of Applicable FY End, determined as of Applicable FY End | $9,074,310 | ||||||||||
| Increase based on ASC 718 Fair Value of Awards Granted during Applicable FY that Vested during Applicable FY, determined as of Vesting Date | $0 | ||||||||||
| Plus: Change in Fair Value of Outstanding Unvested Stock and Option Awards from Prior Years | $1,430,738 | ||||||||||
| Plus: Change in Fair Value of Stock and Option Awards from Prior Years that Vested in the Applicable Fiscal Year | ($453,940) | ||||||||||
| Less: Fair Value of Stock and Option Awards Granted during a Prior Fiscal Year that were Forfeited during the Applicable Fiscal Year, determined as of the Prior Fiscal Year End | $0 | ||||||||||
| Less: Change in Actuarial Present Values reported under the “Change in Pension Value and Nonqualified Deferred Compensation Earnings” Column of the SCT for Applicable Fiscal Year | $0 | ||||||||||
| Increase based on Dividends or Other Earnings Paid during Applicable FY prior to Vesting Date | $0 | ||||||||||
| Increase based on Incremental Fair Value of Options/SARs Modified during Applicable FY | $0 | ||||||||||
| Plus: Aggregate Service Cost and Prior Service Cost for Pension Plans | $0 | ||||||||||
| Compensation Actually Paid | $13,293,562 | ||||||||||
(4)Fair value or change in fair value, as applicable, of equity awards in the “Compensation Actually Paid” columns was determined by reference to (1) for RSU awards, closing price of the Company’s common stock on applicable year-end dates or, in the case of vesting dates, the closing price per share on the applicable vesting date(s), (2) for PSU awards (except TSR PSU awards), the same valuation methodology as RSU awards above except year-end and vesting date values are multiplied by the probability of achievement or actual results, as applicable, as of each such date, (3) for TSR PSU awards, the fair value calculated by a Monte Carlo simulation model as of the applicable year-end date(s) and (4) for Stock Options, a Black-Scholes option-pricing model as of the applicable year-end or vesting date(s), determined based on the same methodology as used to determine grant date fair values but using the closing Company stock price on the applicable revaluation date as the current market price as of the revaluation date, and in all cases based on expected term, volatility, dividend rates and risk free rates determined as of the revaluation date. For additional information, see the “Stock-Based Compensation” footnote in the Notes to the Consolidated Financial Statements included in our Annual Report for the year ended December 31, 2025.
(5)Reflects average of the amounts reported in the “Total” column of the SCT for the Non-CEO NEOs for the respective years shown.
(6)Amounts reflect the amounts reported in the “Average Summary Compensation Table Total for Non-CEO NEOs” column adjusted as set forth in the table below, as determined in accordance with SEC rules. Amounts do not reflect the actual amount of compensation earned by or paid to our Non-CEO NEOs during the applicable year. For information regarding the decisions made by the Compensation Committee in regards to the Non-CEO NEOs compensation for each fiscal year, please see the Compensation Discussion and Analysis sections of the proxy statements reporting pay for the fiscal years covered.
2025 | |||||||||||
| SCT Total Compensation | $2,142,861 | ||||||||||
| Less: Amounts Reported under the “Stock Awards” and “Option Award” Columns in SCT for the Applicable Fiscal Year | $714,620 | ||||||||||
| Increase based on ASC 718 Fair Value of Awards Granted during Applicable FY that Remain Unvested as of Applicable FY End, determined as of Applicable FY End | $1,305,284 | ||||||||||
| Increase based on ASC 718 Fair Value of Awards Granted during Applicable FY that Vested during Applicable FY, determined as of Vesting Date | $0 | ||||||||||
| Plus: Change in Fair Value of Outstanding Unvested Stock and Option Awards from Prior Years | $314,240 | ||||||||||
| Plus: Change in Fair Value of Stock and Option Awards from Prior Years that Vested in the Covered Year | ($107,656) | ||||||||||
| Less: Fair Value of Stock and Option Awards Granted during a Prior Fiscal Year that were Forfeited during the Applicable Fiscal Year, determined as of the Prior Fiscal Year End | 0 | ||||||||||
| Less: Change in Actuarial Present Values reported under the “Change in Pension Value and Nonqualified Deferred Compensation Earnings” Column of the SCT for Applicable Fiscal Year | 0 | ||||||||||
| Increase based on Dividends or Other Earnings Paid during Applicable FY prior to Vesting Date | 0 | ||||||||||
| Increase based on Incremental Fair Value of Options/SARs Modified during Applicable FY | 0 | ||||||||||
| Plus: Aggregate Service Cost and Prior Service Cost for Pension Plans | $0 | ||||||||||
| Compensation Actually Paid | $2,940,110 | ||||||||||
Jonathan C. Clark, Ryan B. Bell, Andrew E. Asch, John Yung
Jonathan C. Clark, Ryan B. Bell, Craig A. Buick, Andrew E. Asch, John Yung
2025 | |||||||||||
| SCT Total Compensation | $8,106,453 | ||||||||||
| Less: Amounts Reported under the “Stock Awards” and “Option Awards” Columns in the SCT for the Applicable Fiscal Year | $4,863,999 | ||||||||||
| Increase based on ASC 718 Fair Value of Awards Granted during Applicable FY that Remain Unvested as of Applicable FY End, determined as of Applicable FY End | $9,074,310 | ||||||||||
| Increase based on ASC 718 Fair Value of Awards Granted during Applicable FY that Vested during Applicable FY, determined as of Vesting Date | $0 | ||||||||||
| Plus: Change in Fair Value of Outstanding Unvested Stock and Option Awards from Prior Years | $1,430,738 | ||||||||||
| Plus: Change in Fair Value of Stock and Option Awards from Prior Years that Vested in the Applicable Fiscal Year | ($453,940) | ||||||||||
| Less: Fair Value of Stock and Option Awards Granted during a Prior Fiscal Year that were Forfeited during the Applicable Fiscal Year, determined as of the Prior Fiscal Year End | $0 | ||||||||||
| Less: Change in Actuarial Present Values reported under the “Change in Pension Value and Nonqualified Deferred Compensation Earnings” Column of the SCT for Applicable Fiscal Year | $0 | ||||||||||
| Increase based on Dividends or Other Earnings Paid during Applicable FY prior to Vesting Date | $0 | ||||||||||
| Increase based on Incremental Fair Value of Options/SARs Modified during Applicable FY | $0 | ||||||||||
| Plus: Aggregate Service Cost and Prior Service Cost for Pension Plans | $0 | ||||||||||
| Compensation Actually Paid | $13,293,562 | ||||||||||
2025 | |||||||||||
| SCT Total Compensation | $2,142,861 | ||||||||||
| Less: Amounts Reported under the “Stock Awards” and “Option Award” Columns in SCT for the Applicable Fiscal Year | $714,620 | ||||||||||
| Increase based on ASC 718 Fair Value of Awards Granted during Applicable FY that Remain Unvested as of Applicable FY End, determined as of Applicable FY End | $1,305,284 | ||||||||||
| Increase based on ASC 718 Fair Value of Awards Granted during Applicable FY that Vested during Applicable FY, determined as of Vesting Date | $0 | ||||||||||
| Plus: Change in Fair Value of Outstanding Unvested Stock and Option Awards from Prior Years | $314,240 | ||||||||||
| Plus: Change in Fair Value of Stock and Option Awards from Prior Years that Vested in the Covered Year | ($107,656) | ||||||||||
| Less: Fair Value of Stock and Option Awards Granted during a Prior Fiscal Year that were Forfeited during the Applicable Fiscal Year, determined as of the Prior Fiscal Year End | 0 | ||||||||||
| Less: Change in Actuarial Present Values reported under the “Change in Pension Value and Nonqualified Deferred Compensation Earnings” Column of the SCT for Applicable Fiscal Year | 0 | ||||||||||
| Increase based on Dividends or Other Earnings Paid during Applicable FY prior to Vesting Date | 0 | ||||||||||
| Increase based on Incremental Fair Value of Options/SARs Modified during Applicable FY | 0 | ||||||||||
| Plus: Aggregate Service Cost and Prior Service Cost for Pension Plans | $0 | ||||||||||
| Compensation Actually Paid | $2,940,110 | ||||||||||
The table below lists what we consider to be the most important financial performance measures used to link CAP to NEOs for the year ended December 31, 2025, to company performance. See the Compensation Discussion and Analysis section of this proxy statement for more information regarding the use of these performance metrics in our executive compensation program.
| Performance Measures | ||
| ROIC | ||
| Relative Total Shareholder Return | ||
Adjusted EBITDA | ||