Pay vs Performance Disclosure - USD ($)
Apr. 25, 2022
Dec. 31, 2022
Dec. 31, 2025
Dec. 31, 2024
Dec. 31, 2023
Dec. 31, 2022
Dec. 31, 2021
Pay vs. Performance
Year | Summary Compensation Table Total for First PEO(1) | Summary Compensation Table Total for Second PEO(1) | Compensation Actually Paid to First PEO(1)(2) | Compensation Actually Paid to Second PEO(1)(2) | Average Summary Compensation Table Total for Non-PEO NEOs(3) | Average Compensation Actually Paid to Non-PEO NEOs(2)(3) | Value of Initial Fixed $100 Investment Based On:(4) | Net Income ($ Thousands) | Adjusted EBITDA ($ Thousands) | |||||||||||||||||||||||
Total Shareholder Return | Peer Group Total Shareholder Return(5) | |||||||||||||||||||||||||||||||
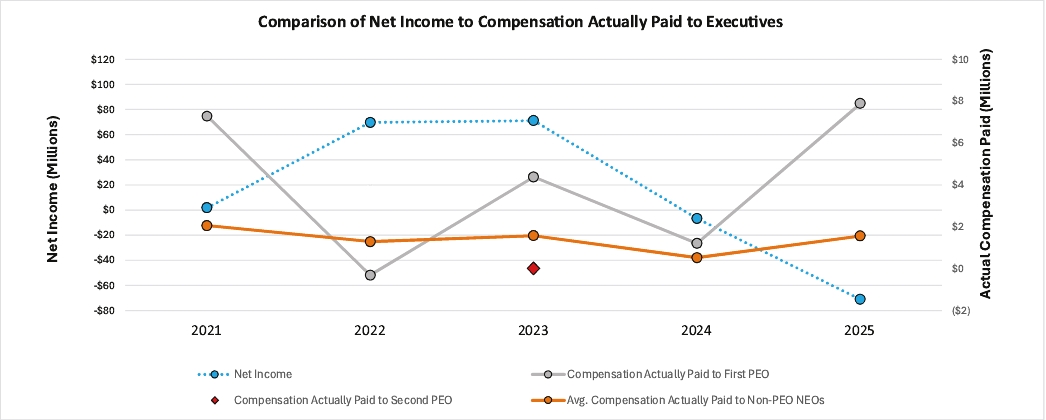
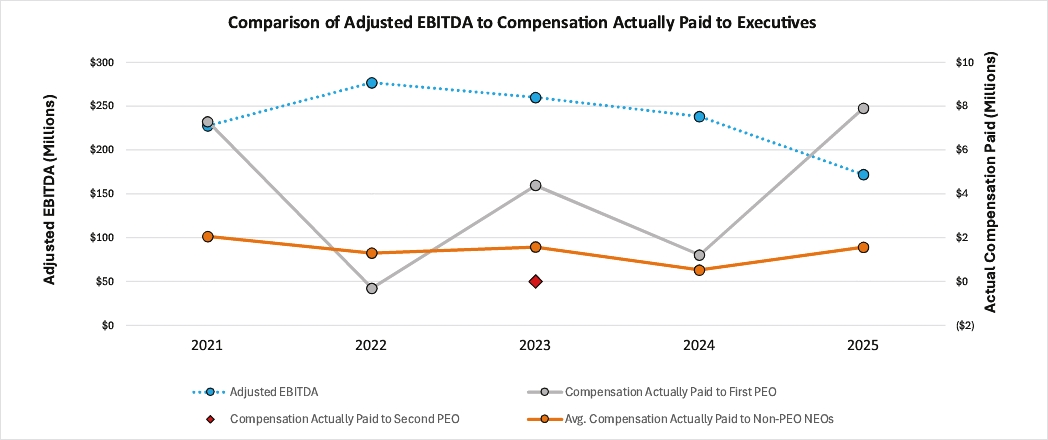
2025 | $4,992,440 | N/A | $7,909,365 | N/A | $1,406,253 | $1,566,083 | $84 | $103 | ($71,100) | $172,000(6) | ||||||||||||||||||||||
2024 | $4,092,116 | N/A | $1,213,158 | N/A | $1,243,731 | $524,539 | $66 | $105 | ($6,700) | $238,200 | ||||||||||||||||||||||
2023 | $4,669,022 | N/A | $4,385,674 | N/A | $1,553,253 | $1,574,071 | $85 | $108 | $71,200 | $259,900 | ||||||||||||||||||||||
2022 | $8,958,314 | $4,378,660 | ($306,892) | $3,755,039 | $2,232,721 | $1,293,593 | $77 | $97 | $69,800 | $276,800 | ||||||||||||||||||||||
2021 | $8,953,055 | N/A | $7,292,777 | N/A | $2,421,693 | $2,056,217 | $89 | $117 | $1,800 | $227,600 | ||||||||||||||||||||||
(1) | The Principal Executive Officer (“PEO”) for 2023 ,2024, and 2025 was Kurt J. Bitting, Chief Executive Officer and he is referenced as the “First PEO” for 2023, 2024, 2025 in the charts in this section. The PEO for 2021, and 2022 was Belgacem Chariag, former Chairman, President, and Chief Executive Officer (whose employment was terminated without cause by the Board on April 25, 2022), and he is referenced as the “First PEO” for 2021 and 2022 in the charts in this section. Mr. Bitting became our Chief Executive Officer effective April 25, 2022 and is referenced as the “Second PEO” for 2022 in the charts in this section. |
(2) | Compensation Actually Paid reflects the exclusions and inclusions of certain amounts for the PEO and the Non-PEO NEOs as set forth below. Equity values are calculated in accordance with FASB ASC Topic 718. |
(3) | The non-PEO NEOs for 2021 through 2025 and their respective titles during such year were as follows: |
2021 | 2022 | 2023 | 2024 | 2025 | ||||||||||
Thomas Schneberger, Vice President and President – Catalyst Technologies | Michael Feehan, Vice President and Chief Financial Officer | Michael Feehan, Vice President and Chief Financial Officer | Michael Feehan, Vice President and Chief Financial Officer | Michael Feehan, Vice President and Chief Financial Officer | ||||||||||
Kurt Bitting, Vice President and President – Ecoservices | Joseph S. Koscinski, Vice President, General Counsel and Secretary | Joseph S. Koscinski, Chief Administrative Officer, Vice President, General Counsel and Secretary | Joseph S. Koscinski, Chief Administrative Officer, Vice President, General Counsel and Secretary | Joseph S. Koscinski, Chief Administrative Officer, Vice President, General Counsel and Secretary | ||||||||||
Michael Feehan, Vice President and Chief Financial Officer | George L. Vann, Jr., Vice President and President – Ecoservices | George L. Vann, Jr., Vice President and President – Ecoservices | George L. Vann, Jr., Vice President and President – Ecoservices | George L. Vann, Jr., Former Vice President and President – Ecoservices | ||||||||||
Joseph S. Koscinski, Vice President, General Counsel and Secretary | Paul Whittleston, Vice President – Strategy and Business Development | Paul Whittleston, Vice President and President – Catalyst Technologies | Paul Whittleston, Vice President and President – Catalyst Technologies | Paul Whittleston, Former Vice President and President – Advanced Materials and Catalysts | ||||||||||
Albert F. Beninati, Jr., Vice President and President – Performance Chemicals | Thomas Schneberger, President of Ecovyst and President – Catalyst Technologies | |||||||||||||
Michael Crews, Executive Vice President and Chief Financial Officer | ||||||||||||||
(4) | For purposes of calculating the cumulative total shareholder return, the measurement period is the market close on the last trading day before fiscal year 2021, through and including the end of the fiscal year for which cumulative total shareholder return is being calculated. TSR and peer group TSR has been calculated based on a fixed investment of one hundred dollars at the beginning of the measurement point. TSR Values for 2022, and 2021 have been revised from those shown in the first Pay-Versus-Performance table in our Definitive Proxy Statement filed in 2023 to reflect a correction in the calculation of TSR. |
(5) | The peer group for 2025 used in this calculation is defined as the “2025 Compensation Peer Group” on page 36. The adjustments to the peer group for 2025 approved in October 2024 were the removal of Chase Corporation, GCP Applied Technologies and Livent following their acquisition, the removal of NN, Inc. and CSW Industrials, Inc. given limited industry relevance, and the addition of AirBoss of America Corp. The returns of each issuer of the group were weighted according to the respective issuers’ stock market capitalization at the beginning of the period for which a return is indicated. |
(6) | The amount represents results from continuing operations. |
Year | Summary Compensation Table Total for First PEO | Exclusion of Stock Awards and Option Awards for First PEO | Inclusion of Equity Values for First PEO | Compensation Actually Paid to First PEO | ||||||||||
(a) | (b) | (c) | (d) | |||||||||||
2025 | $4,992,440 | ($3,347,752) | $6,264,677 | $7,909,365 | ||||||||||
2024 | $4,092,116 | ($2,761,375) | ($117,583) | $1,213,158 | ||||||||||
2023 | $4,669,022 | ($3,481,553) | $3,198,205 | $4,385,674 | ||||||||||
2022 | $8,958,314 | ($5,869,774) | ($3,395,432) | ($306,892) | ||||||||||
2021 | $8,953,055 | ($6,000,007) | $4,339,729 | $7,292,777 | ||||||||||
Year | Summary Compensation Table Total for Second PEO | Exclusion of Stock Awards and Option Awards for Second PEO | Inclusion of Equity Values for Second PEO | Compensation Actually Paid to Second PEO | ||||||||||
(a) | (b) | (c) | (d) | |||||||||||
2022 | $4,378,660 | ($2,670,440) | $2,046,819 | $3,755,039 | ||||||||||
Year | Average Summary Compensation Table Total for Non-PEO NEOs | Average Exclusion of Stock Awards and Option Awards for Non-PEO NEOs | Average Inclusion of Equity Values for Non-PEO NEOs | Average Compensation Actually Paid to Non-PEO NEOs(1) | ||||||||||
(a) | (b) | (c) | (d) | |||||||||||
2025 | $1,406,253 | ($633,995) | $793,826 | $1,566,083 | ||||||||||
2024 | $1,243,731 | ($616,794) | ($102,398) | $524,539 | ||||||||||
2023 | $1,553,253 | ($983,040) | $1,003,858 | $1,574,071 | ||||||||||
2022 | $2,232,721 | ($1,498,620) | $559,493 | $1,293,593 | ||||||||||
2021 | $2,421,693 | ($1,333,333) | $967,858 | $2,056,217 | ||||||||||
(1) | The calculation used for Compensation Actually Paid is columns (a) + (b) + (c) = (d). Instances in which the figure in column (d) does not align with the total sum of columns (a), (b) and (c) is the result of rounding the other columns to the nearest whole dollar. |
The amounts in the Inclusion of Equity Values in the tables above are derived from the amounts set forth in the following tables:
Year | Year-End Fair Value of Equity Awards Granted During Year that Remained Unvested as of Last Day of Year for First PEO | Change in Fair Value from Last Day of Prior Year to Last Day of Year of Unvested Equity Awards for First PEO | Vesting-Date Fair Value of Equity Awards Granted During Year that Vested During Year for First PEO | Change in Fair Value from Last Day of Prior Year to Vesting Date of Unvested Equity Awards that Vested During Year for First PEO | Fair Value at Last Day of Prior Year of Equity Awards Forfeited During Year for First PEO | Value of Dividends or Other Earnings Paid on Equity Awards not Otherwise Included for First PEO | Total Inclusion of Equity Values for First PEO(1) | ||||||||||||||||
(a) | (b) | (c) | (d) | (e) | (f) | (g) | |||||||||||||||||
2025 | $4,556,797 | $2,072,263 | — | $11,283 | ($375,666) | — | $6,264,677 | ||||||||||||||||
2024 | $1,449,715 | ($1,317,798) | — | ($38,816) | ($210,685) | — | ($117,583) | ||||||||||||||||
2023 | $3,046,036 | ($119,368) | — | $433,439 | ($161,902) | — | $3,198,205 | ||||||||||||||||
2022 | $52,192 | ($254,446) | — | $34,177 | ($3,227,355) | — | ($3,395,432) | ||||||||||||||||
2021 | $5,150,840 | ($858,578) | — | $47,466 | — | — | $4,339,729 | ||||||||||||||||
Year | Year-End Fair Value of Equity Awards Granted During Year that Remained Unvested as of Last Day of Year for Second PEO | Change in Fair Value from Last Day of Prior Year to Last Day of Year of Unvested Equity Awards for Second PEO | Vesting-Date Fair Value of Equity Awards Granted During Year that Vested During Year for Second PEO | Change in Fair Value from Last Day of Prior Year to Vesting Date of Unvested Equity Awards that Vested During Year for Second PEO | Fair Value at Last Day of Prior Year of Equity Awards Forfeited During Year for Second PEO | Value of Dividends or Other Earnings Paid on Equity Awards not Otherwise Included for Second PEO | Total Inclusion of Equity Values for Second PEO(1) | ||||||||||||||||
(a) | (b) | (c) | (d) | (e) | (f) | (g) | |||||||||||||||||
2022 | $2,199,740 | ($159,076) | — | $6,156 | — | — | $2,046,819 | ||||||||||||||||
Year | Average Year-End Fair Value of Equity Awards Granted During Year that Remained Unvested as of Last Day of Year for Non-PEO NEOs | Average Change in Fair Value from Last Day of Prior Year to Last Day of Year of Unvested Equity Awards for Non-PEO NEOs | Average Vesting-Date Fair Value of Equity Awards Granted During Year that Vested During Year for Non-PEO NEOs | Average Change in Fair Value from Last Day of Prior Year to Vesting Date of Unvested Equity Awards that Vested During Year for Non-PEO NEOs | Average Fair Value at Last Day of Prior Year of Equity Awards Forfeited During Year for Non-PEO NEOs | Average Value of Dividends or Other Earnings Paid on Equity Awards not Otherwise Included for Non-PEO NEOs | Average Total Inclusion of Equity Values for Non-PEO NEOs(1) | ||||||||||||||||
(a) | (b) | (c) | (d) | (e) | (f) | (g) | |||||||||||||||||
2025 | $519,349 | $436,678 | — | $4,059 | ($166,260) | — | $793,826 | ||||||||||||||||
2024 | $338,619 | ($334,200) | — | ($17,275) | ($89,542) | — | ($102,398) | ||||||||||||||||
2023 | $883,892 | ($31,121) | — | $201,003 | ($49,916) | — | $1,003,858 | ||||||||||||||||
2022 | $811,571 | ($51,158) | — | $840 | ($201,761) | — | $559,493 | ||||||||||||||||
2021 | $1,109,321 | ($148,209) | — | $6,746 | — | — | $967,858 | ||||||||||||||||
(1) | The calculation used for Compensation Actually Paid is columns (a) + (b) + (c) + (d) + (e) + (f) = (g). Instances in which the figure in column (g) does not align with the total sum of columns (a), (b), (c), (d), (e) and (f) is the result of rounding the other columns to the nearest whole number. |
(1) | The Principal Executive Officer (“PEO”) for 2023 ,2024, and 2025 was Kurt J. Bitting, Chief Executive Officer and he is referenced as the “First PEO” for 2023, 2024, 2025 in the charts in this section. The PEO for 2021, and 2022 was Belgacem Chariag, former Chairman, President, and Chief Executive Officer (whose employment was terminated without cause by the Board on April 25, 2022), and he is referenced as the “First PEO” for 2021 and 2022 in the charts in this section. Mr. Bitting became our Chief Executive Officer effective April 25, 2022 and is referenced as the “Second PEO” for 2022 in the charts in this section. |
(3) | The non-PEO NEOs for 2021 through 2025 and their respective titles during such year were as follows: |
2021 | 2022 | 2023 | 2024 | 2025 | ||||||||||
Thomas Schneberger, Vice President and President – Catalyst Technologies | Michael Feehan, Vice President and Chief Financial Officer | Michael Feehan, Vice President and Chief Financial Officer | Michael Feehan, Vice President and Chief Financial Officer | Michael Feehan, Vice President and Chief Financial Officer | ||||||||||
Kurt Bitting, Vice President and President – Ecoservices | Joseph S. Koscinski, Vice President, General Counsel and Secretary | Joseph S. Koscinski, Chief Administrative Officer, Vice President, General Counsel and Secretary | Joseph S. Koscinski, Chief Administrative Officer, Vice President, General Counsel and Secretary | Joseph S. Koscinski, Chief Administrative Officer, Vice President, General Counsel and Secretary | ||||||||||
Michael Feehan, Vice President and Chief Financial Officer | George L. Vann, Jr., Vice President and President – Ecoservices | George L. Vann, Jr., Vice President and President – Ecoservices | George L. Vann, Jr., Vice President and President – Ecoservices | George L. Vann, Jr., Former Vice President and President – Ecoservices | ||||||||||
Joseph S. Koscinski, Vice President, General Counsel and Secretary | Paul Whittleston, Vice President – Strategy and Business Development | Paul Whittleston, Vice President and President – Catalyst Technologies | Paul Whittleston, Vice President and President – Catalyst Technologies | Paul Whittleston, Former Vice President and President – Advanced Materials and Catalysts | ||||||||||
Albert F. Beninati, Jr., Vice President and President – Performance Chemicals | Thomas Schneberger, President of Ecovyst and President – Catalyst Technologies | |||||||||||||
Michael Crews, Executive Vice President and Chief Financial Officer | ||||||||||||||
(5) | The peer group for 2025 used in this calculation is defined as the “2025 Compensation Peer Group” on page 36. The adjustments to the peer group for 2025 approved in October 2024 were the removal of Chase Corporation, GCP Applied Technologies and Livent following their acquisition, the removal of NN, Inc. and CSW Industrials, Inc. given limited industry relevance, and the addition of AirBoss of America Corp. The returns of each issuer of the group were weighted according to the respective issuers’ stock market capitalization at the beginning of the period for which a return is indicated. |
(2) | Compensation Actually Paid reflects the exclusions and inclusions of certain amounts for the PEO and the Non-PEO NEOs as set forth below. Equity values are calculated in accordance with FASB ASC Topic 718. |
Year | Summary Compensation Table Total for First PEO | Exclusion of Stock Awards and Option Awards for First PEO | Inclusion of Equity Values for First PEO | Compensation Actually Paid to First PEO | ||||||||||
(a) | (b) | (c) | (d) | |||||||||||
2025 | $4,992,440 | ($3,347,752) | $6,264,677 | $7,909,365 | ||||||||||
2024 | $4,092,116 | ($2,761,375) | ($117,583) | $1,213,158 | ||||||||||
2023 | $4,669,022 | ($3,481,553) | $3,198,205 | $4,385,674 | ||||||||||
2022 | $8,958,314 | ($5,869,774) | ($3,395,432) | ($306,892) | ||||||||||
2021 | $8,953,055 | ($6,000,007) | $4,339,729 | $7,292,777 | ||||||||||
Year | Summary Compensation Table Total for Second PEO | Exclusion of Stock Awards and Option Awards for Second PEO | Inclusion of Equity Values for Second PEO | Compensation Actually Paid to Second PEO | ||||||||||
(a) | (b) | (c) | (d) | |||||||||||
2022 | $4,378,660 | ($2,670,440) | $2,046,819 | $3,755,039 | ||||||||||
(1) | The calculation used for Compensation Actually Paid is columns (a) + (b) + (c) = (d). Instances in which the figure in column (d) does not align with the total sum of columns (a), (b) and (c) is the result of rounding the other columns to the nearest whole dollar. |
The amounts in the Inclusion of Equity Values in the tables above are derived from the amounts set forth in the following tables:
Year | Year-End Fair Value of Equity Awards Granted During Year that Remained Unvested as of Last Day of Year for First PEO | Change in Fair Value from Last Day of Prior Year to Last Day of Year of Unvested Equity Awards for First PEO | Vesting-Date Fair Value of Equity Awards Granted During Year that Vested During Year for First PEO | Change in Fair Value from Last Day of Prior Year to Vesting Date of Unvested Equity Awards that Vested During Year for First PEO | Fair Value at Last Day of Prior Year of Equity Awards Forfeited During Year for First PEO | Value of Dividends or Other Earnings Paid on Equity Awards not Otherwise Included for First PEO | Total Inclusion of Equity Values for First PEO(1) | ||||||||||||||||
(a) | (b) | (c) | (d) | (e) | (f) | (g) | |||||||||||||||||
2025 | $4,556,797 | $2,072,263 | — | $11,283 | ($375,666) | — | $6,264,677 | ||||||||||||||||
2024 | $1,449,715 | ($1,317,798) | — | ($38,816) | ($210,685) | — | ($117,583) | ||||||||||||||||
2023 | $3,046,036 | ($119,368) | — | $433,439 | ($161,902) | — | $3,198,205 | ||||||||||||||||
2022 | $52,192 | ($254,446) | — | $34,177 | ($3,227,355) | — | ($3,395,432) | ||||||||||||||||
2021 | $5,150,840 | ($858,578) | — | $47,466 | — | — | $4,339,729 | ||||||||||||||||
Year | Year-End Fair Value of Equity Awards Granted During Year that Remained Unvested as of Last Day of Year for Second PEO | Change in Fair Value from Last Day of Prior Year to Last Day of Year of Unvested Equity Awards for Second PEO | Vesting-Date Fair Value of Equity Awards Granted During Year that Vested During Year for Second PEO | Change in Fair Value from Last Day of Prior Year to Vesting Date of Unvested Equity Awards that Vested During Year for Second PEO | Fair Value at Last Day of Prior Year of Equity Awards Forfeited During Year for Second PEO | Value of Dividends or Other Earnings Paid on Equity Awards not Otherwise Included for Second PEO | Total Inclusion of Equity Values for Second PEO(1) | ||||||||||||||||
(a) | (b) | (c) | (d) | (e) | (f) | (g) | |||||||||||||||||
2022 | $2,199,740 | ($159,076) | — | $6,156 | — | — | $2,046,819 | ||||||||||||||||
(1) | The calculation used for Compensation Actually Paid is columns (a) + (b) + (c) + (d) + (e) + (f) = (g). Instances in which the figure in column (g) does not align with the total sum of columns (a), (b), (c), (d), (e) and (f) is the result of rounding the other columns to the nearest whole number. |
(2) | Compensation Actually Paid reflects the exclusions and inclusions of certain amounts for the PEO and the Non-PEO NEOs as set forth below. Equity values are calculated in accordance with FASB ASC Topic 718. |
Year | Average Summary Compensation Table Total for Non-PEO NEOs | Average Exclusion of Stock Awards and Option Awards for Non-PEO NEOs | Average Inclusion of Equity Values for Non-PEO NEOs | Average Compensation Actually Paid to Non-PEO NEOs(1) | ||||||||||
(a) | (b) | (c) | (d) | |||||||||||
2025 | $1,406,253 | ($633,995) | $793,826 | $1,566,083 | ||||||||||
2024 | $1,243,731 | ($616,794) | ($102,398) | $524,539 | ||||||||||
2023 | $1,553,253 | ($983,040) | $1,003,858 | $1,574,071 | ||||||||||
2022 | $2,232,721 | ($1,498,620) | $559,493 | $1,293,593 | ||||||||||
2021 | $2,421,693 | ($1,333,333) | $967,858 | $2,056,217 | ||||||||||
(1) | The calculation used for Compensation Actually Paid is columns (a) + (b) + (c) = (d). Instances in which the figure in column (d) does not align with the total sum of columns (a), (b) and (c) is the result of rounding the other columns to the nearest whole dollar. |
The amounts in the Inclusion of Equity Values in the tables above are derived from the amounts set forth in the following tables:
Year | Average Year-End Fair Value of Equity Awards Granted During Year that Remained Unvested as of Last Day of Year for Non-PEO NEOs | Average Change in Fair Value from Last Day of Prior Year to Last Day of Year of Unvested Equity Awards for Non-PEO NEOs | Average Vesting-Date Fair Value of Equity Awards Granted During Year that Vested During Year for Non-PEO NEOs | Average Change in Fair Value from Last Day of Prior Year to Vesting Date of Unvested Equity Awards that Vested During Year for Non-PEO NEOs | Average Fair Value at Last Day of Prior Year of Equity Awards Forfeited During Year for Non-PEO NEOs | Average Value of Dividends or Other Earnings Paid on Equity Awards not Otherwise Included for Non-PEO NEOs | Average Total Inclusion of Equity Values for Non-PEO NEOs(1) | ||||||||||||||||
(a) | (b) | (c) | (d) | (e) | (f) | (g) | |||||||||||||||||
2025 | $519,349 | $436,678 | — | $4,059 | ($166,260) | — | $793,826 | ||||||||||||||||
2024 | $338,619 | ($334,200) | — | ($17,275) | ($89,542) | — | ($102,398) | ||||||||||||||||
2023 | $883,892 | ($31,121) | — | $201,003 | ($49,916) | — | $1,003,858 | ||||||||||||||||
2022 | $811,571 | ($51,158) | — | $840 | ($201,761) | — | $559,493 | ||||||||||||||||
2021 | $1,109,321 | ($148,209) | — | $6,746 | — | — | $967,858 | ||||||||||||||||
(1) | The calculation used for Compensation Actually Paid is columns (a) + (b) + (c) + (d) + (e) + (f) = (g). Instances in which the figure in column (g) does not align with the total sum of columns (a), (b), (c), (d), (e) and (f) is the result of rounding the other columns to the nearest whole number. |
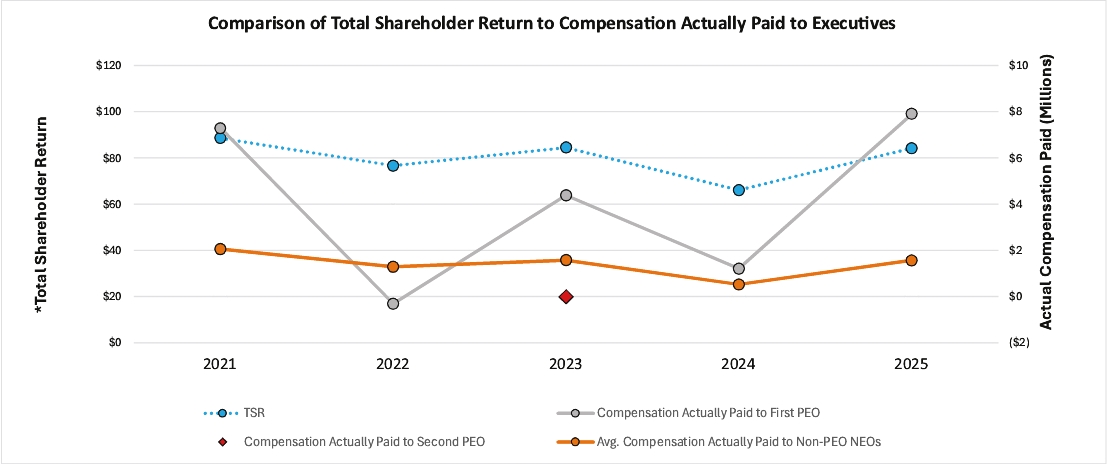
* Assumes $100 invested at market close of December 31, 2021 in stock or index, including reinvestment of dividends.
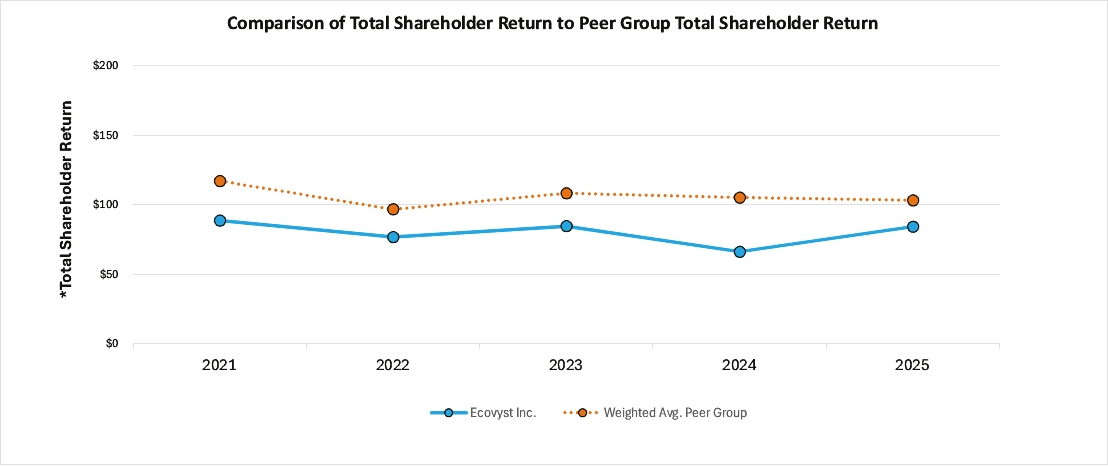
* Assumes $100 invested at market close of December 31, 2021 in stock or index, including reinvestment of dividends
Tabular List of Most Important Financial Performance Measures
The following table presents the financial performance measures that the Company considers to have been the most important in linking Compensation Actually Paid to our PEO and other NEOs for 2025 to Company performance.
Financial Performance Measures | ||||||||
Adjusted EBITDA | Adjusted Free Cash Flow | TSR | ||||||
The amounts in the Inclusion of Equity Values in the tables above are derived from the amounts set forth in the following tables:
Year | Year-End Fair Value of Equity Awards Granted During Year that Remained Unvested as of Last Day of Year for First PEO | Change in Fair Value from Last Day of Prior Year to Last Day of Year of Unvested Equity Awards for First PEO | Vesting-Date Fair Value of Equity Awards Granted During Year that Vested During Year for First PEO | Change in Fair Value from Last Day of Prior Year to Vesting Date of Unvested Equity Awards that Vested During Year for First PEO | Fair Value at Last Day of Prior Year of Equity Awards Forfeited During Year for First PEO | Value of Dividends or Other Earnings Paid on Equity Awards not Otherwise Included for First PEO | Total Inclusion of Equity Values for First PEO(1) | ||||||||||||||||
(a) | (b) | (c) | (d) | (e) | (f) | (g) | |||||||||||||||||
2025 | $4,556,797 | $2,072,263 | — | $11,283 | ($375,666) | — | $6,264,677 | ||||||||||||||||
2024 | $1,449,715 | ($1,317,798) | — | ($38,816) | ($210,685) | — | ($117,583) | ||||||||||||||||
2023 | $3,046,036 | ($119,368) | — | $433,439 | ($161,902) | — | $3,198,205 | ||||||||||||||||
2022 | $52,192 | ($254,446) | — | $34,177 | ($3,227,355) | — | ($3,395,432) | ||||||||||||||||
2021 | $5,150,840 | ($858,578) | — | $47,466 | — | — | $4,339,729 | ||||||||||||||||
Year | Year-End Fair Value of Equity Awards Granted During Year that Remained Unvested as of Last Day of Year for Second PEO | Change in Fair Value from Last Day of Prior Year to Last Day of Year of Unvested Equity Awards for Second PEO | Vesting-Date Fair Value of Equity Awards Granted During Year that Vested During Year for Second PEO | Change in Fair Value from Last Day of Prior Year to Vesting Date of Unvested Equity Awards that Vested During Year for Second PEO | Fair Value at Last Day of Prior Year of Equity Awards Forfeited During Year for Second PEO | Value of Dividends or Other Earnings Paid on Equity Awards not Otherwise Included for Second PEO | Total Inclusion of Equity Values for Second PEO(1) | ||||||||||||||||
(a) | (b) | (c) | (d) | (e) | (f) | (g) | |||||||||||||||||
2022 | $2,199,740 | ($159,076) | — | $6,156 | — | — | $2,046,819 | ||||||||||||||||
Year | Average Year-End Fair Value of Equity Awards Granted During Year that Remained Unvested as of Last Day of Year for Non-PEO NEOs | Average Change in Fair Value from Last Day of Prior Year to Last Day of Year of Unvested Equity Awards for Non-PEO NEOs | Average Vesting-Date Fair Value of Equity Awards Granted During Year that Vested During Year for Non-PEO NEOs | Average Change in Fair Value from Last Day of Prior Year to Vesting Date of Unvested Equity Awards that Vested During Year for Non-PEO NEOs | Average Fair Value at Last Day of Prior Year of Equity Awards Forfeited During Year for Non-PEO NEOs | Average Value of Dividends or Other Earnings Paid on Equity Awards not Otherwise Included for Non-PEO NEOs | Average Total Inclusion of Equity Values for Non-PEO NEOs(1) | ||||||||||||||||
(a) | (b) | (c) | (d) | (e) | (f) | (g) | |||||||||||||||||
2025 | $519,349 | $436,678 | — | $4,059 | ($166,260) | — | $793,826 | ||||||||||||||||
2024 | $338,619 | ($334,200) | — | ($17,275) | ($89,542) | — | ($102,398) | ||||||||||||||||
2023 | $883,892 | ($31,121) | — | $201,003 | ($49,916) | — | $1,003,858 | ||||||||||||||||
2022 | $811,571 | ($51,158) | — | $840 | ($201,761) | — | $559,493 | ||||||||||||||||
2021 | $1,109,321 | ($148,209) | — | $6,746 | — | — | $967,858 | ||||||||||||||||
(1) | The calculation used for Compensation Actually Paid is columns (a) + (b) + (c) + (d) + (e) + (f) = (g). Instances in which the figure in column (g) does not align with the total sum of columns (a), (b), (c), (d), (e) and (f) is the result of rounding the other columns to the nearest whole number. |