
I n v e s t o r P r e s e n t a t i o n October 2025 Exhibit (c)(xix)
D i s c l a imer These materials (the “Presentation”) are being delivered on
behalf of Searchlight Capital Partners and Abry Partners (the “Company”) by its financial advisor, TD Securities (USA) LLC (“TD Securities”), on a confidential basis and is subject to the Confidentiality Agreement you entered into with the
Company. This Presentation was not prepared with a view to public disclosure or to conform to any disclosure standards under any state, federal or international securities laws or other laws, rules or regulations. It contains highly
confidential and proprietary information and is solely for informational and discussion purposes in connection with the evaluation of a potential transaction regarding a business of the Company (the "Business"). This Presentation may not be
used for any other purpose, and by accepting these materials the recipient agrees to maintain all such information (and any other information made available in connection with any further investigation of the Company) in strict confidence. In
preparing the Presentation, TD Securities has relied solely upon documents and information prepared for or supplied to TD Securities from the Company and other sources, without independent verification by TD Securities. This Presentation must
not be disclosed, copied or reproduced, distributed or passed to others at any time without the prior written consent of the Company and TD Securities. The information contained herein does not purport to be all-inclusive or to contain all the
information (including potential risks, direct or indirect) necessary to evaluate any potential transaction or transactions. None of the Company, TD Securities, their respective affiliates or their respective affiliates, officers, directors,
employees, advisors or representatives (its “Representatives”) makes any representation or warranty (express or implied) as to the accuracy or completeness of any information contained herein or any other written or oral communication
transmitted or made available to the recipient in connection with an evaluation of the Business and/or a potential transaction and nothing contained herein or therein is or shall be construed or relied upon as, a representation or warranty,
whether as to the past, present or future. TD Securities does not have any obligation to update or otherwise revise this Presentation and the information contained herein (though all information contained herein is subject to revision) or to
provide the recipient with access to any additional evaluation material. Certain financial information contained in this Presentation may be based in part on hypothetical assumptions and projected performance. Actual performance will likely
differ, and may differ materially, and the recipient should understand that statements regarding prospects, estimates or projections (including any forward-looking statements) may not be realized. No representation or warranty is made that such
financial information is accurate or complete or does not contain errors, or that alternative modeling techniques or assumptions would not be more appropriate or produce significantly different results. This Presentation contains
forward-looking statements, estimates, targets and/or projections. Such forward-looking statements, estimates, targets and projections are not guarantees of future performance and involve known and unknown risks and uncertainties. Other
important factors could cause actual results to differ from the statements, estimates, targets and/or projections contained herein. Neither the Company nor its respective affiliates, equity holders, directors, officers, employees and other
representatives makes any representation, warranty or other assurance (express or implied) that any of the forward-looking statements, estimates, targets and/or projections will be realized. TD Securities has not made an independent evaluation
or appraisal of the assets and liabilities (including any contingent, derivative or off-balance sheet assets and liabilities) of the Business or any other party to any transaction or any of their respective affiliates and has no obligation to
evaluate the solvency of the Company or any other party to any transaction under any state or federal laws relating to bankruptcy, insolvency or similar matters. Any market valuations contained herein are indicative values as of the time and
date indicated for illustrative purposes only. TD Securities does not warrant their completeness or accuracy. Any price or valuation is subject to change without notice. TD Securities cannot guarantee that different prices and/or valuations
would not be available elsewhere and suggests that valuations from other sources be obtained for comparison. Actual quotations could differ subject to market conditions. Nothing herein should be construed as tax, accounting, regulatory or
legal advice. TD Securities is not acting in any fiduciary, advisory, agency or similar capacity to the recipient or any of its affiliates, agents or representatives, nor may any of the foregoing persons rely on this Presentation. Prior to
entering into any potential transaction, the recipient should determine the financial suitability, risks and merits of such transaction, including all economic, legal, tax, accounting or any other consequences associated therewith, using its
own judgment and independent analysis, including with respect to any financial information contained herein, and without reliance upon TD Securities. The recipient should seek advice from its own advisors in making such determinations. Neither
the Company, TD Securities nor any of their respective Representatives will be liable to the recipient or any other party, whether for negligence, breach of contract or otherwise, for any loss or damage of whatsoever nature suffered by such
party (including, without limitation, direct loss or damage, indirect or consequential loss or damage, loss of goodwill, loss of business opportunity, loss of data or loss of profit) arising from TD Securities providing the recipient with these
materials or the information contained herein or any other written or oral communication transmitted or made available to the recipient in connection with an evaluation of a potential transaction. The Company, TD Securities and their respective
affiliates expressly disclaim any and all liability relating to, resulting from or based, in whole or in part, on such information, errors therein or omissions therefrom. This Presentation does not constitute a commitment by any TD Securities
entity or affiliate to enter into any transaction, underwrite, subscribe for or place any securities or to extend or arrange credit or to provide any other services. Nothing in these materials should be construed as, and may not be used in
connection with, an offer to sell, or a solicitation of an offer to buy or hold, an interest in any security or investment product. Further, these materials are not an offer or solicitation to enter into a transaction with the recipient and are
not an official confirmation of terms. TD Securities is a registered broker-dealer and a member of the Financial Industry Regulatory Authority. TD Securities is a full-service securities firm and it and its affiliates may engage in various
activities, including securities trading, providing investment banking and financial advice, investment management, principal investment, commercial banking, hedging, financing, brokerage activities and financial planning. Accordingly, any
information contained herein should not be viewed as independent of the interests of TD Securities and its affiliates. Such interests may conflict with the recipient's interests and the recipient should be aware of such potential conflicts of
interest when reviewing this information. All logos are property of their respective owners and are for identification purposes only. Use of these names, logos and brands does not imply endorsement. All communications and inquiries relating
to this Presentation and requests for additional information should be addressed to TD Securities’ Representatives listed in the materials. James Steinlage Director james.steinlage@tdsecurities.com (646) 562-1105 Jai Vaswani Vice President
jai.vaswani2@tdsecurities.com (650) 455-7708 Vinni Trehan Managing Director & Co-Head of Technology Investment Banking vinni.trehan@tdsecurities.com (703) 725-4739 New York: 22 Vanderbilt Avenue | New York, New York 10017 2 Dylan
Piccolo Managing Director dylan.piccolo@tdsecurities.com (332) 259-5220 Paul Zangrilli Managing Director paul.zangrilli@tdsecurities.com (646) 696-0054
Table of Contents 1 Business Overview 2 2 KORE’s Value Creation &
Transformation (2023-25) 3 Investment Highlights 4 Financial Overview
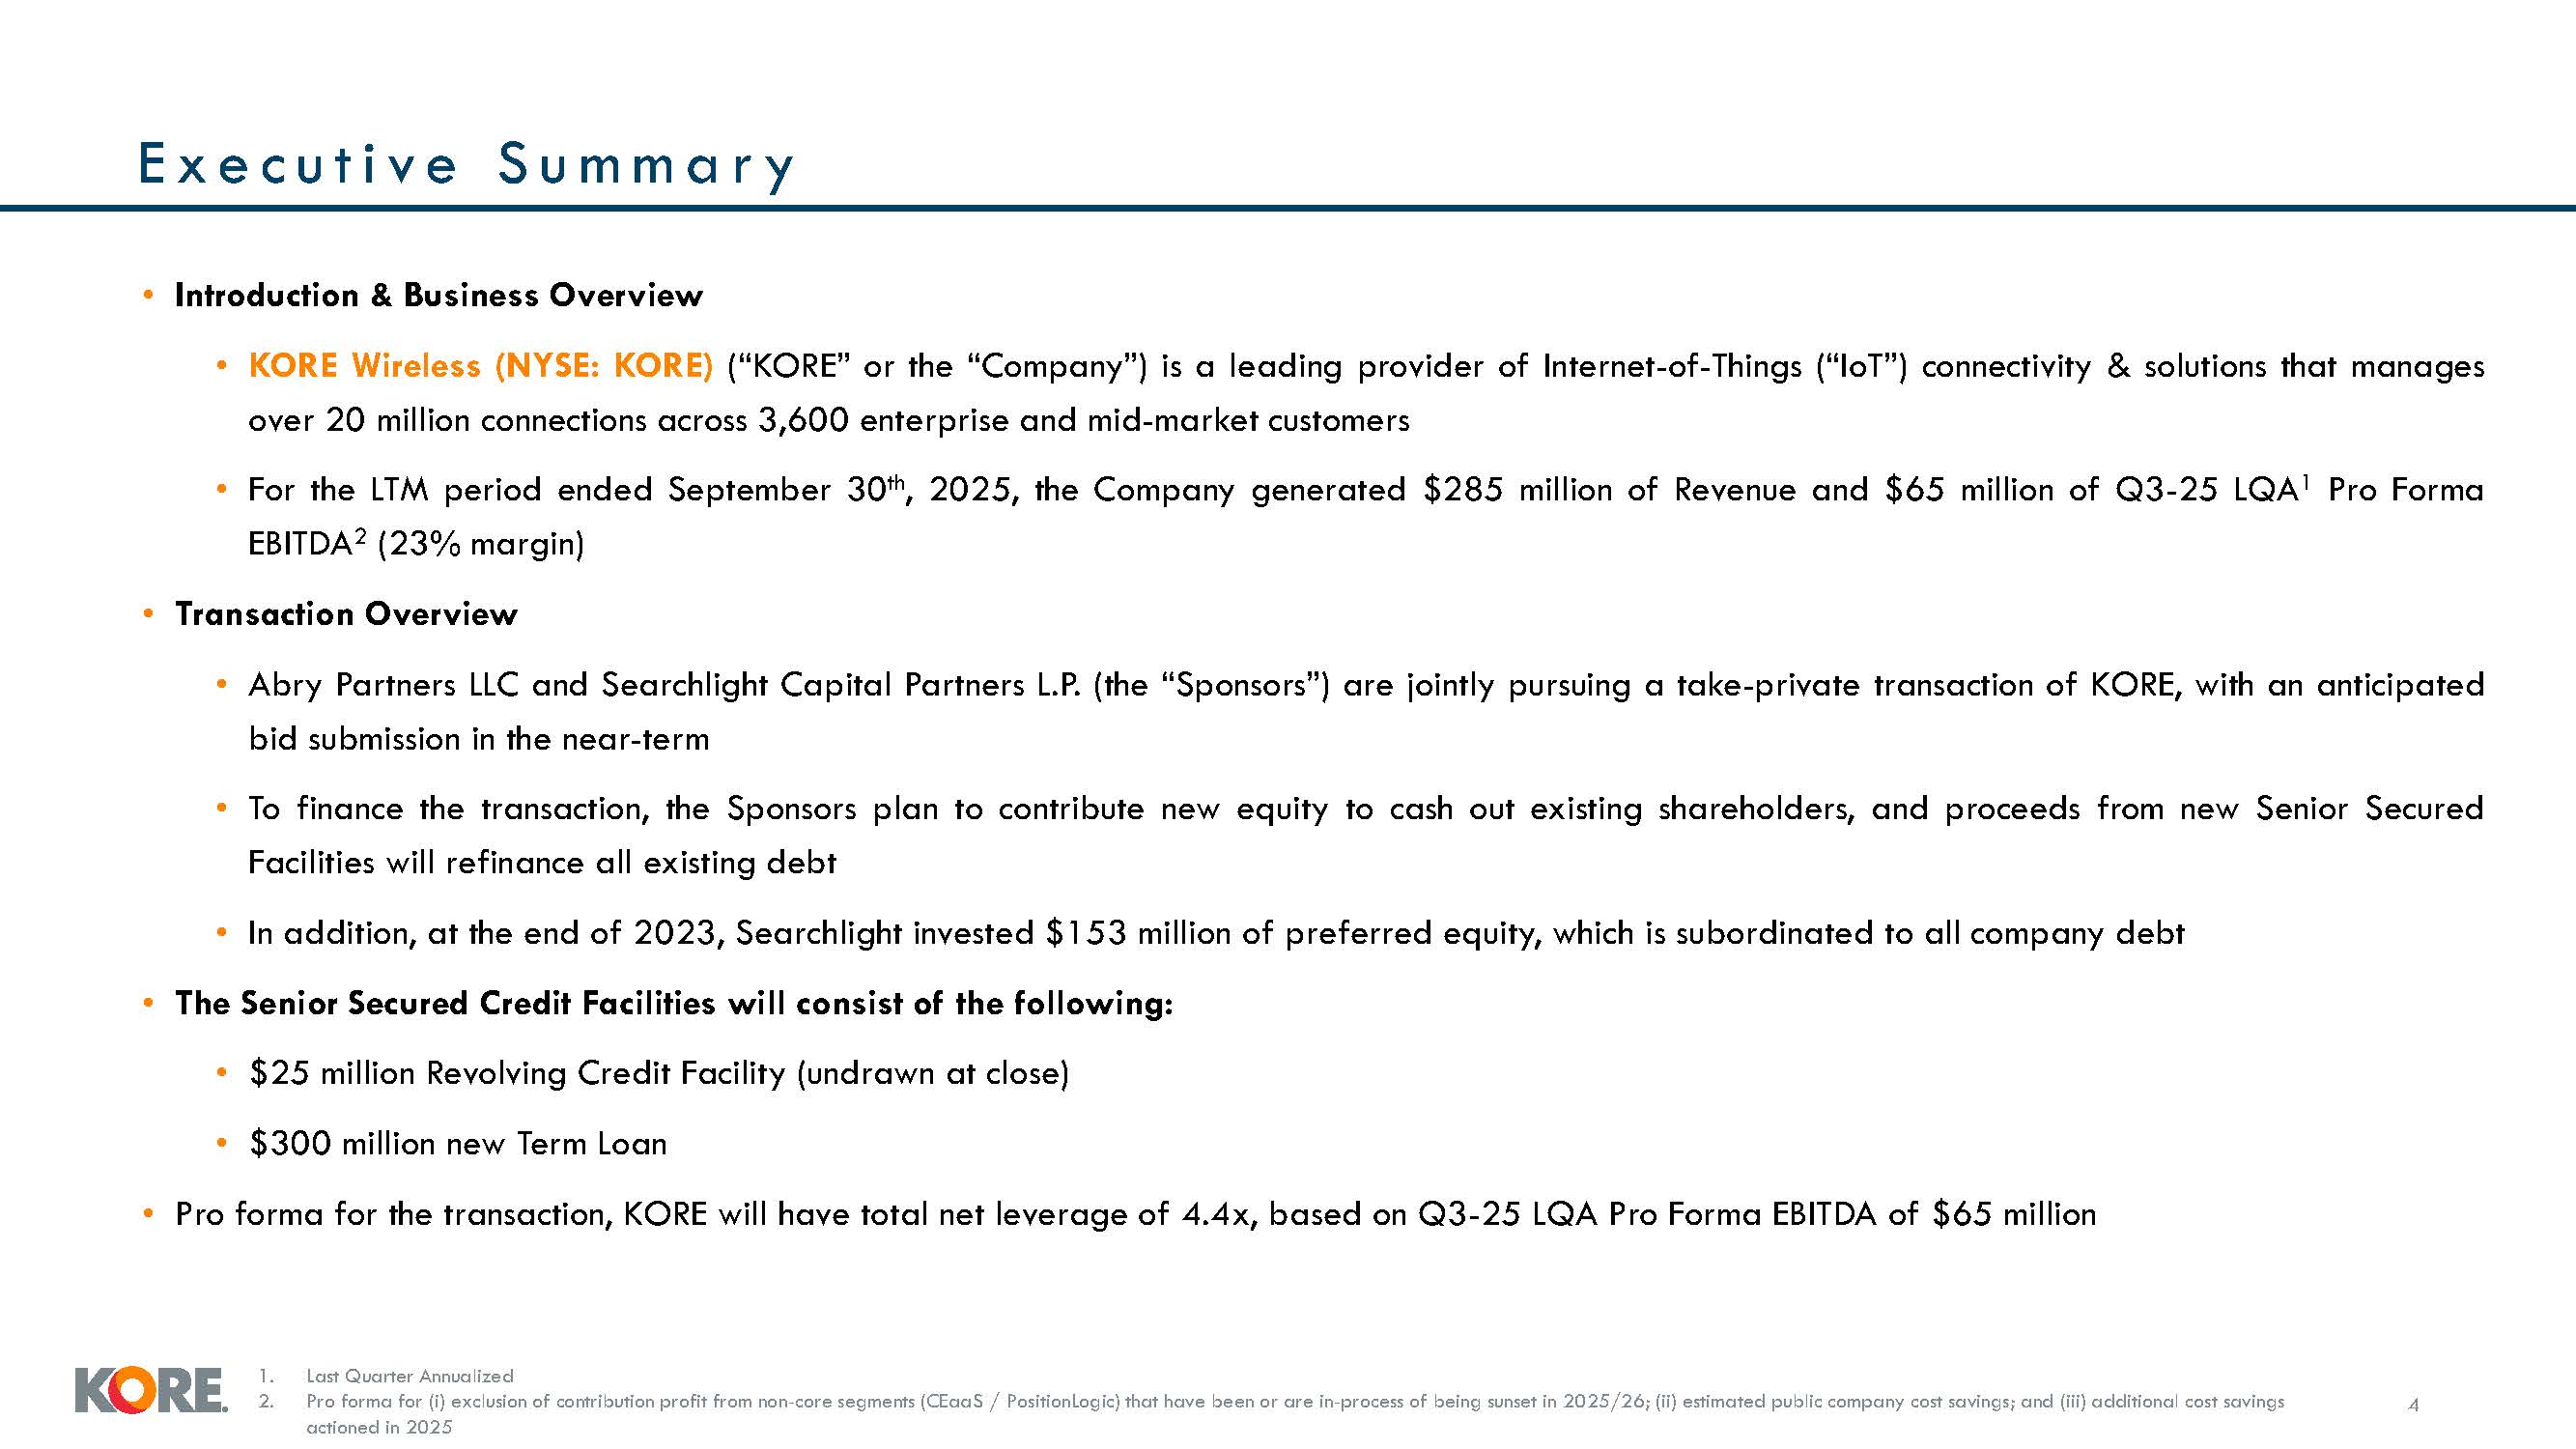
E x e c u t i v e S u m m a r y 4 Introduction & Business Overview KORE
Wireless (NYSE: KORE) (“KORE” or the “Company”) is a leading provider of Internet-of-Things (“IoT”) connectivity & solutions that manages over 20 million connections across 3,600 enterprise and mid-market customers For the LTM period ended
September 30th, 2025, the Company generated $285 million of Revenue and $65 million of Q3-25 LQA1 Pro Forma EBITDA2 (23% margin) Transaction Overview Abry Partners LLC and Searchlight Capital Partners L.P. (the “Sponsors”) are jointly
pursuing a take-private transaction of KORE, with an anticipated bid submission in the near-term To finance the transaction, the Sponsors plan to contribute new equity to cash out existing shareholders, and proceeds from new Senior Secured
Facilities will refinance all existing debt In addition, at the end of 2023, Searchlight invested $153 million of preferred equity, which is subordinated to all company debt The Senior Secured Credit Facilities will consist of the
following: $25 million Revolving Credit Facility (undrawn at close) $300 million new Term Loan Pro forma for the transaction, KORE will have total net leverage of 4.4x, based on Q3-25 LQA Pro Forma EBITDA of $65 million Last Quarter
Annualized Pro forma for (i) exclusion of contribution profit from non-core segments (CEaaS / PositionLogic) that have been or are in-process of being sunset in 2025/26; (ii) estimated public company cost savings; and (iii) additional cost
savings actioned in 2025
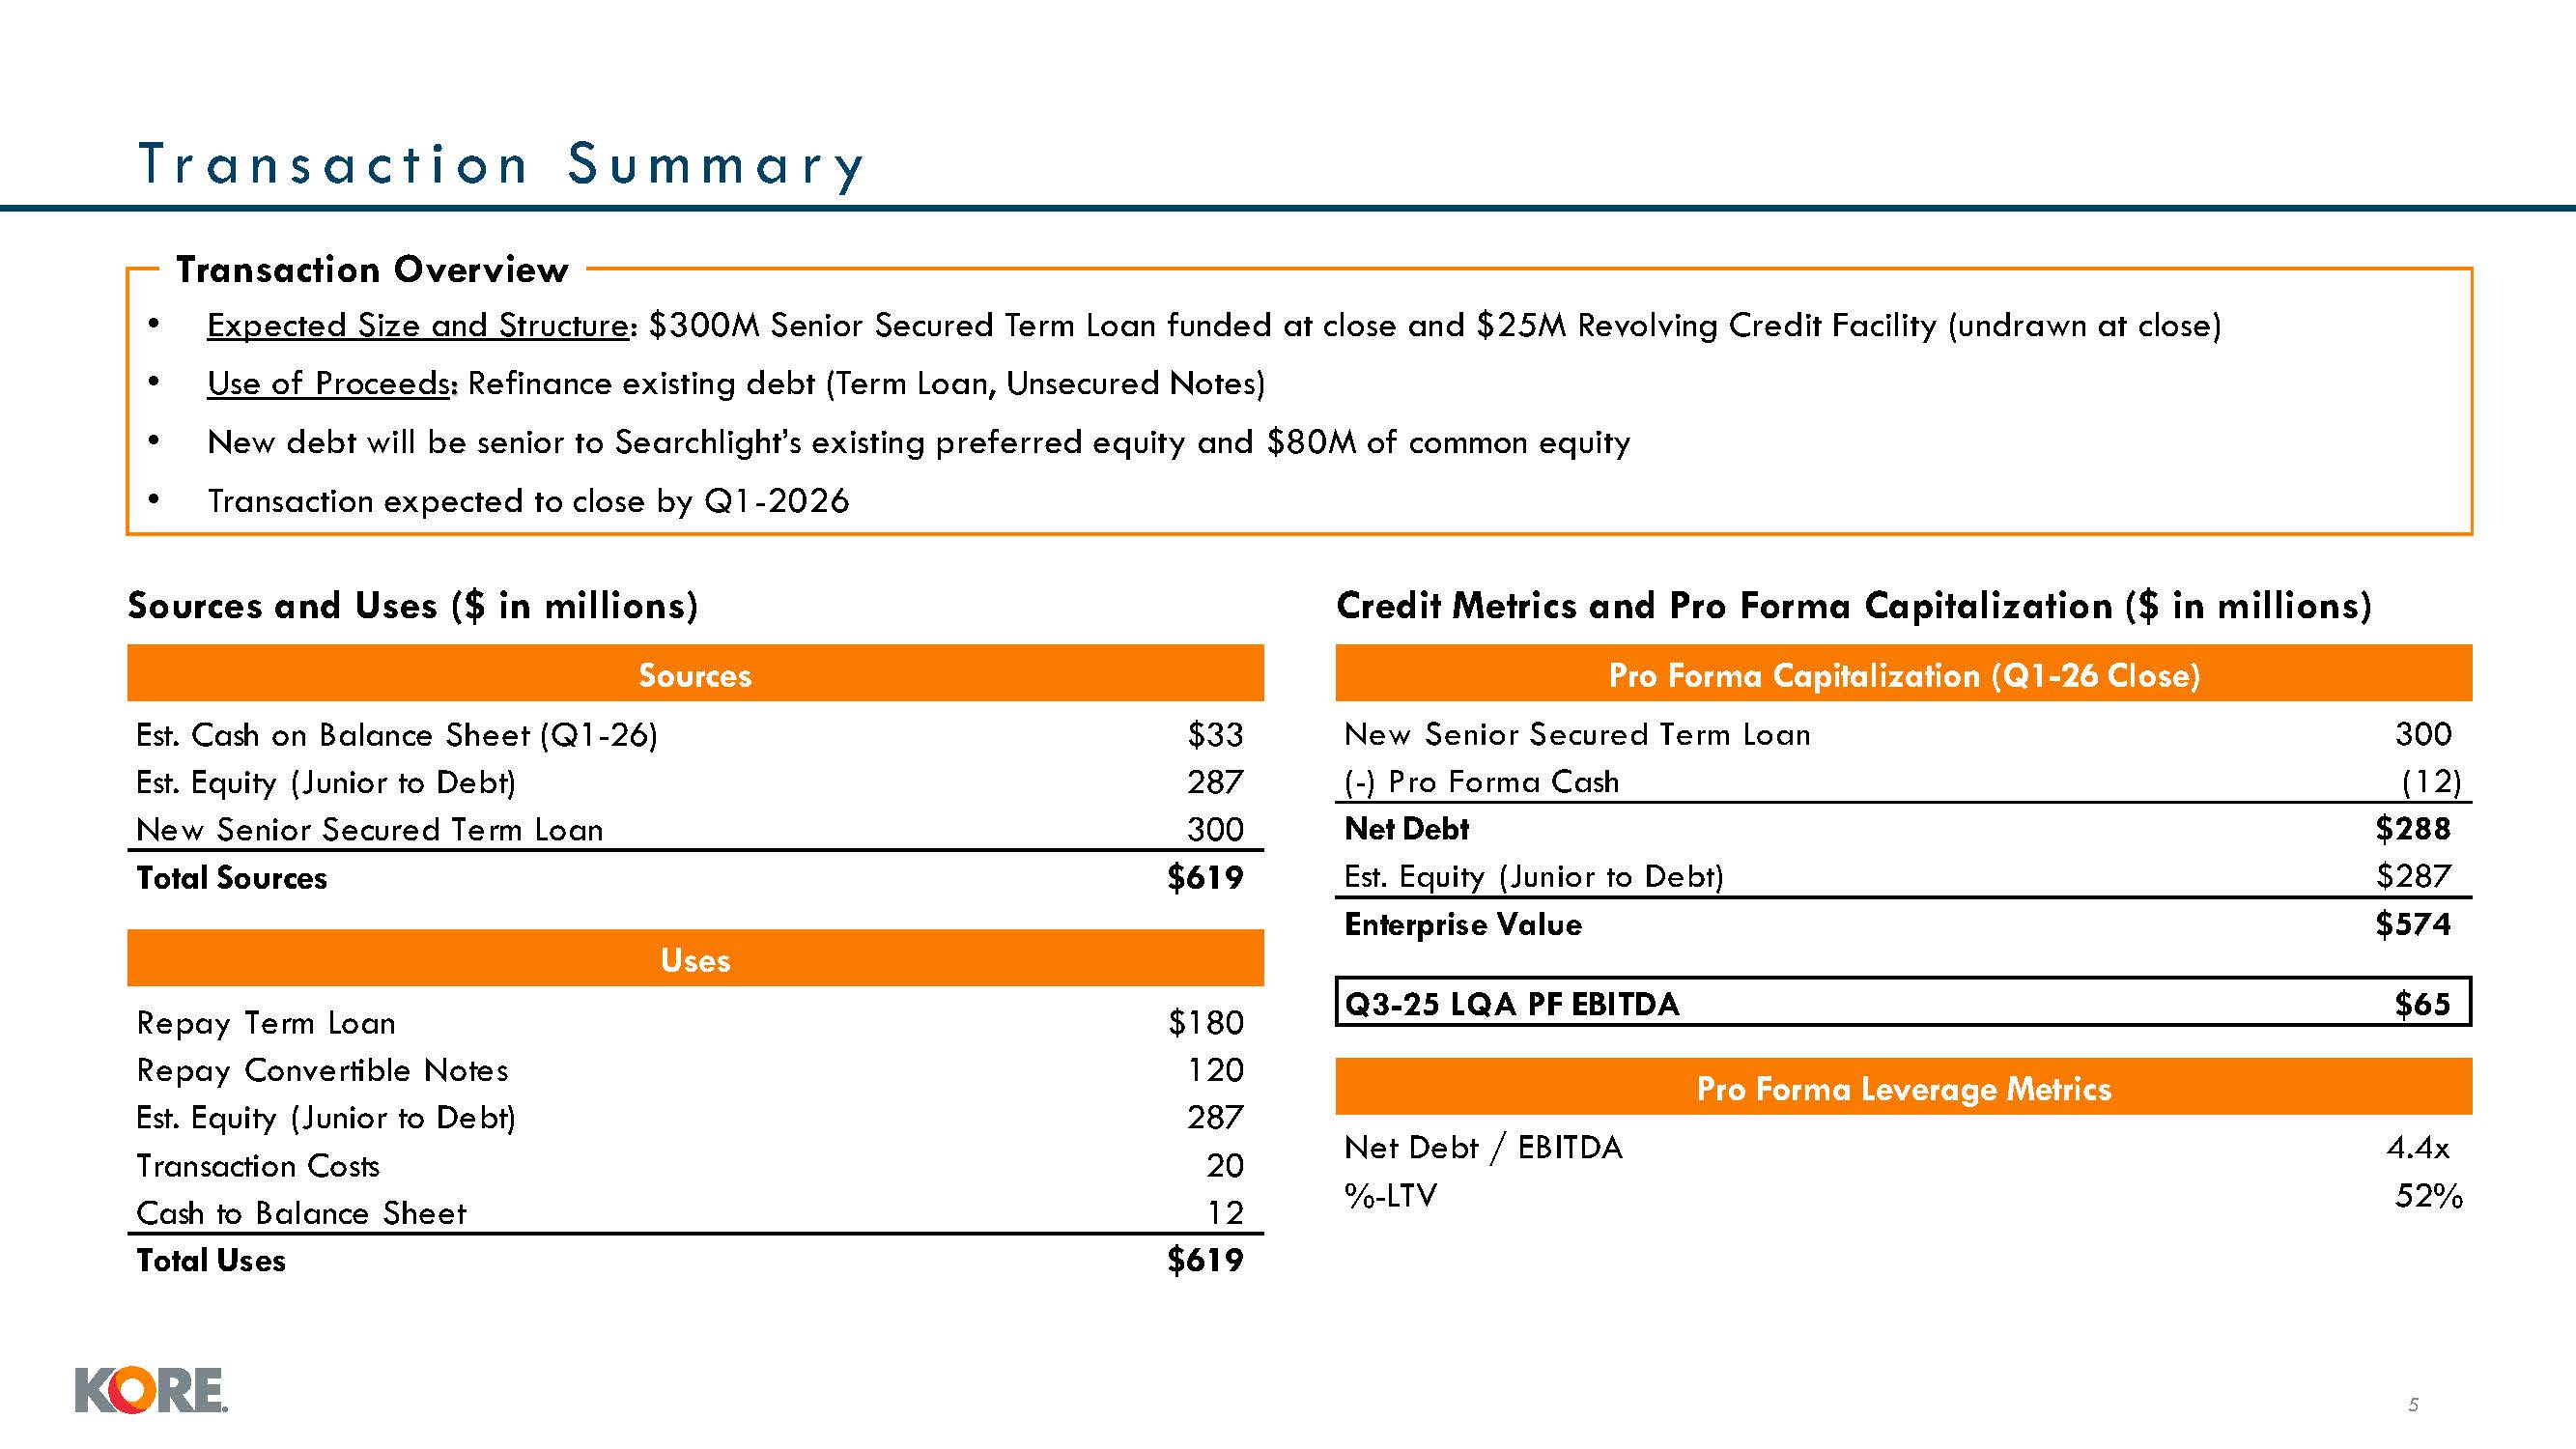
Sources and Uses ($ in millions) Credit Metrics and Pro Forma Capitalization ($
in millions) Sources Pro Forma Capitalization (Q1-26 Close) Est. Cash on Balance Sheet (Q1-26) $33 New Senior Secured Term Loan 300 Est. Equity (Junior to Debt) 287 (-) Pro Forma Cash (12) New Senior Secured Term Loan 300 Net
Debt $288 Total Sources $619 Est. Equity (Junior to Debt) $287 Tr a n s a c t i o n S u m m a r y 5 Transaction Overview Expected Size and Structure: $300M Senior Secured Term Loan funded at close and $25M Revolving Credit Facility
(undrawn at close) Use of Proceeds: Refinance existing debt (Term Loan, Unsecured Notes) New debt will be senior to Searchlight’s existing preferred equity and $80M of common equity Transaction expected to close by Q1-2026 Uses Pro Forma
Leverage Metrics Net Debt / EBITDA %-LTV 4.4x 52% Repay Term Loan $180 Repay Convertible Notes 120 Est. Equity (Junior to Debt) 287 Transaction Costs 20 Cash to Balance Sheet 12 Total Uses $619 Enterprise Value $574 Q3-25 LQA
PF EBITDA $65

Business Overview Proprietary & confidential to KORE Wireless |6
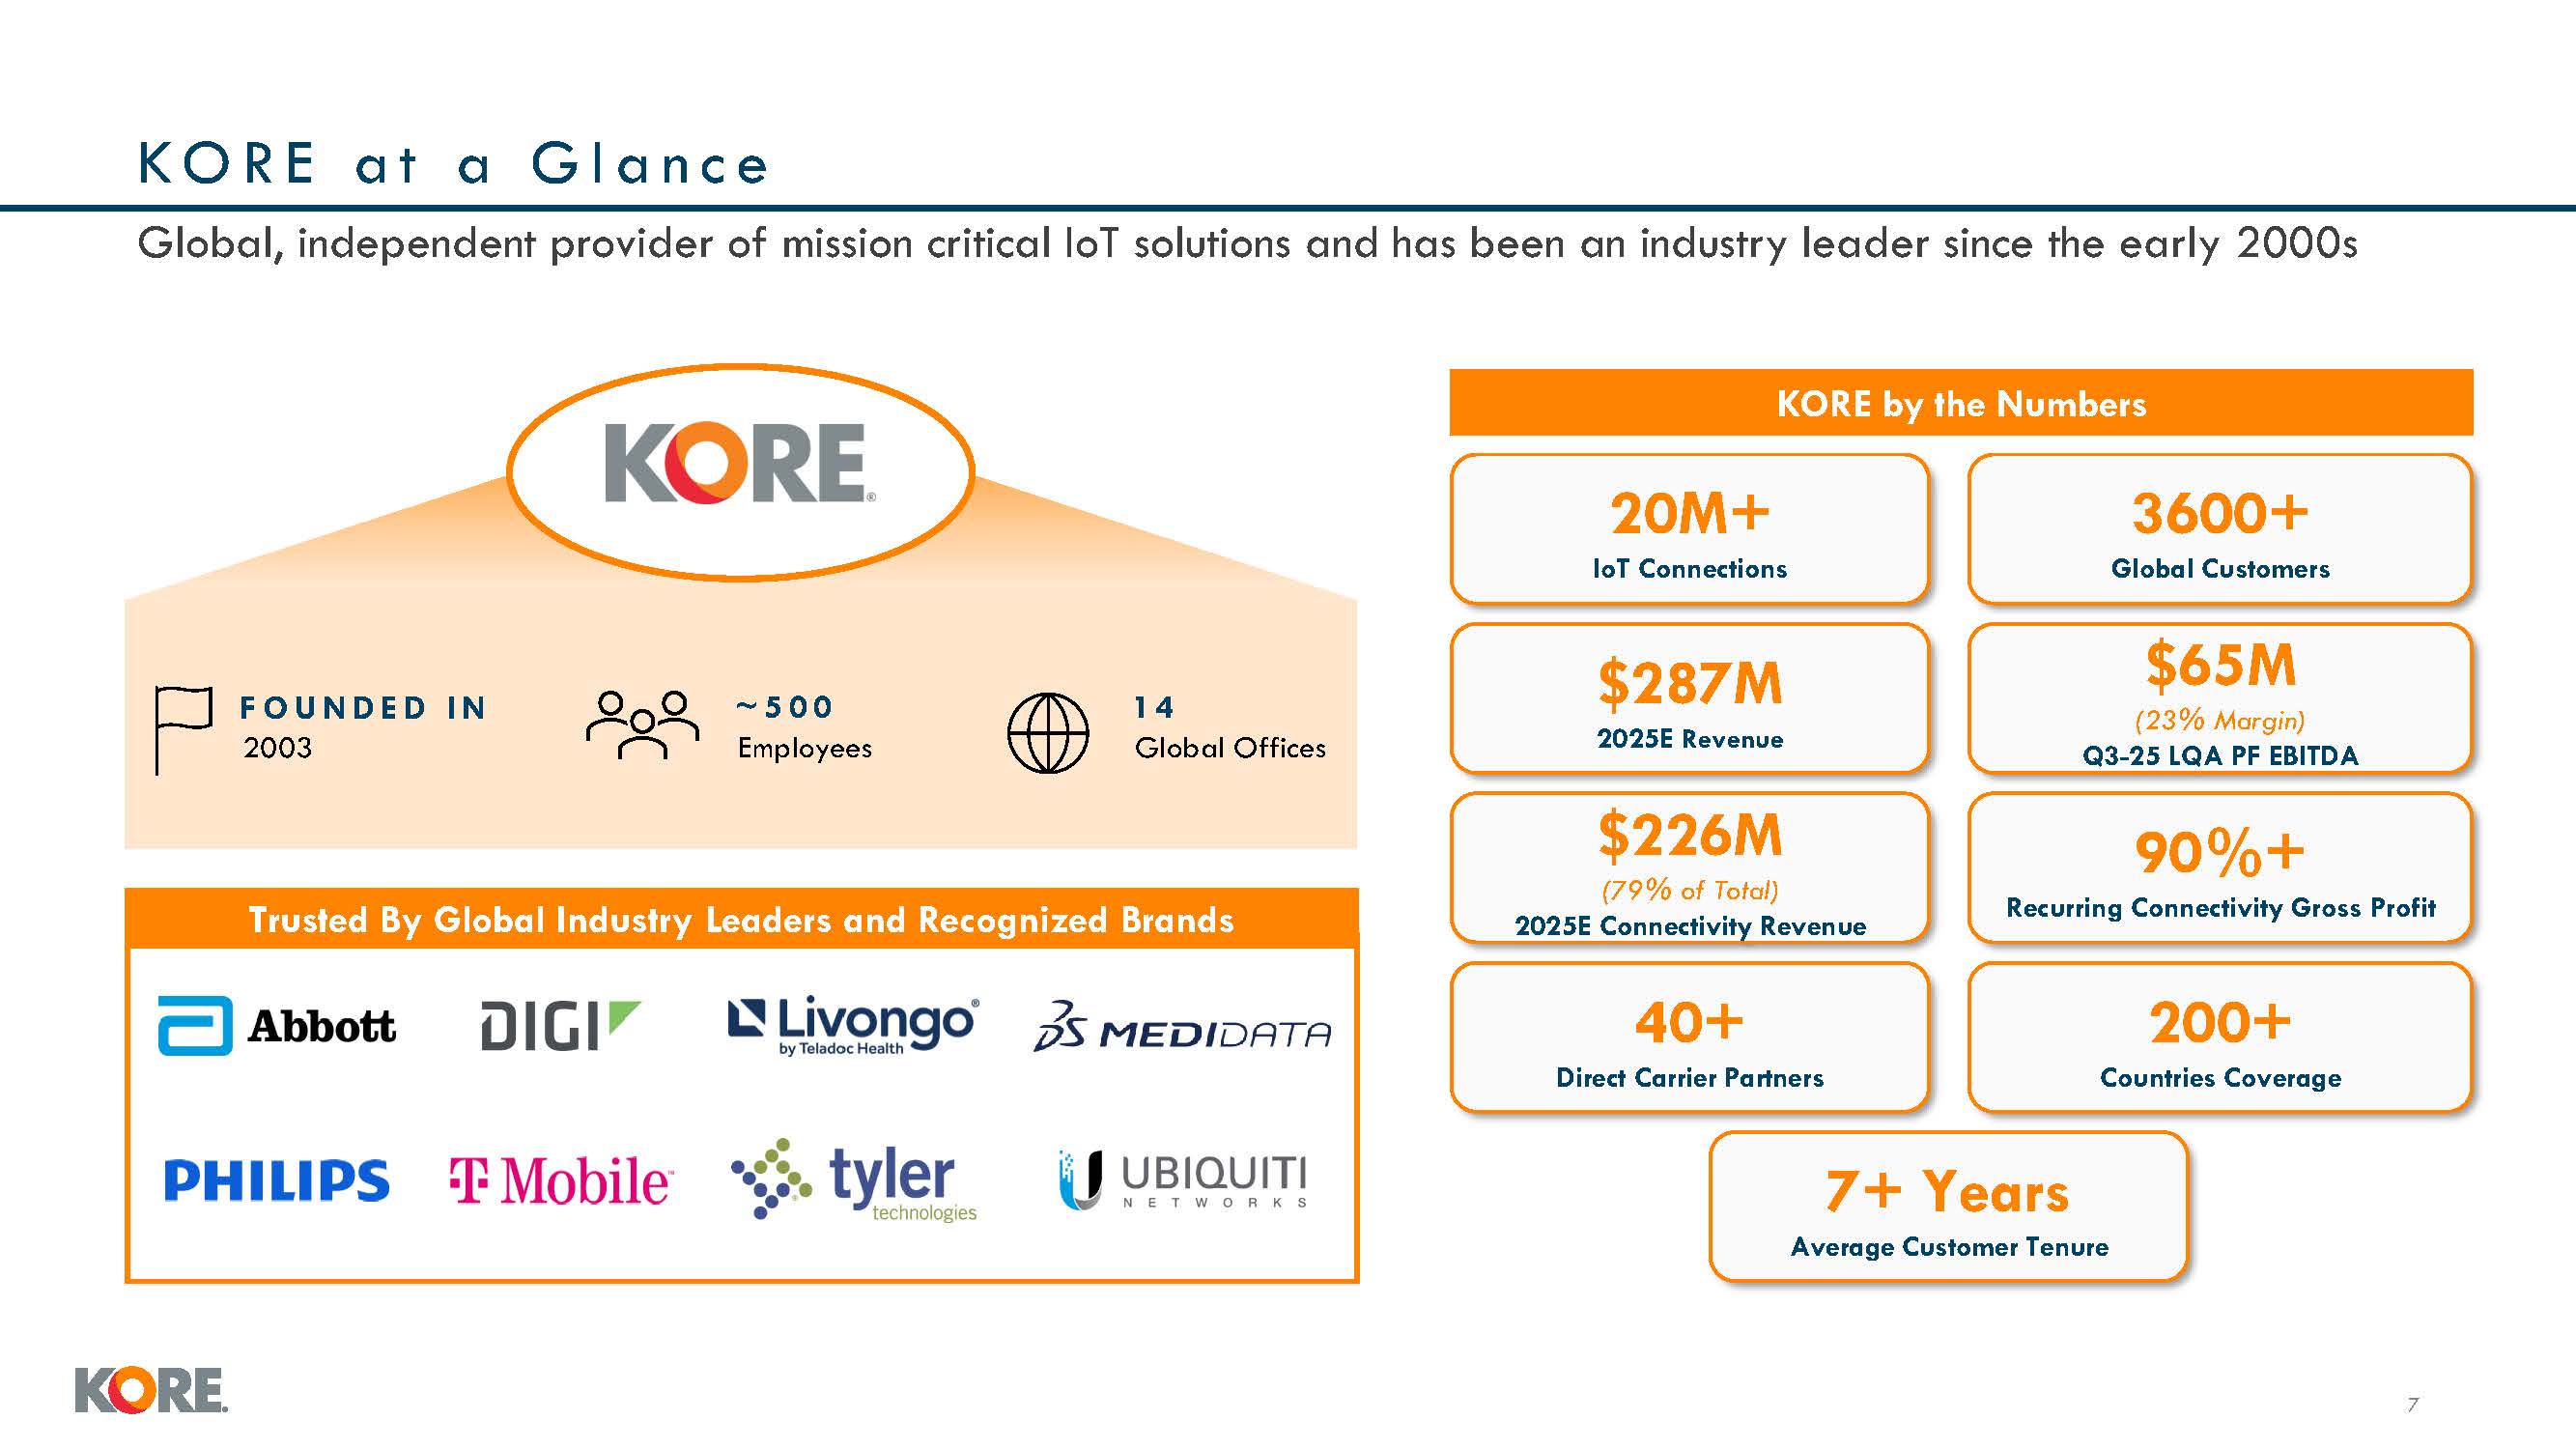
K O R E a t a G l a n c e Global, independent provider of mission critical IoT
solutions and has been an industry leader since the early 2000s KORE by the Numbers 90%+ Recurring Connectivity Gross Profit $287M 2025E Revenue $226M (79% of Total) 2025E Connectivity Revenue 3600+ Global Customers 20M+ IoT
Connections $65M (23% Margin) Q3-25 LQA PF EBITDA Trusted By Global Industry Leaders and Recognized Brands F O U N D E D I N 2003 ~ 5 0 0 Employees 14 Global Offices 7+ Years Average Customer Tenure 200+ Countries
Coverage 40+ Direct Carrier Partners 7
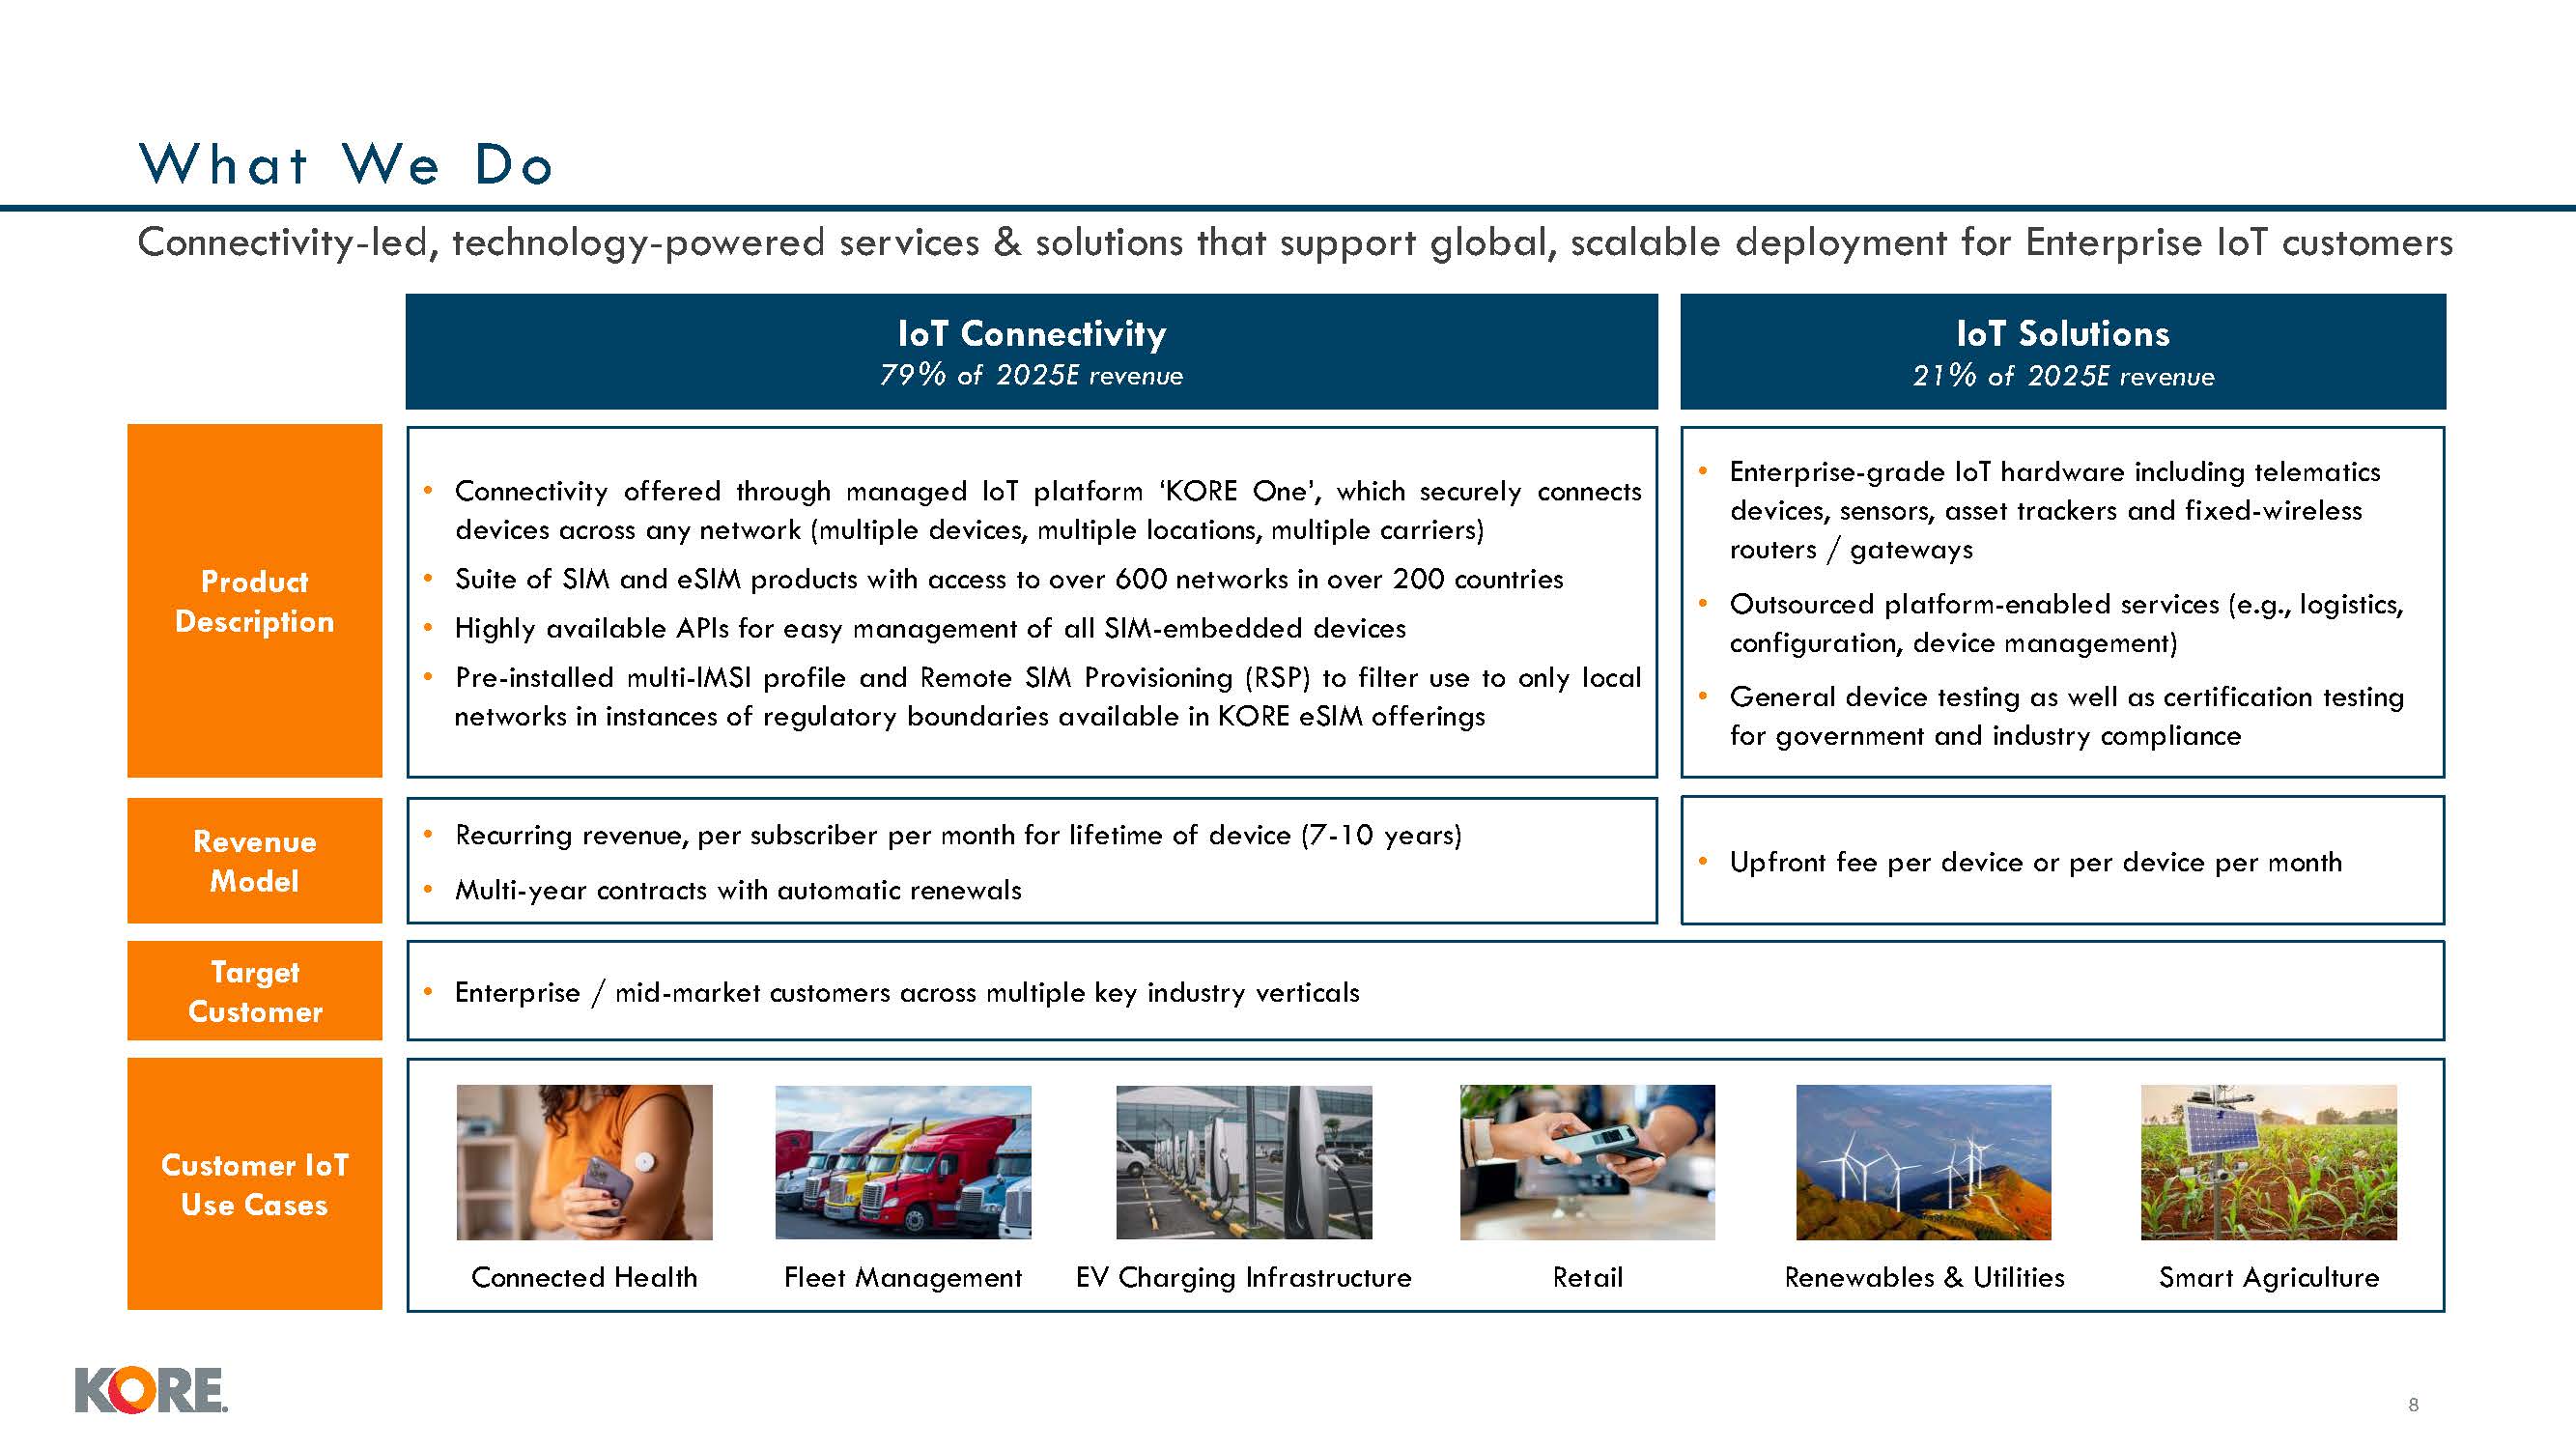
Wh at We D o Connectivity-led, technology-powered services & solutions that
support global, scalable deployment for Enterprise IoT customers IoT Solutions 21% of 2025E revenue IoT Connectivity 79% of 2025E revenue Product Description Connectivity offered through managed IoT platform ‘KORE One’, which securely
connects devices across any network (multiple devices, multiple locations, multiple carriers) Suite of SIM and eSIM products with access to over 600 networks in over 200 countries Highly available APIs for easy management of all SIM-embedded
devices Pre-installed multi-IMSI profile and Remote SIM Provisioning (RSP) to filter use to only local networks in instances of regulatory boundaries available in KORE eSIM offerings Enterprise-grade IoT hardware including telematics
devices, sensors, asset trackers and fixed-wireless routers / gateways Outsourced platform-enabled services (e.g., logistics, configuration, device management) General device testing as well as certification testing for government and
industry compliance Revenue Model Recurring revenue, per subscriber per month for lifetime of device (7-10 years) Multi-year contracts with automatic renewals Upfront fee per device or per device per month Target Customer Enterprise /
mid-market customers across multiple key industry verticals Customer IoT Use Cases Connected Health Fleet Management EV Charging Infrastructure Retail Renewables & Utilities Smart Agriculture 7
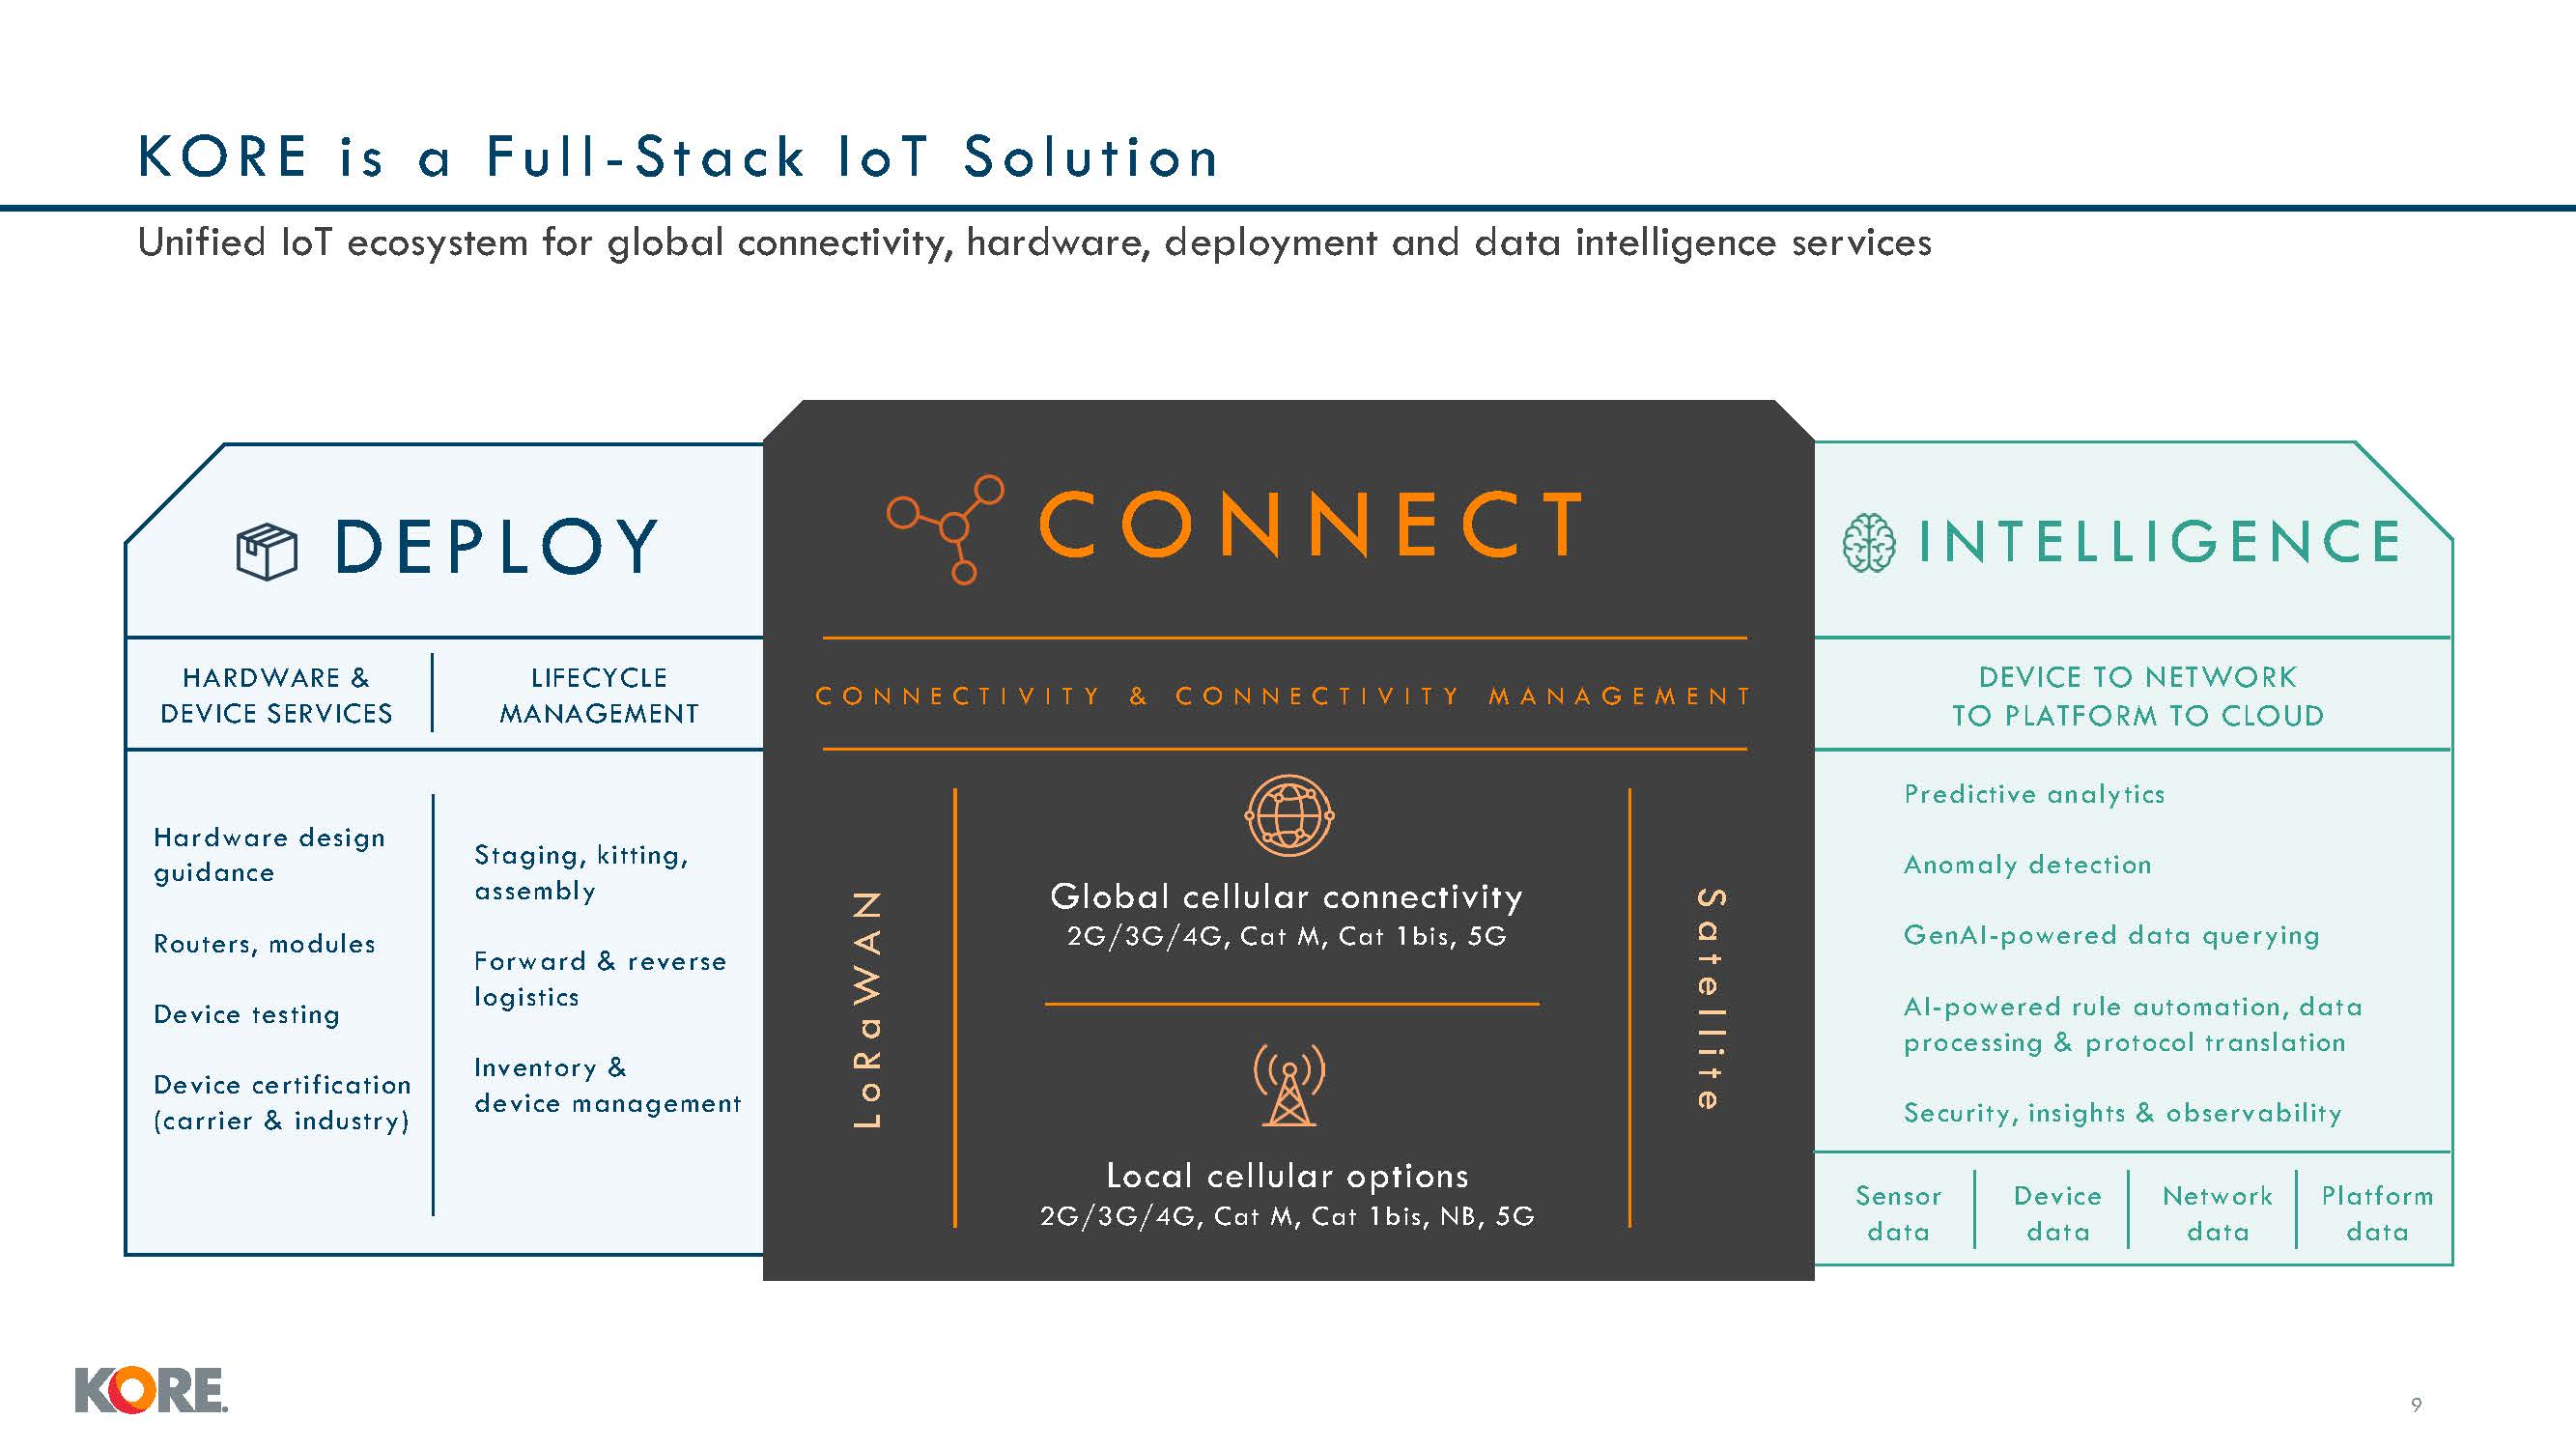
DEVICE TO NETWORK TO PLATFORM TO CLOUD L o R a W A N S a t e l l i t e C O N N
E C T I V I T Y & C O N N E C T I V I T Y M A N A G E M E N T Hardware design guidance Routers, modules Device testing Device certification (carrier & industry) Staging, kitting, assembly Forward & reverse logistics Inventory
& device management HARDWARE & DEVICE SERVICES LIFECYCLE MANAGEMENT Predictive analytics Anomaly detection GenAI-powered data querying AI-powered rule automation, data processing & protocol translation Security, insights
& observability Sensor data Device data Platform data Network data DEPLOY I N T E L L I G E N C E C O N N E C T Local cellular options 2G/3G/4G, Cat M, Cat 1bis, NB, 5G Global cellular connectivity 2G/3G/4G, Cat M, Cat 1bis,
5G KORE i s a F u l l - S tac k I o T Solu t i on Unified IoT ecosystem for global connectivity, hardware, deployment and data intelligence services 7
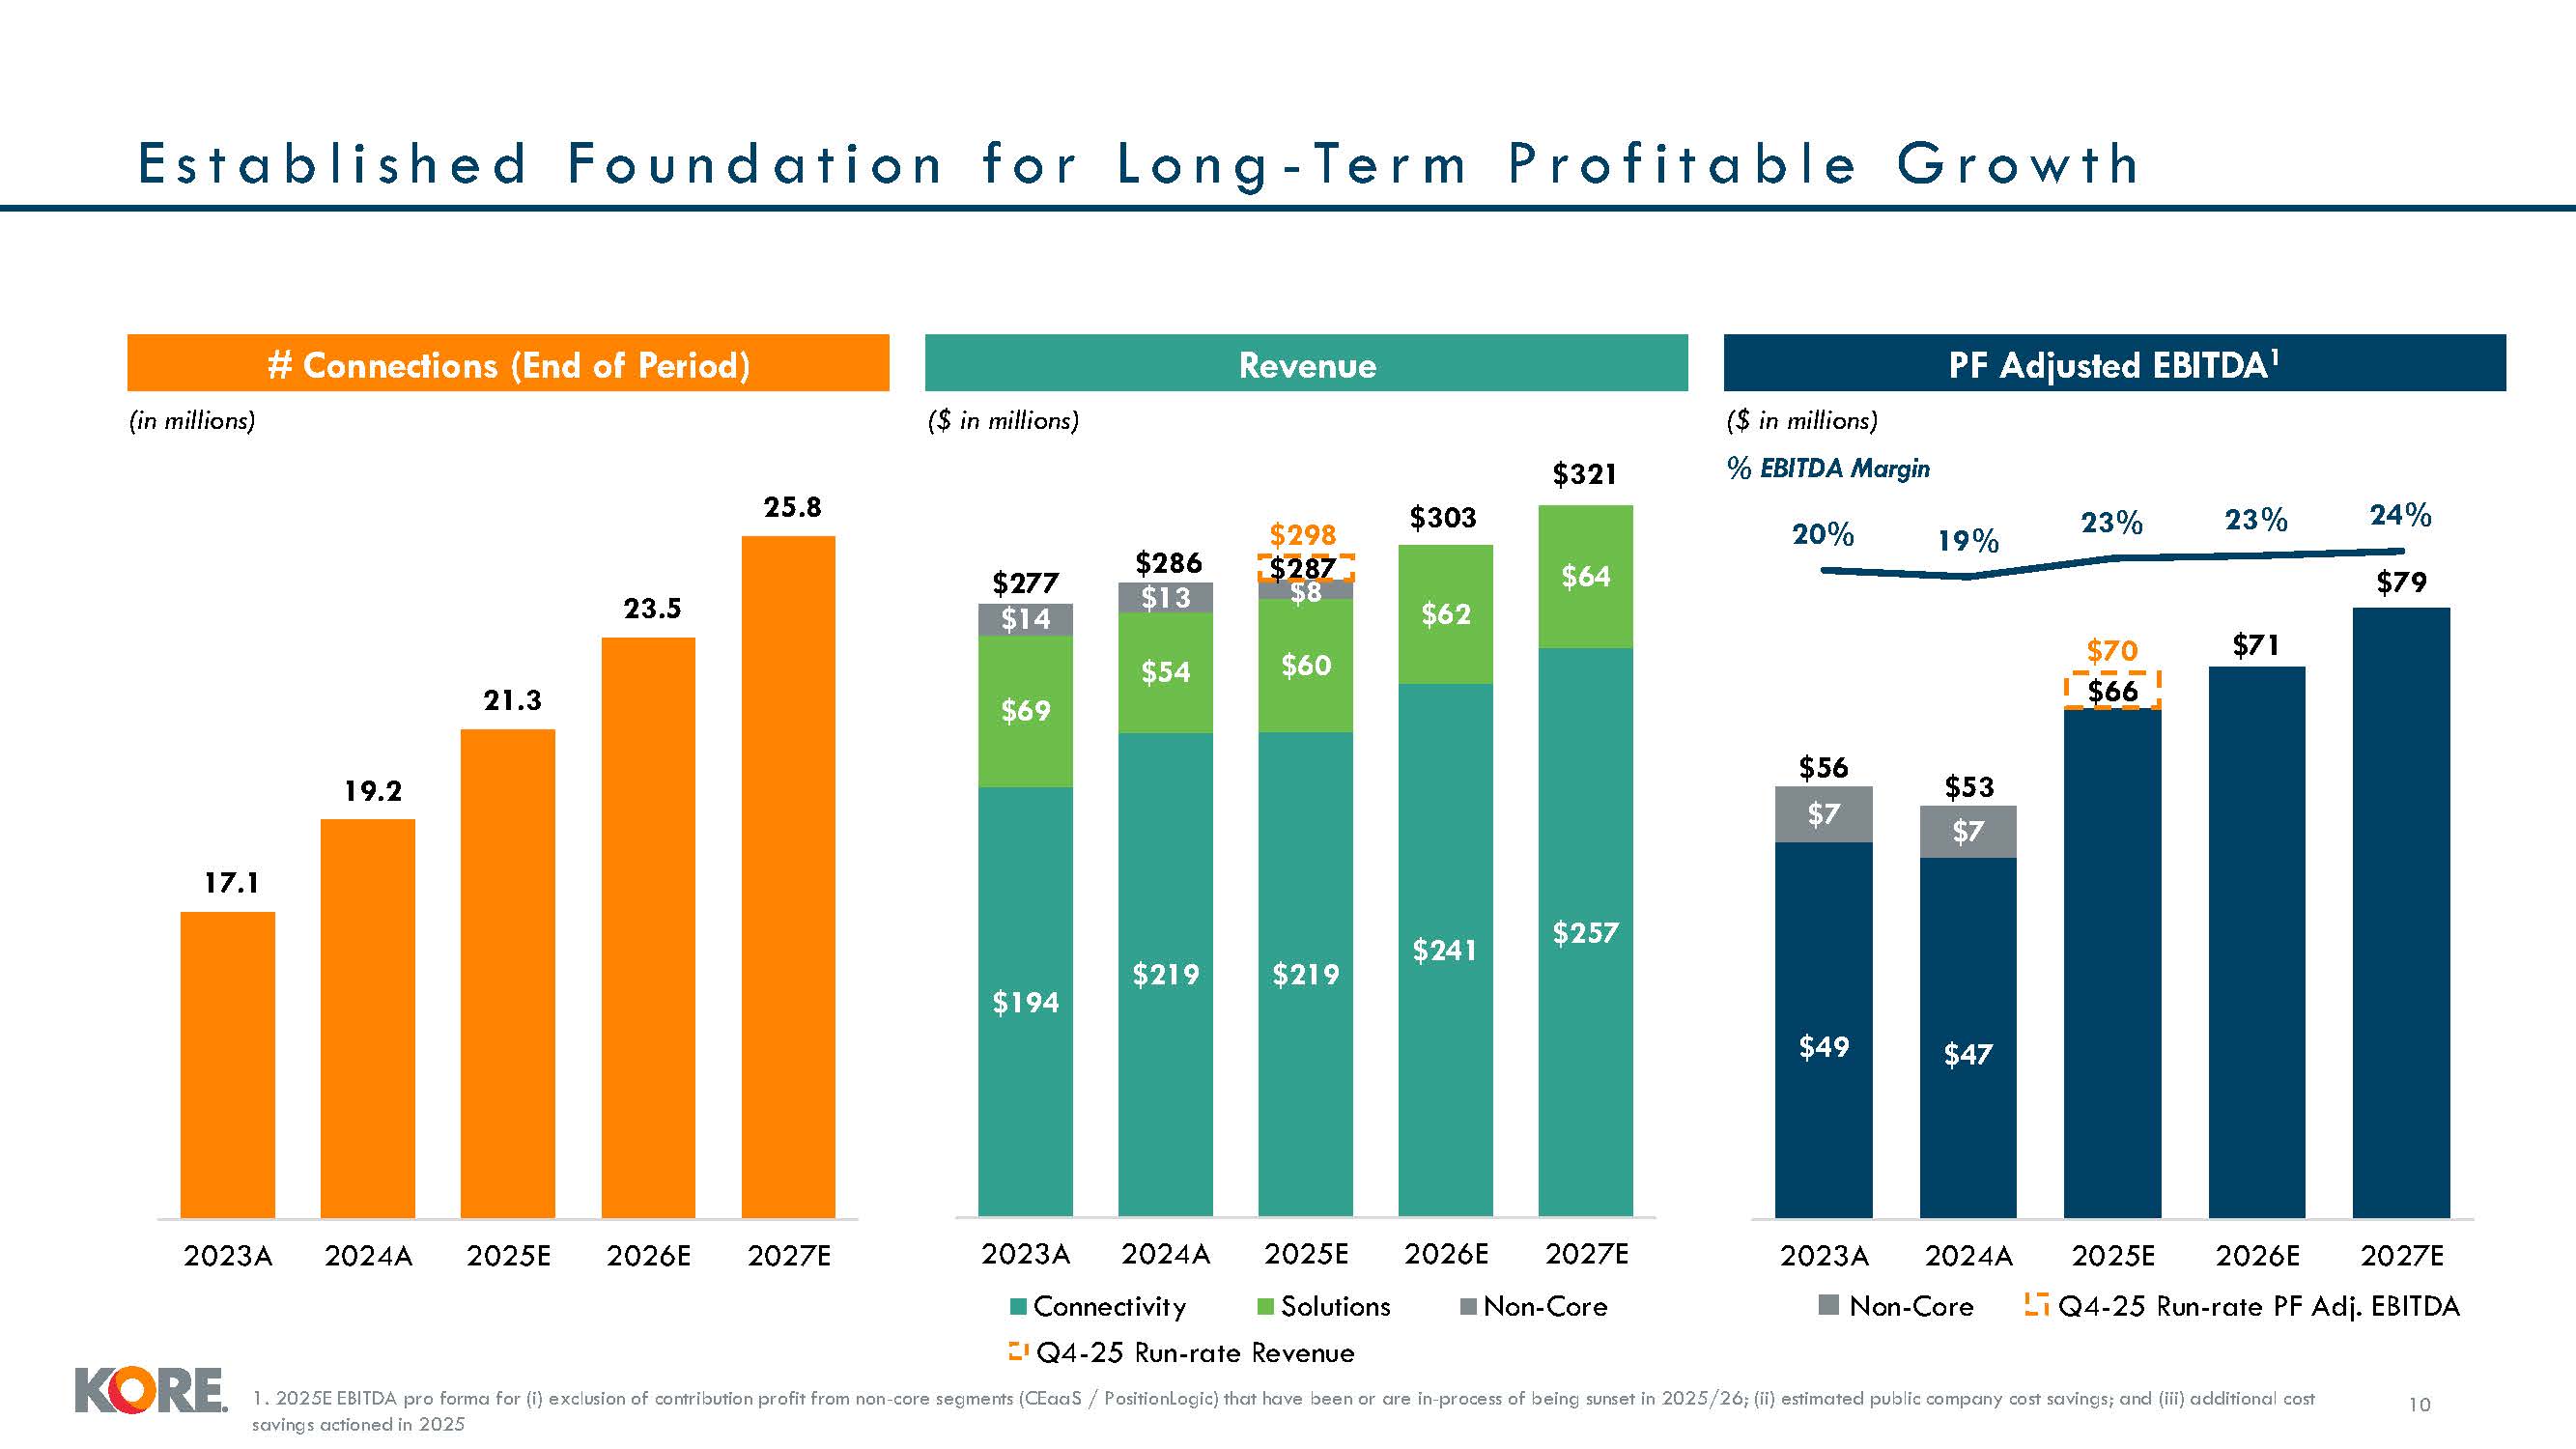
$49 $47 $7 $7 20% 19% $194 $219 $219 $241 $257 $69 $54 $60 $62 $64 $14 $13 $8 $277 $286 $287 $303 $321 2023A
2024A 2025E 2026E 2027E 2023A 2024A Connectivity 23% 23% 24% $79 $70 $71 $66 E s t a b l i s h e d F o u n d a t i o n f o r L o n g - Te r m P r o f i t a b l e G r o w t h 10 Revenue PF Adjusted EBITDA1 # Connections (End of
Period) (in millions) ($ in millions) ($ in millions) % EBITDA Margin 17.1 19.2 21.3 23.5 25.8 $298 $53 $56 2025E 2026E 2027E 2023A 2024A 2025E 2026E 2027E Solutions Non-Core Non-Core Q4-25 Run-rate PF Adj. EBITDA Q4-25 Run-rate
Revenue 1. 2025E EBITDA pro forma for (i) exclusion of contribution profit from non-core segments (CEaaS / PositionLogic) that have been or are in-process of being sunset in 2025/26; (ii) estimated public company cost savings; and (iii)
additional cost savings actioned in 2025
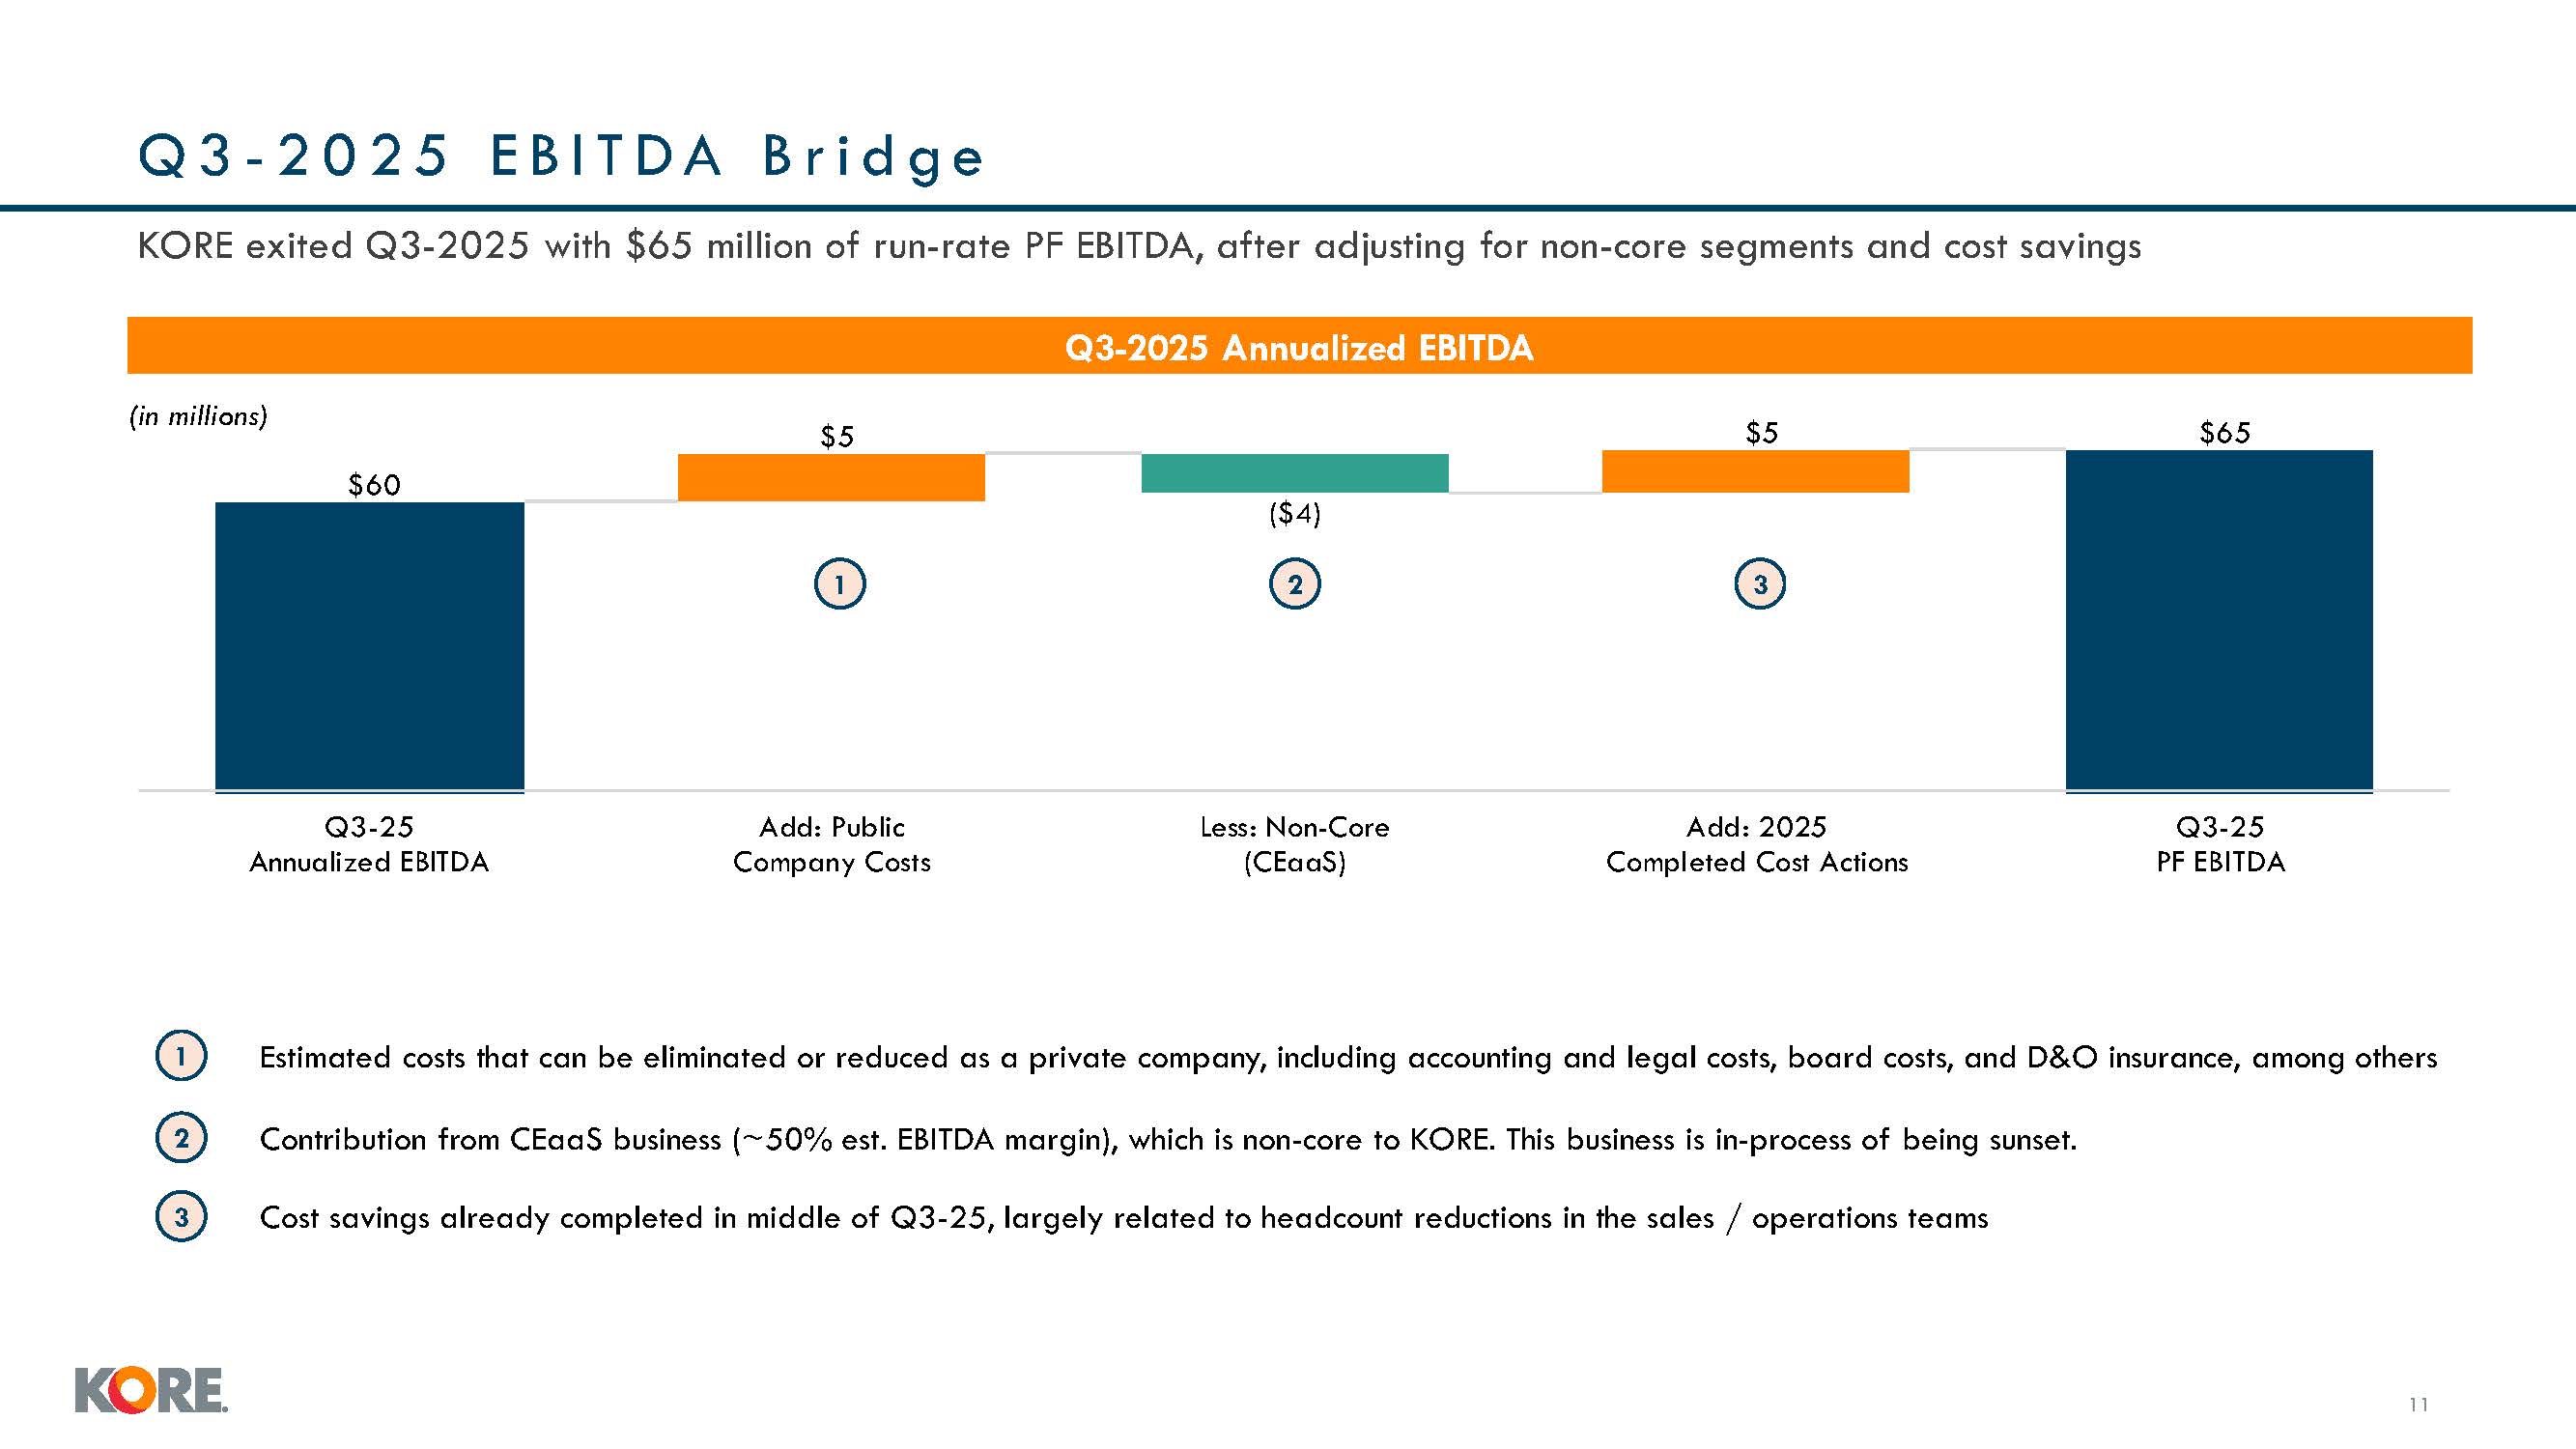
Q3-2025 Annualized EBITDA Q3 - 2 0 2 5 E B I T D A B r i d g e 11 (in
millions) 1 Estimated costs that can be eliminated or reduced as a private company, including accounting and legal costs, board costs, and D&O insurance, among others 1 2 3 2 3 Contribution from CEaaS business (~50% est. EBITDA
margin), which is non-core to KORE. This business is in-process of being sunset. KORE exited Q3-2025 with $65 million of run-rate PF EBITDA, after adjusting for non-core segments and cost savings Cost savings already completed in middle of
Q3-25, largely related to headcount reductions in the sales / operations teams ( ) 0 3 2 Annuali ed E ITDA Add Public Company Costs Less on Core (CEaaS) Add 202 Completed Cost Actions 3 2 P E ITDA
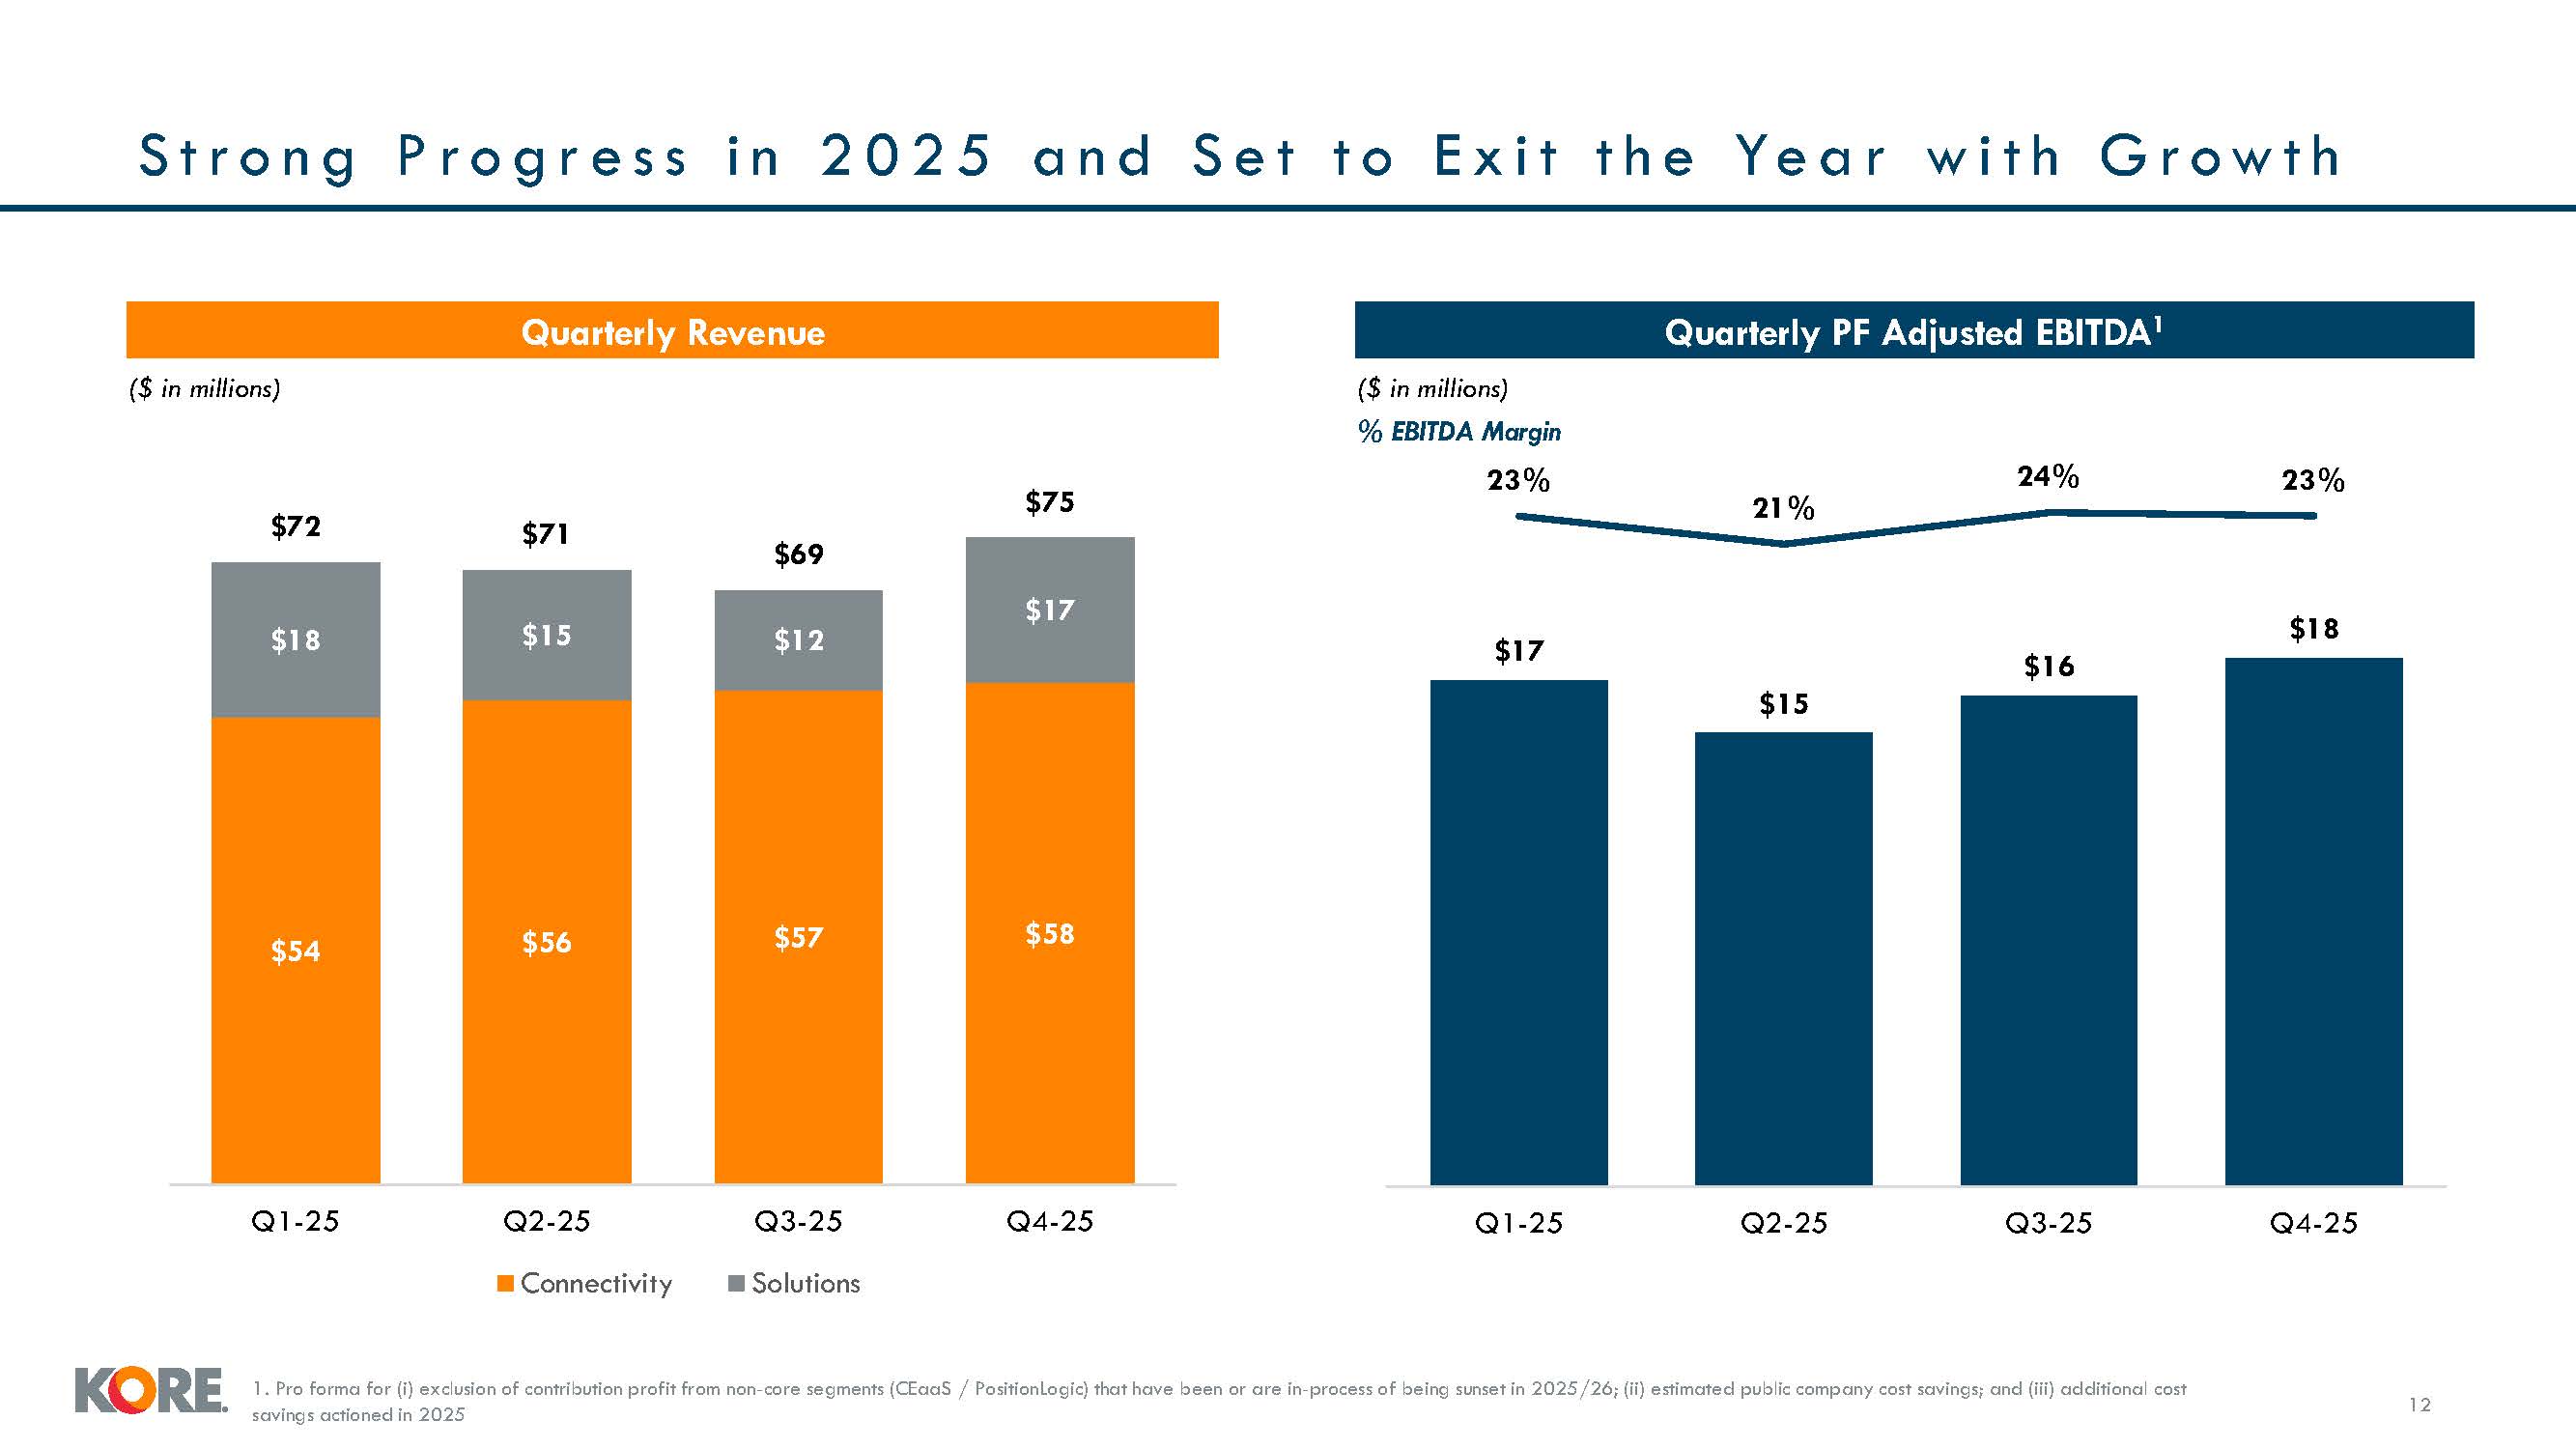
$54 $56 $57 $58 $18 $15 $12 $17 $72 $71 $69 $75 Q1-25 Q3-25 Solutions Q4-25 Q2-25 Connectivity S
t r o n g P r o g r e s s i n 2 0 2 5 a n d S e t t o E x i t t h e Ye a r w i t h G r o w t h 12 Quarterly Revenue Quarterly PF Adjusted EBITDA1 $17 $15 $16 $18 23% 21% 24% 23% Q1-25 Q2-25 Q3-25 Q4-25 ($ in millions) ($ in
millions) % EBITDA Margin 1. Pro forma for (i) exclusion of contribution profit from non-core segments (CEaaS / PositionLogic) that have been or are in-process of being sunset in 2025/26; (ii) estimated public company cost savings; and (iii)
additional cost savings actioned in 2025
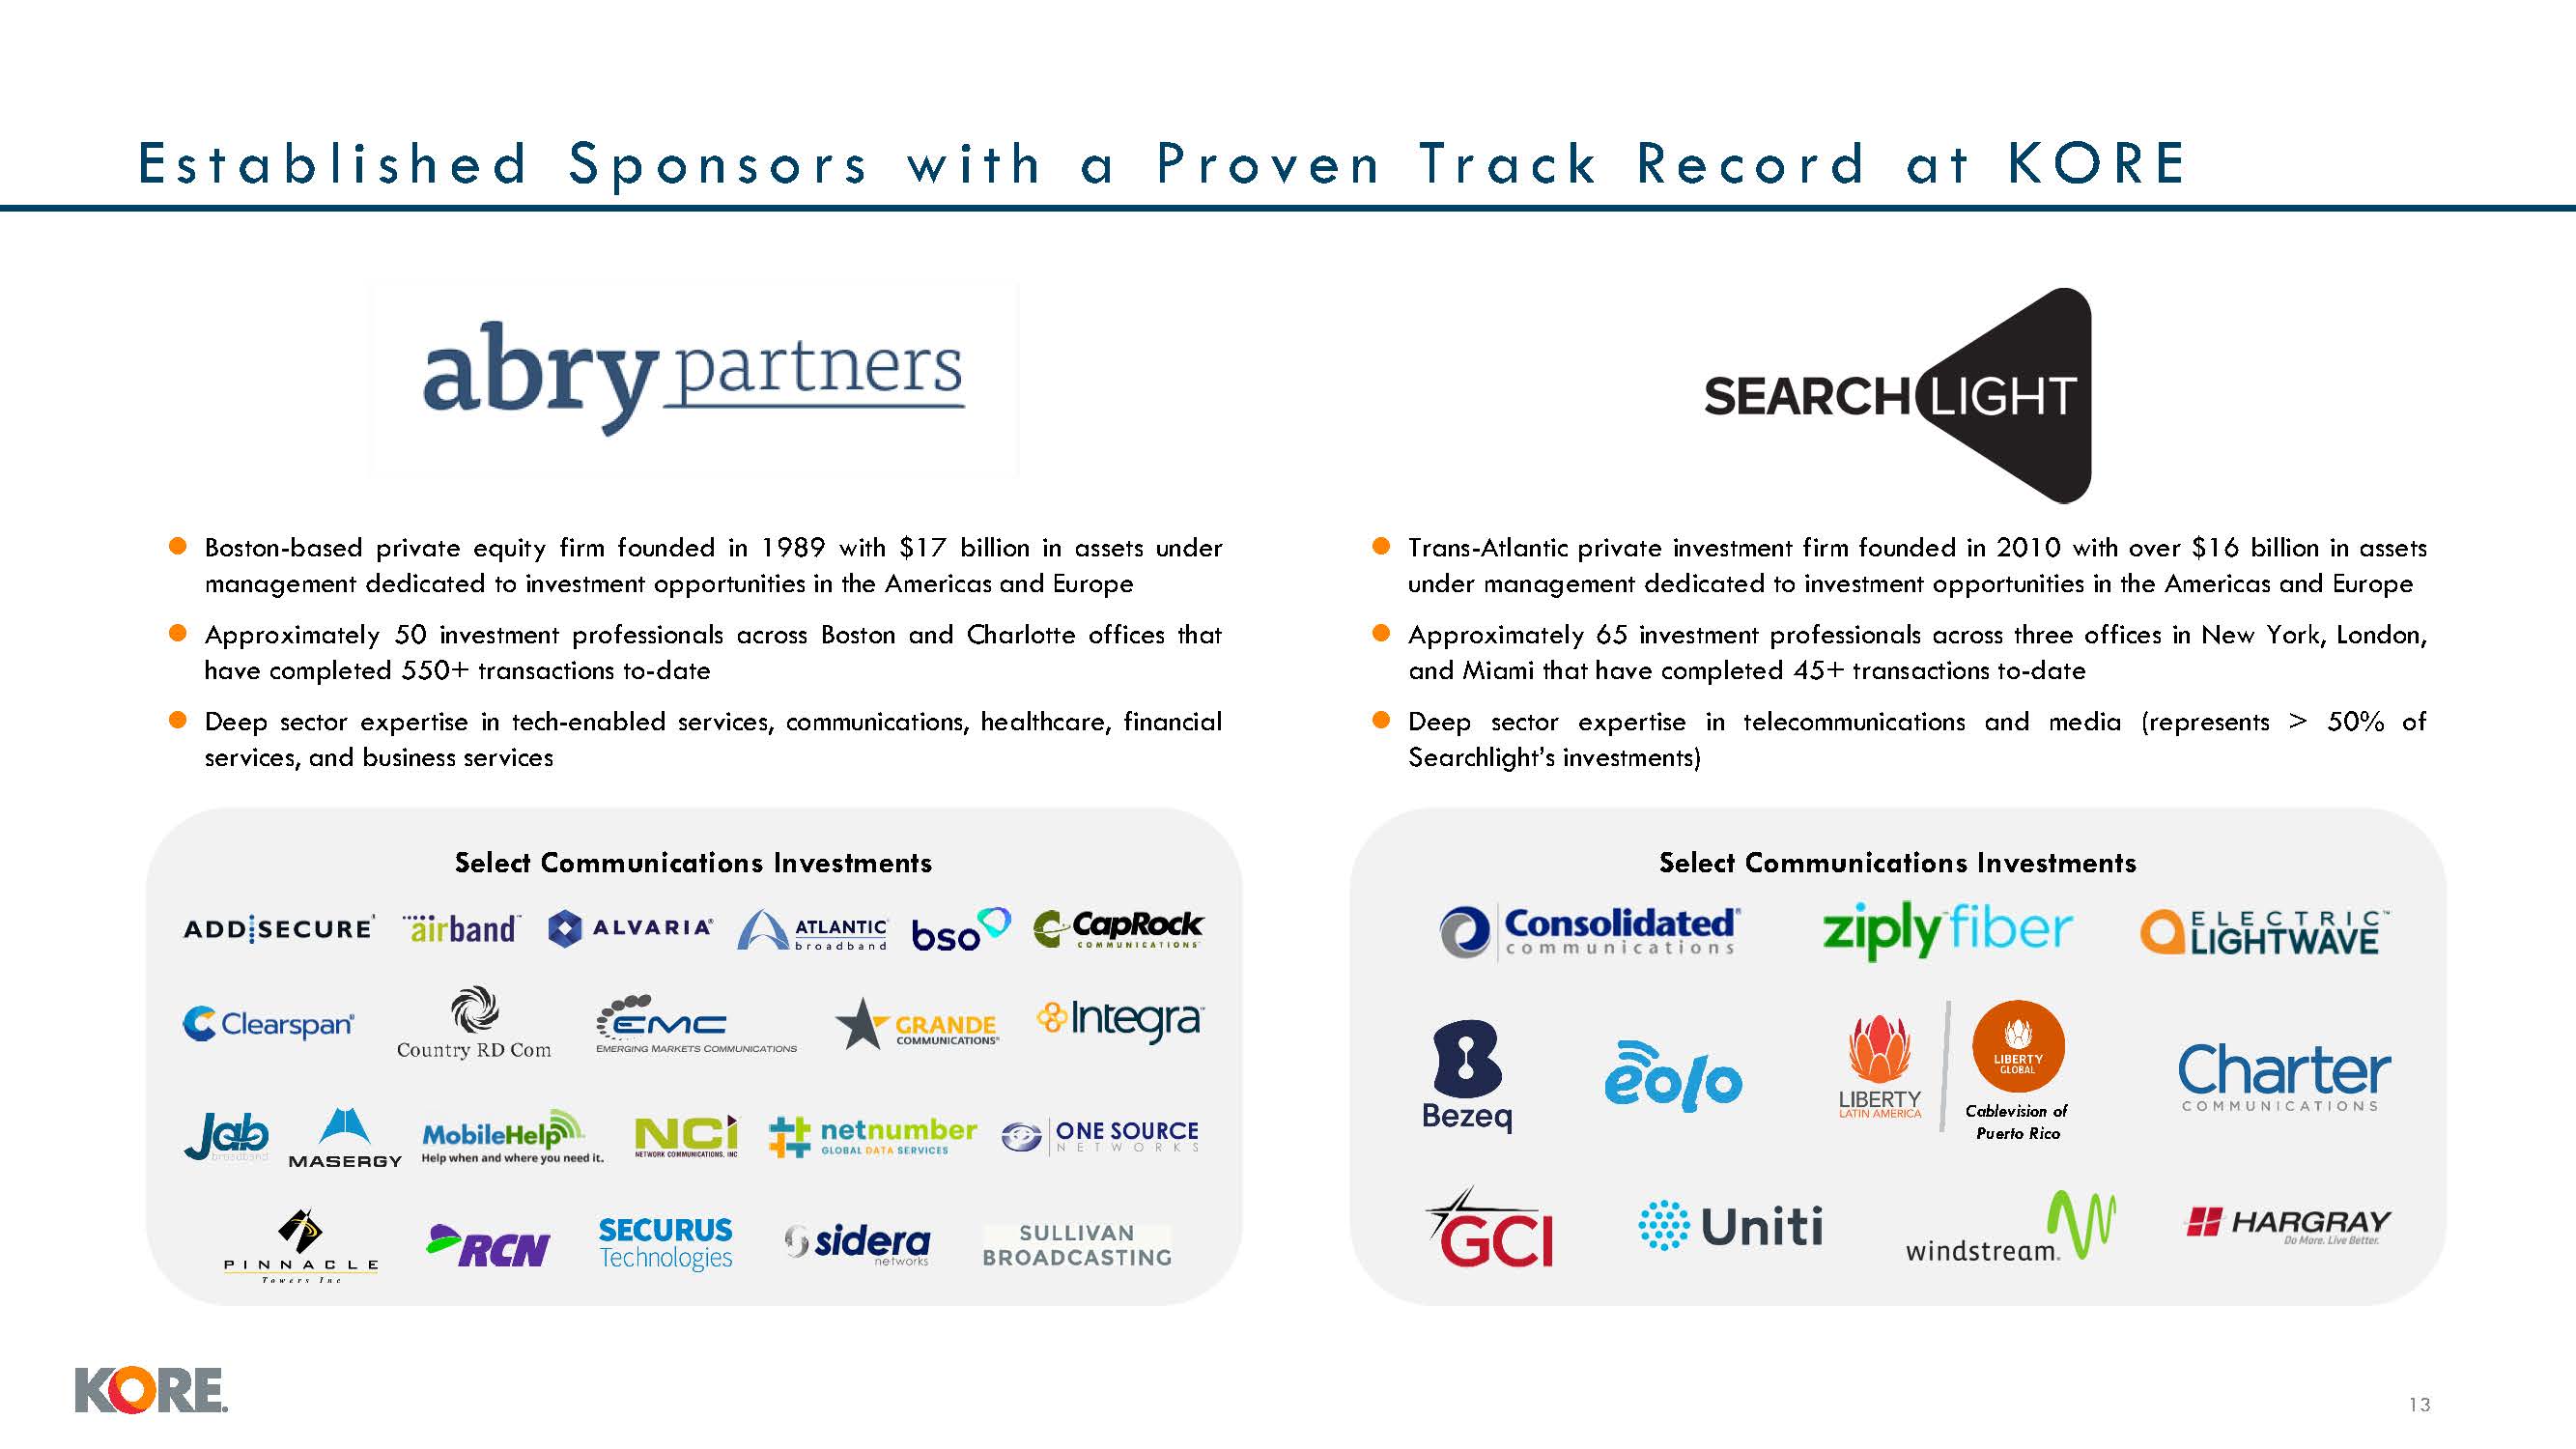
E s t a b l i s h e d S p o n s o r s w i t h a P r o v e n Tr a c k R e c o r d a
t K O R E Trans-Atlantic private investment firm founded in 2010 with over $16 billion in assets under management dedicated to investment opportunities in the Americas and Europe Approximately 65 investment professionals across three offices
in New York, London, and Miami that have completed 45+ transactions to-date Deep sector expertise in telecommunications and media (represents > 50% of Searchlight’s investments) Select Communications Investments Cablevision of Puerto
Rico Boston-based private equity firm founded in 1989 with $17 billion in assets under management dedicated to investment opportunities in the Americas and Europe Approximately 50 investment professionals across Boston and Charlotte offices
that have completed 550+ transactions to-date Deep sector expertise in tech-enabled services, communications, healthcare, financial services, and business services Select Communications Investments 13
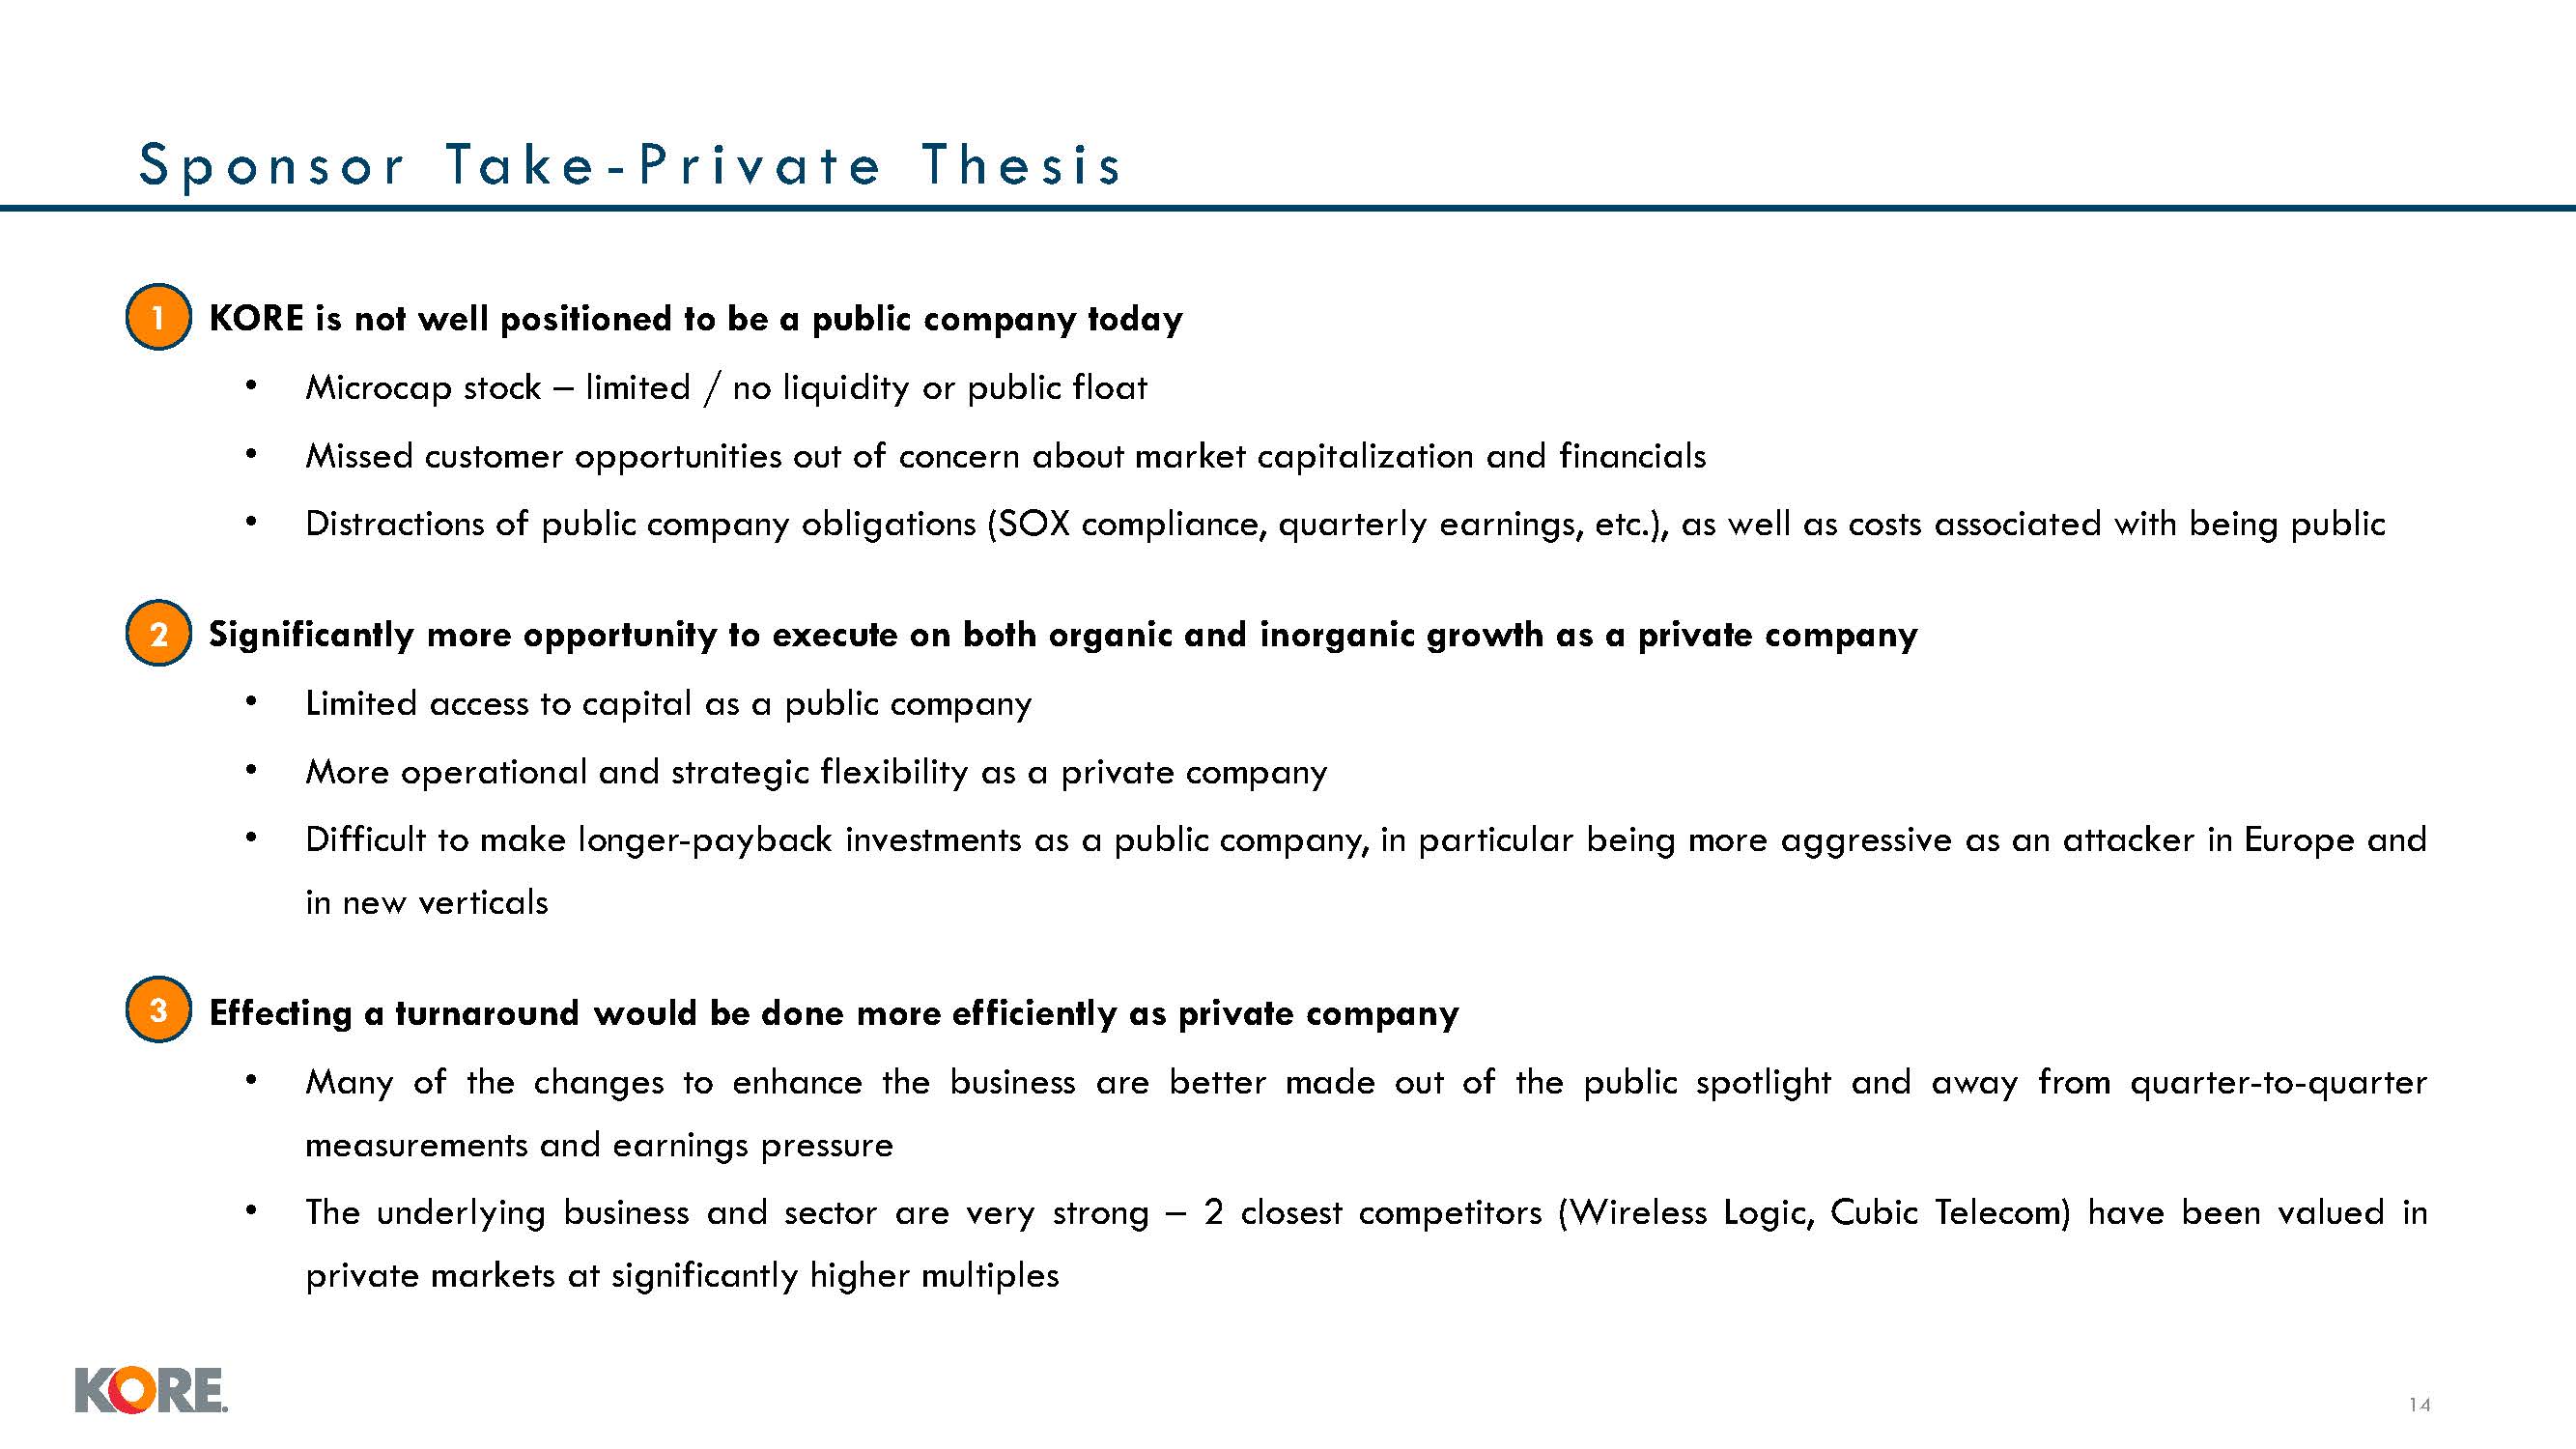
S p o n s o r Ta k e - P r i v a t e T h e s i s •1 KORE is not well positioned
to be a public company today Microcap stock – limited / no liquidity or public float Missed customer opportunities out of concern about market capitalization and financials Distractions of public company obligations (SOX compliance,
quarterly earnings, etc.), as well as costs associated with being public •2 Significantly more opportunity to execute on both organic and inorganic growth as a private company Limited access to capital as a public company More operational
and strategic flexibility as a private company Difficult to make longer-payback investments as a public company, in particular being more aggressive as an attacker in Europe and in new verticals •3 Effecting a turnaround would be done more
efficiently as private company Many of the changes to enhance the business are better made out of the public spotlight and away from quarter-to-quarter measurements and earnings pressure The underlying business and sector are very strong – 2
closest competitors (Wireless Logic, Cubic Telecom) have been valued in private markets at significantly higher multiples 13

KORE’s Value Creation & Transformation (2023-25) Proprietary &
confidential to KORE Wireless |15
S t r a t e g i c Tr a n s f o r m a t i o n i n t o a P u r e - P l a y I o T C o
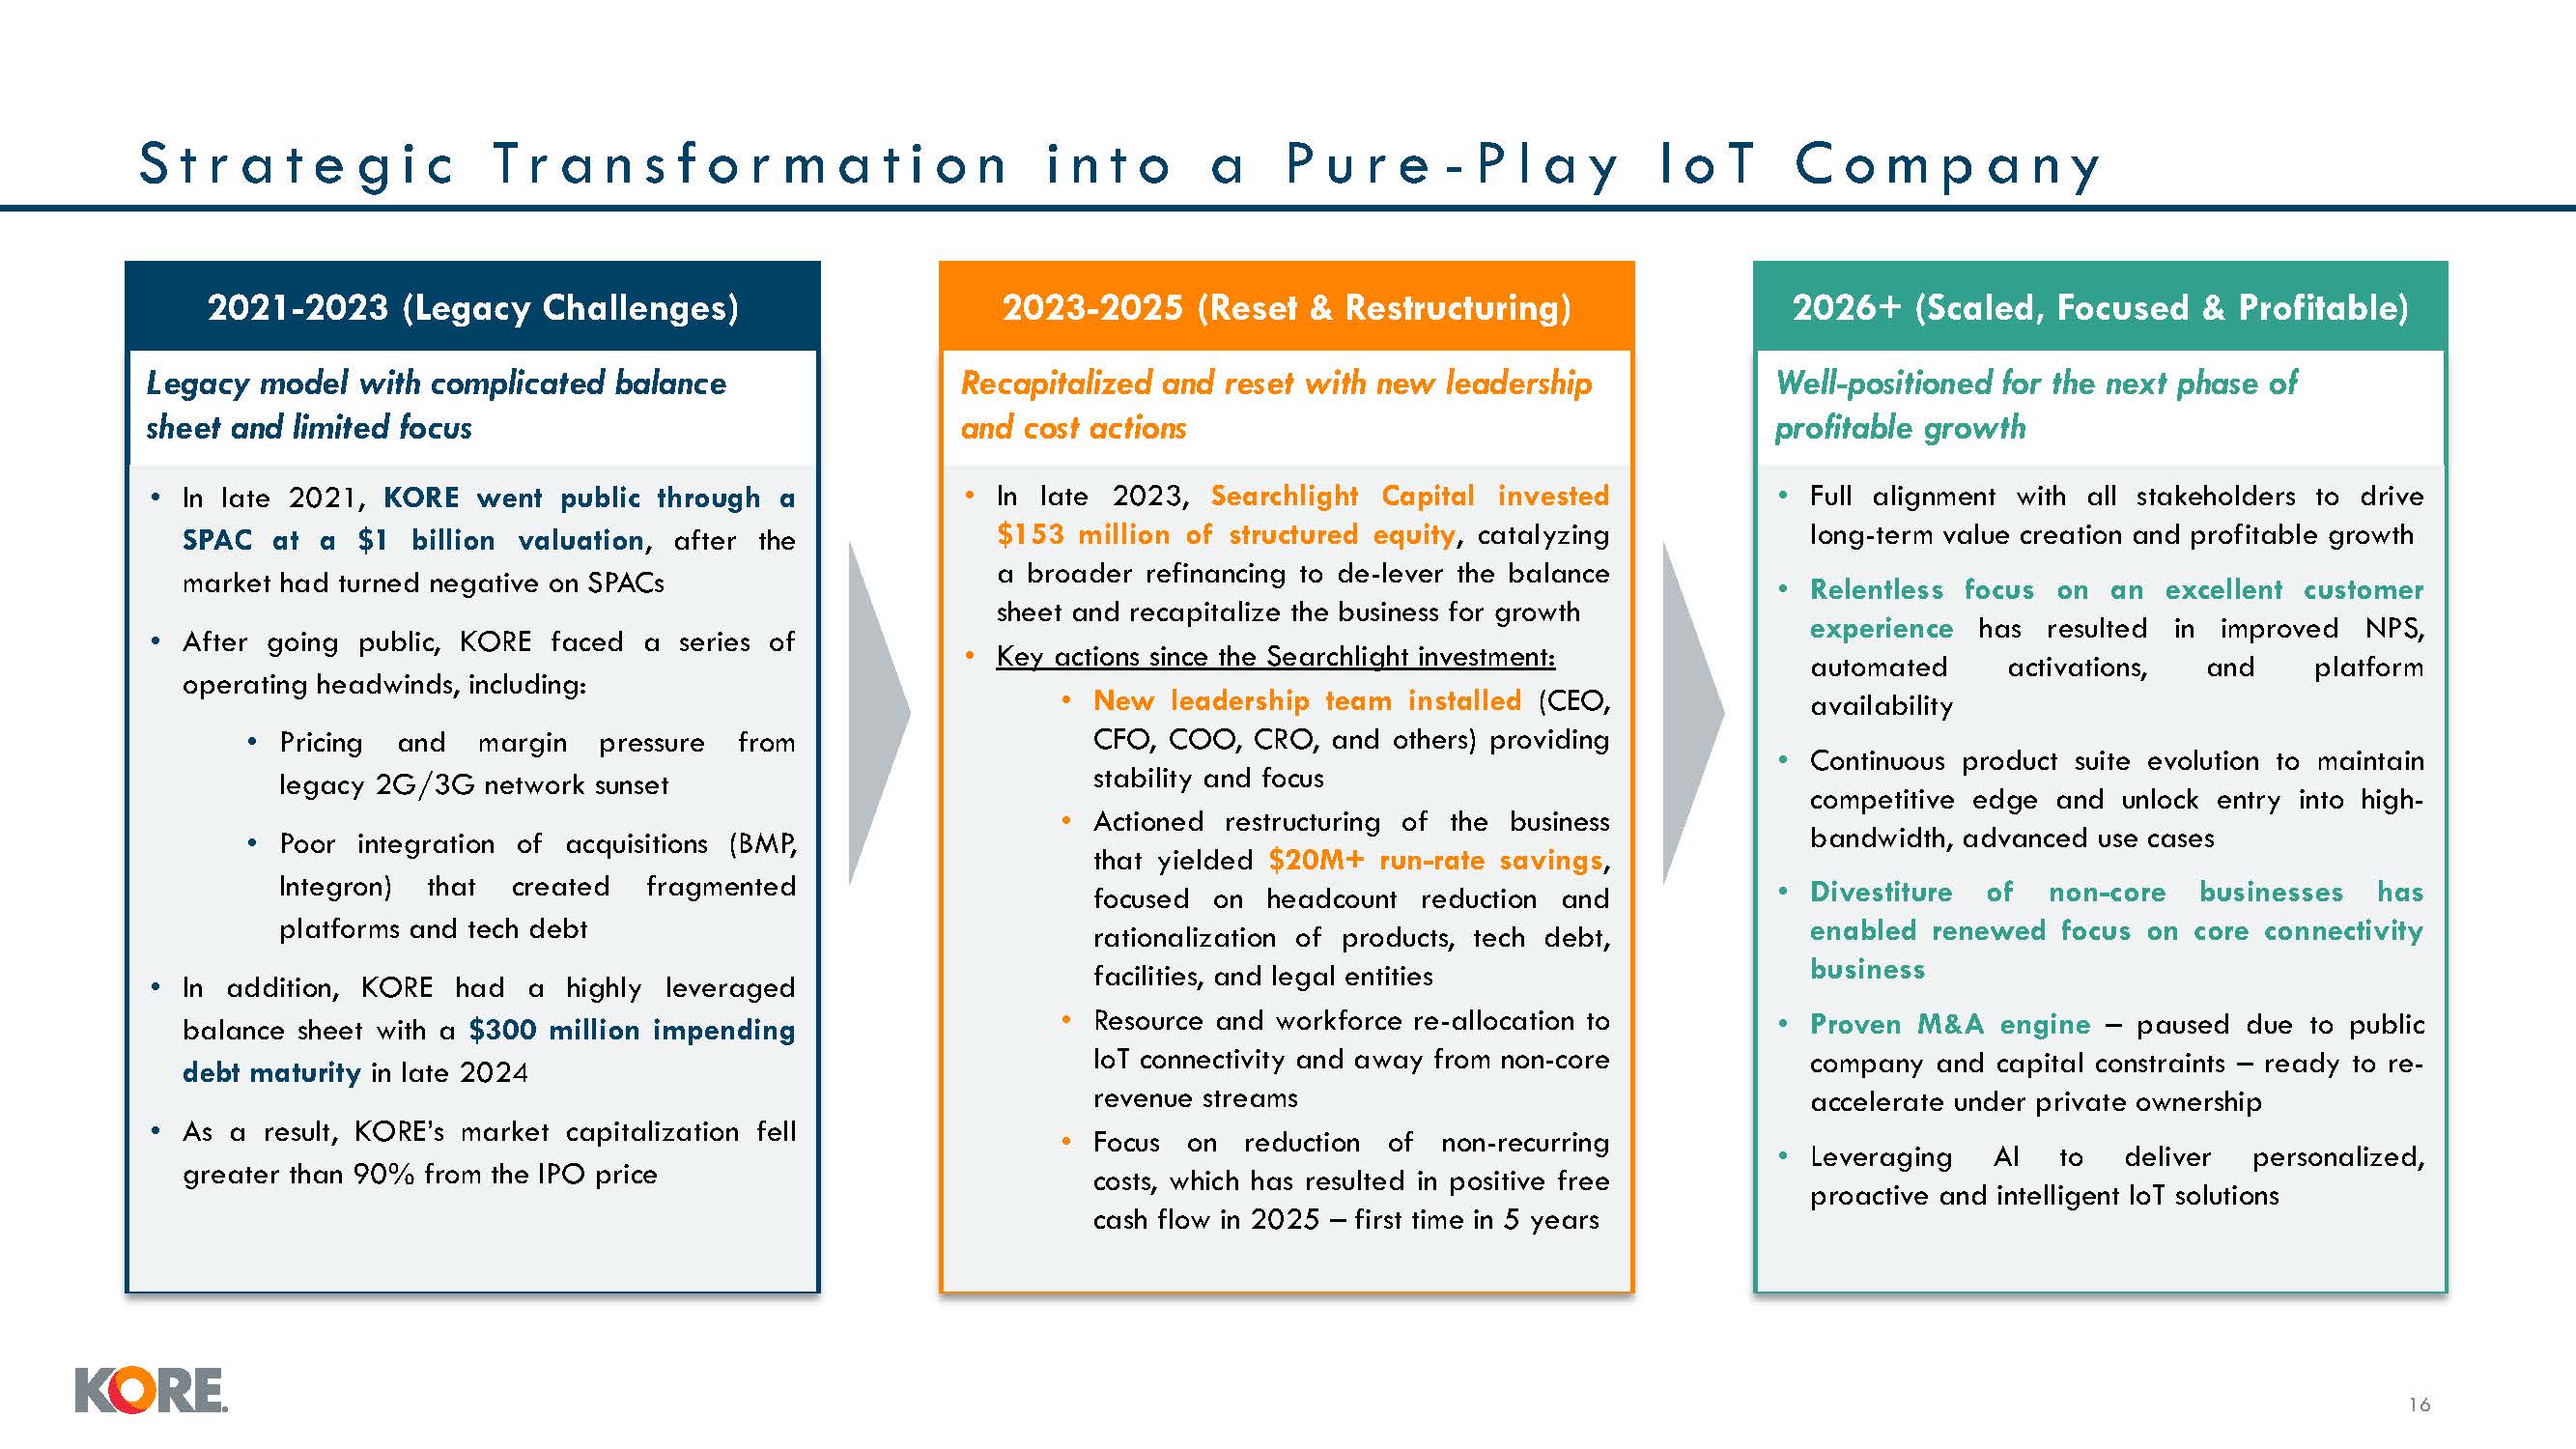
m p a n y 2021-2023 (Legacy Challenges) Legacy model with complicated balance sheet and limited focus 2023-2025 (Reset & Restructuring) Recapitalized and reset with new leadership and cost actions 2026+ (Scaled, Focused &
Profitable) Well-positioned for the next phase of profitable growth In late 2021, KORE went public through a SPAC at a $1 billion valuation, after the market had turned negative on SPACs After going public, KORE faced a series of operating
headwinds, including: Pricing and margin pressure from legacy 2G/3G network sunset Poor integration of acquisitions (BMP, Integron) that created fragmented platforms and tech debt In addition, KORE had a highly leveraged balance sheet with
a $300 million impending debt maturity in late 2024 As a result, KORE’s market capitalization fell greater than 90% from the IPO price In late 2023, Searchlight Capital invested $153 million of structured equity, catalyzing a broader
refinancing to de-lever the balance sheet and recapitalize the business for growth Key actions since the Searchlight investment: New leadership team installed (CEO, CFO, COO, CRO, and others) providing stability and focus Actioned
restructuring of the business that yielded $20M+ run-rate savings, focused on headcount reduction and rationalization of products, tech debt, facilities, and legal entities Resource and workforce re-allocation to IoT connectivity and away
from non-core revenue streams Focus on reduction of non-recurring costs, which has resulted in positive free cash flow in 2025 – first time in 5 years Full alignment with all stakeholders to drive long-term value creation and profitable
growth Relentless focus on an excellent customer experience has resulted in improved NPS, automated activations, and platform availability Continuous product suite evolution to maintain competitive edge and unlock entry into high-bandwidth,
advanced use cases Divestiture of non-core businesses has enabled renewed focus on core connectivity business Proven M&A engine – paused due to public company and capital constraints – ready to re-accelerate under private ownership
Leveraging AI to deliver personalized, proactive and intelligent IoT solutions 16
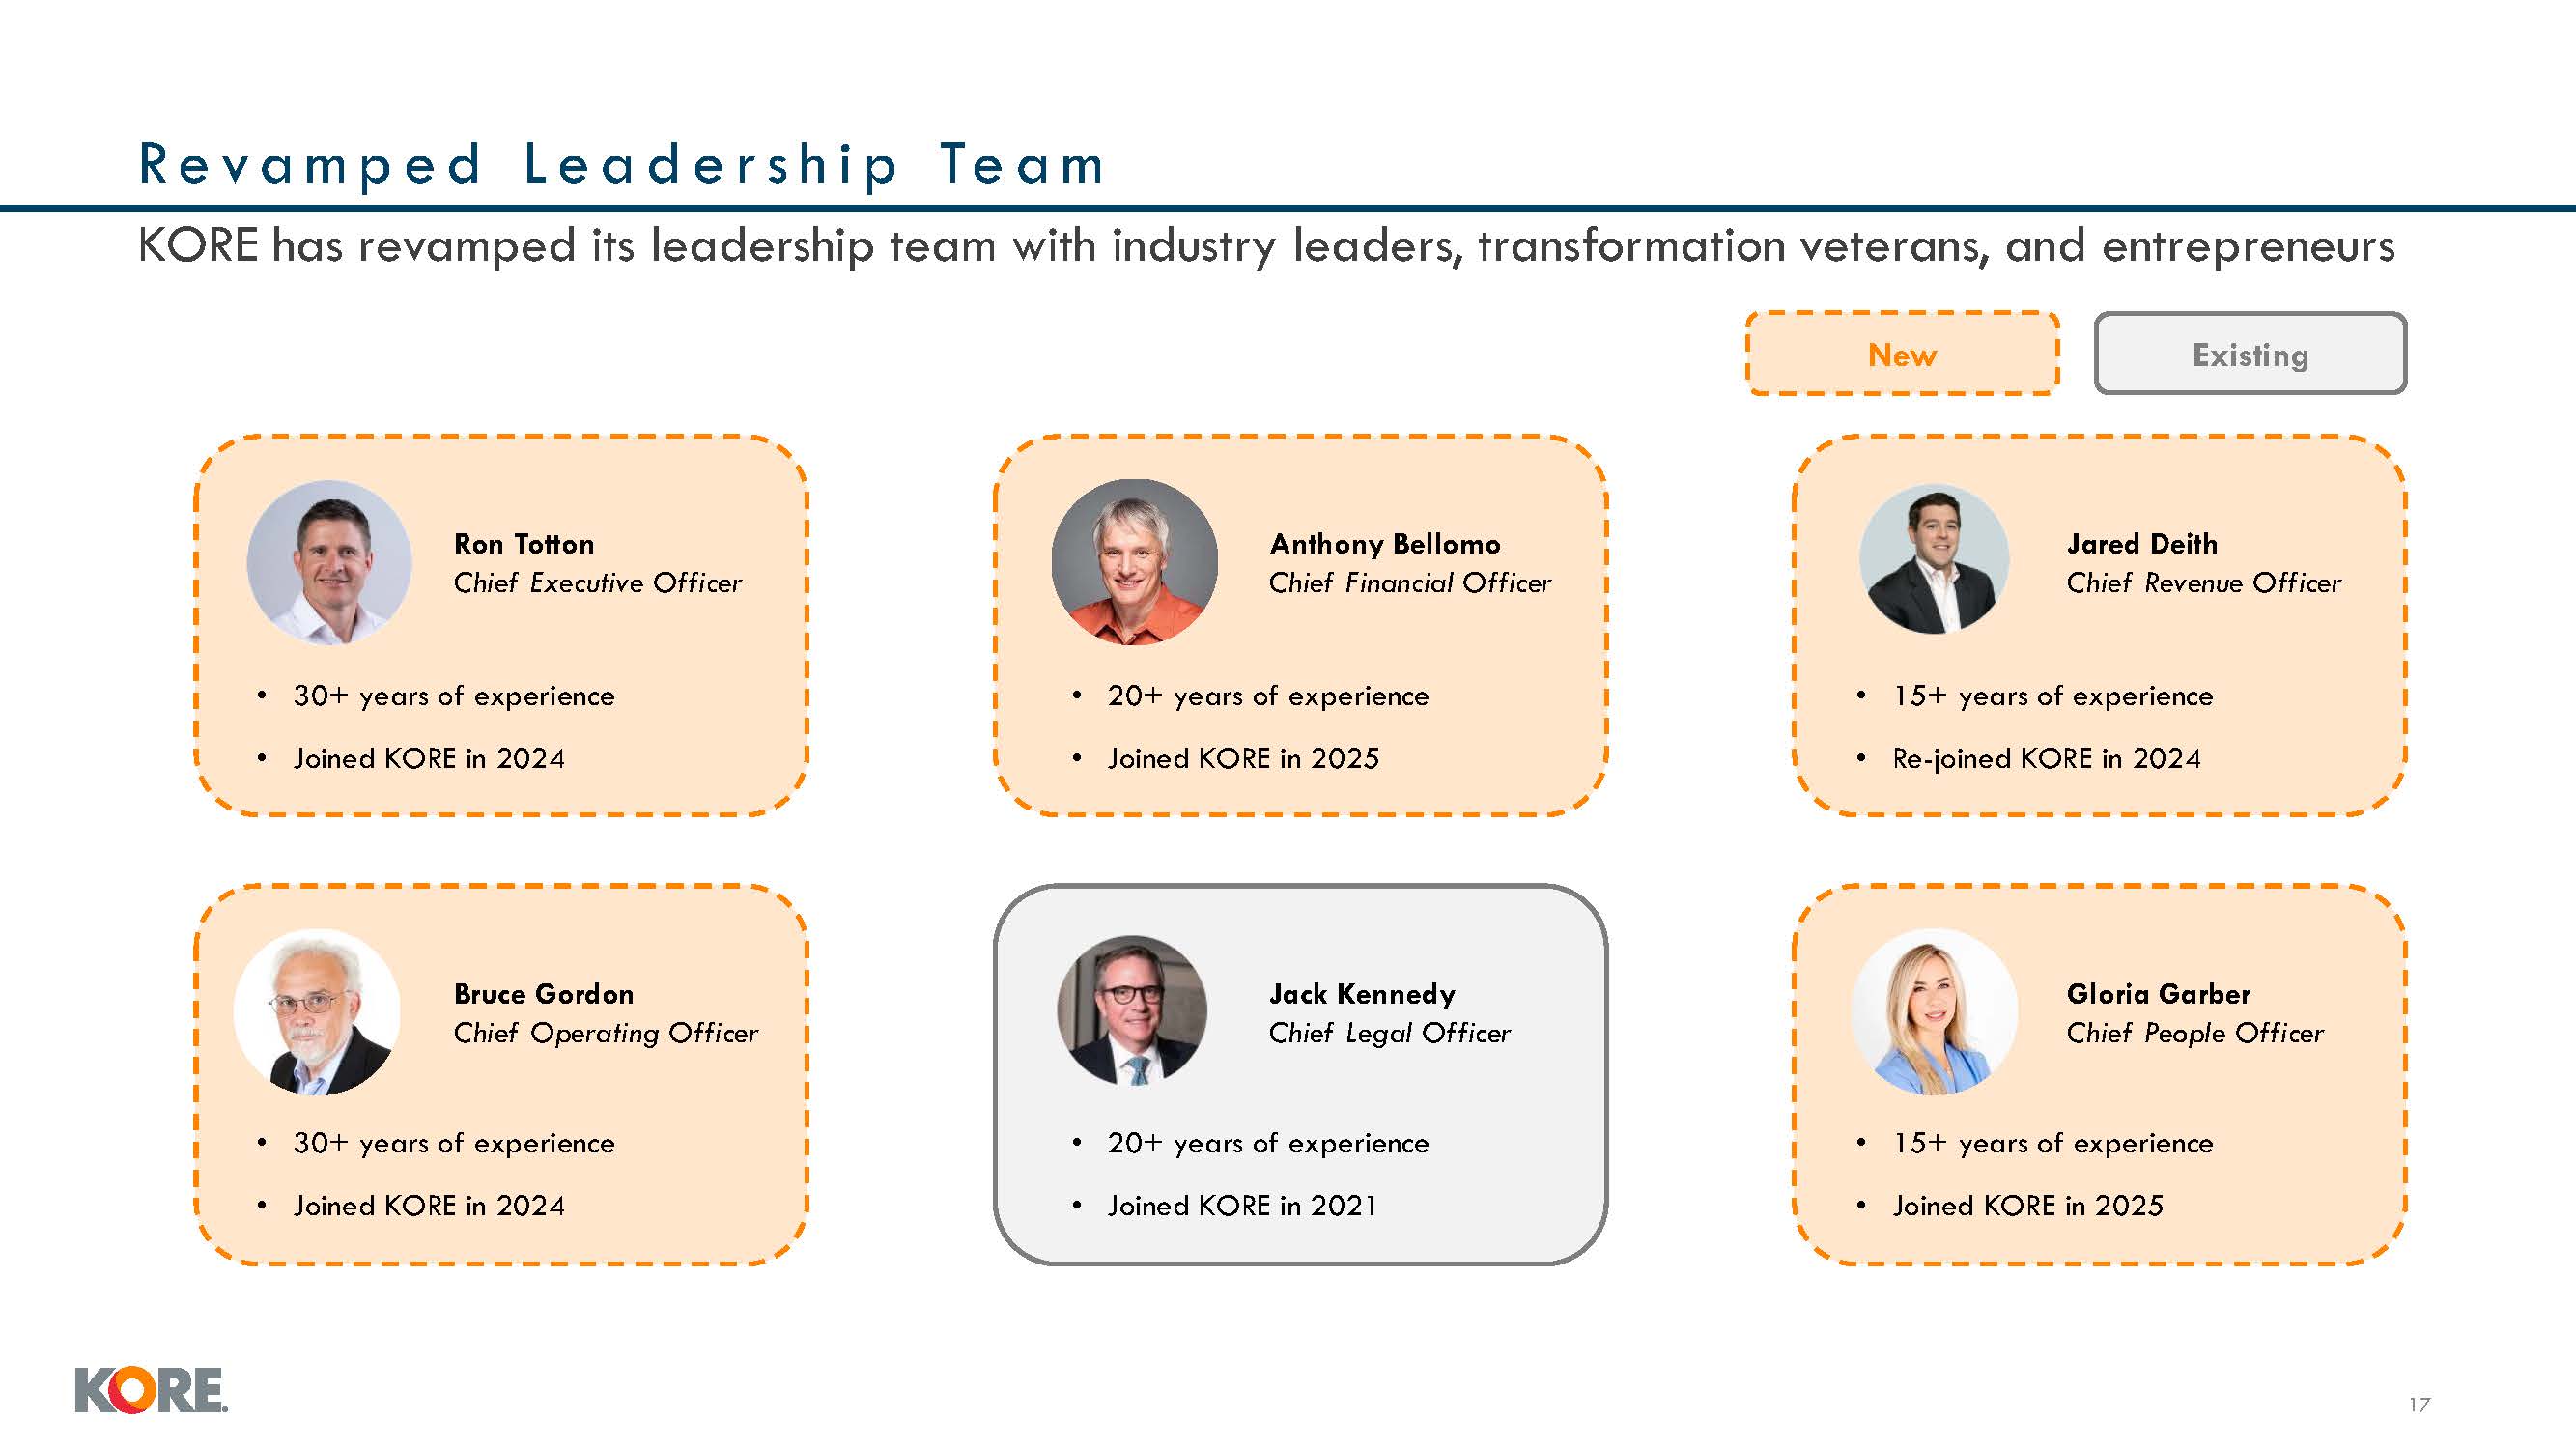
R e v a m p e d L e a d e r s h i p Te a m Ron Totton Chief Executive
Officer Bruce Gordon Chief Operating Officer Jared Deith Chief Revenue Officer Anthony Bellomo Chief Financial Officer Jack Kennedy Chief Legal Officer Gloria Garber Chief People Officer KORE has revamped its leadership team with
industry leaders, transformation veterans, and entrepreneurs New Existing 30+ years of experience Joined KORE in 2024 16 30+ years of experience Joined KORE in 2024 20+ years of experience Joined KORE in 2021 15+ years of
experience Joined KORE in 2025 20+ years of experience Joined KORE in 2025 15+ years of experience Re-joined KORE in 2024
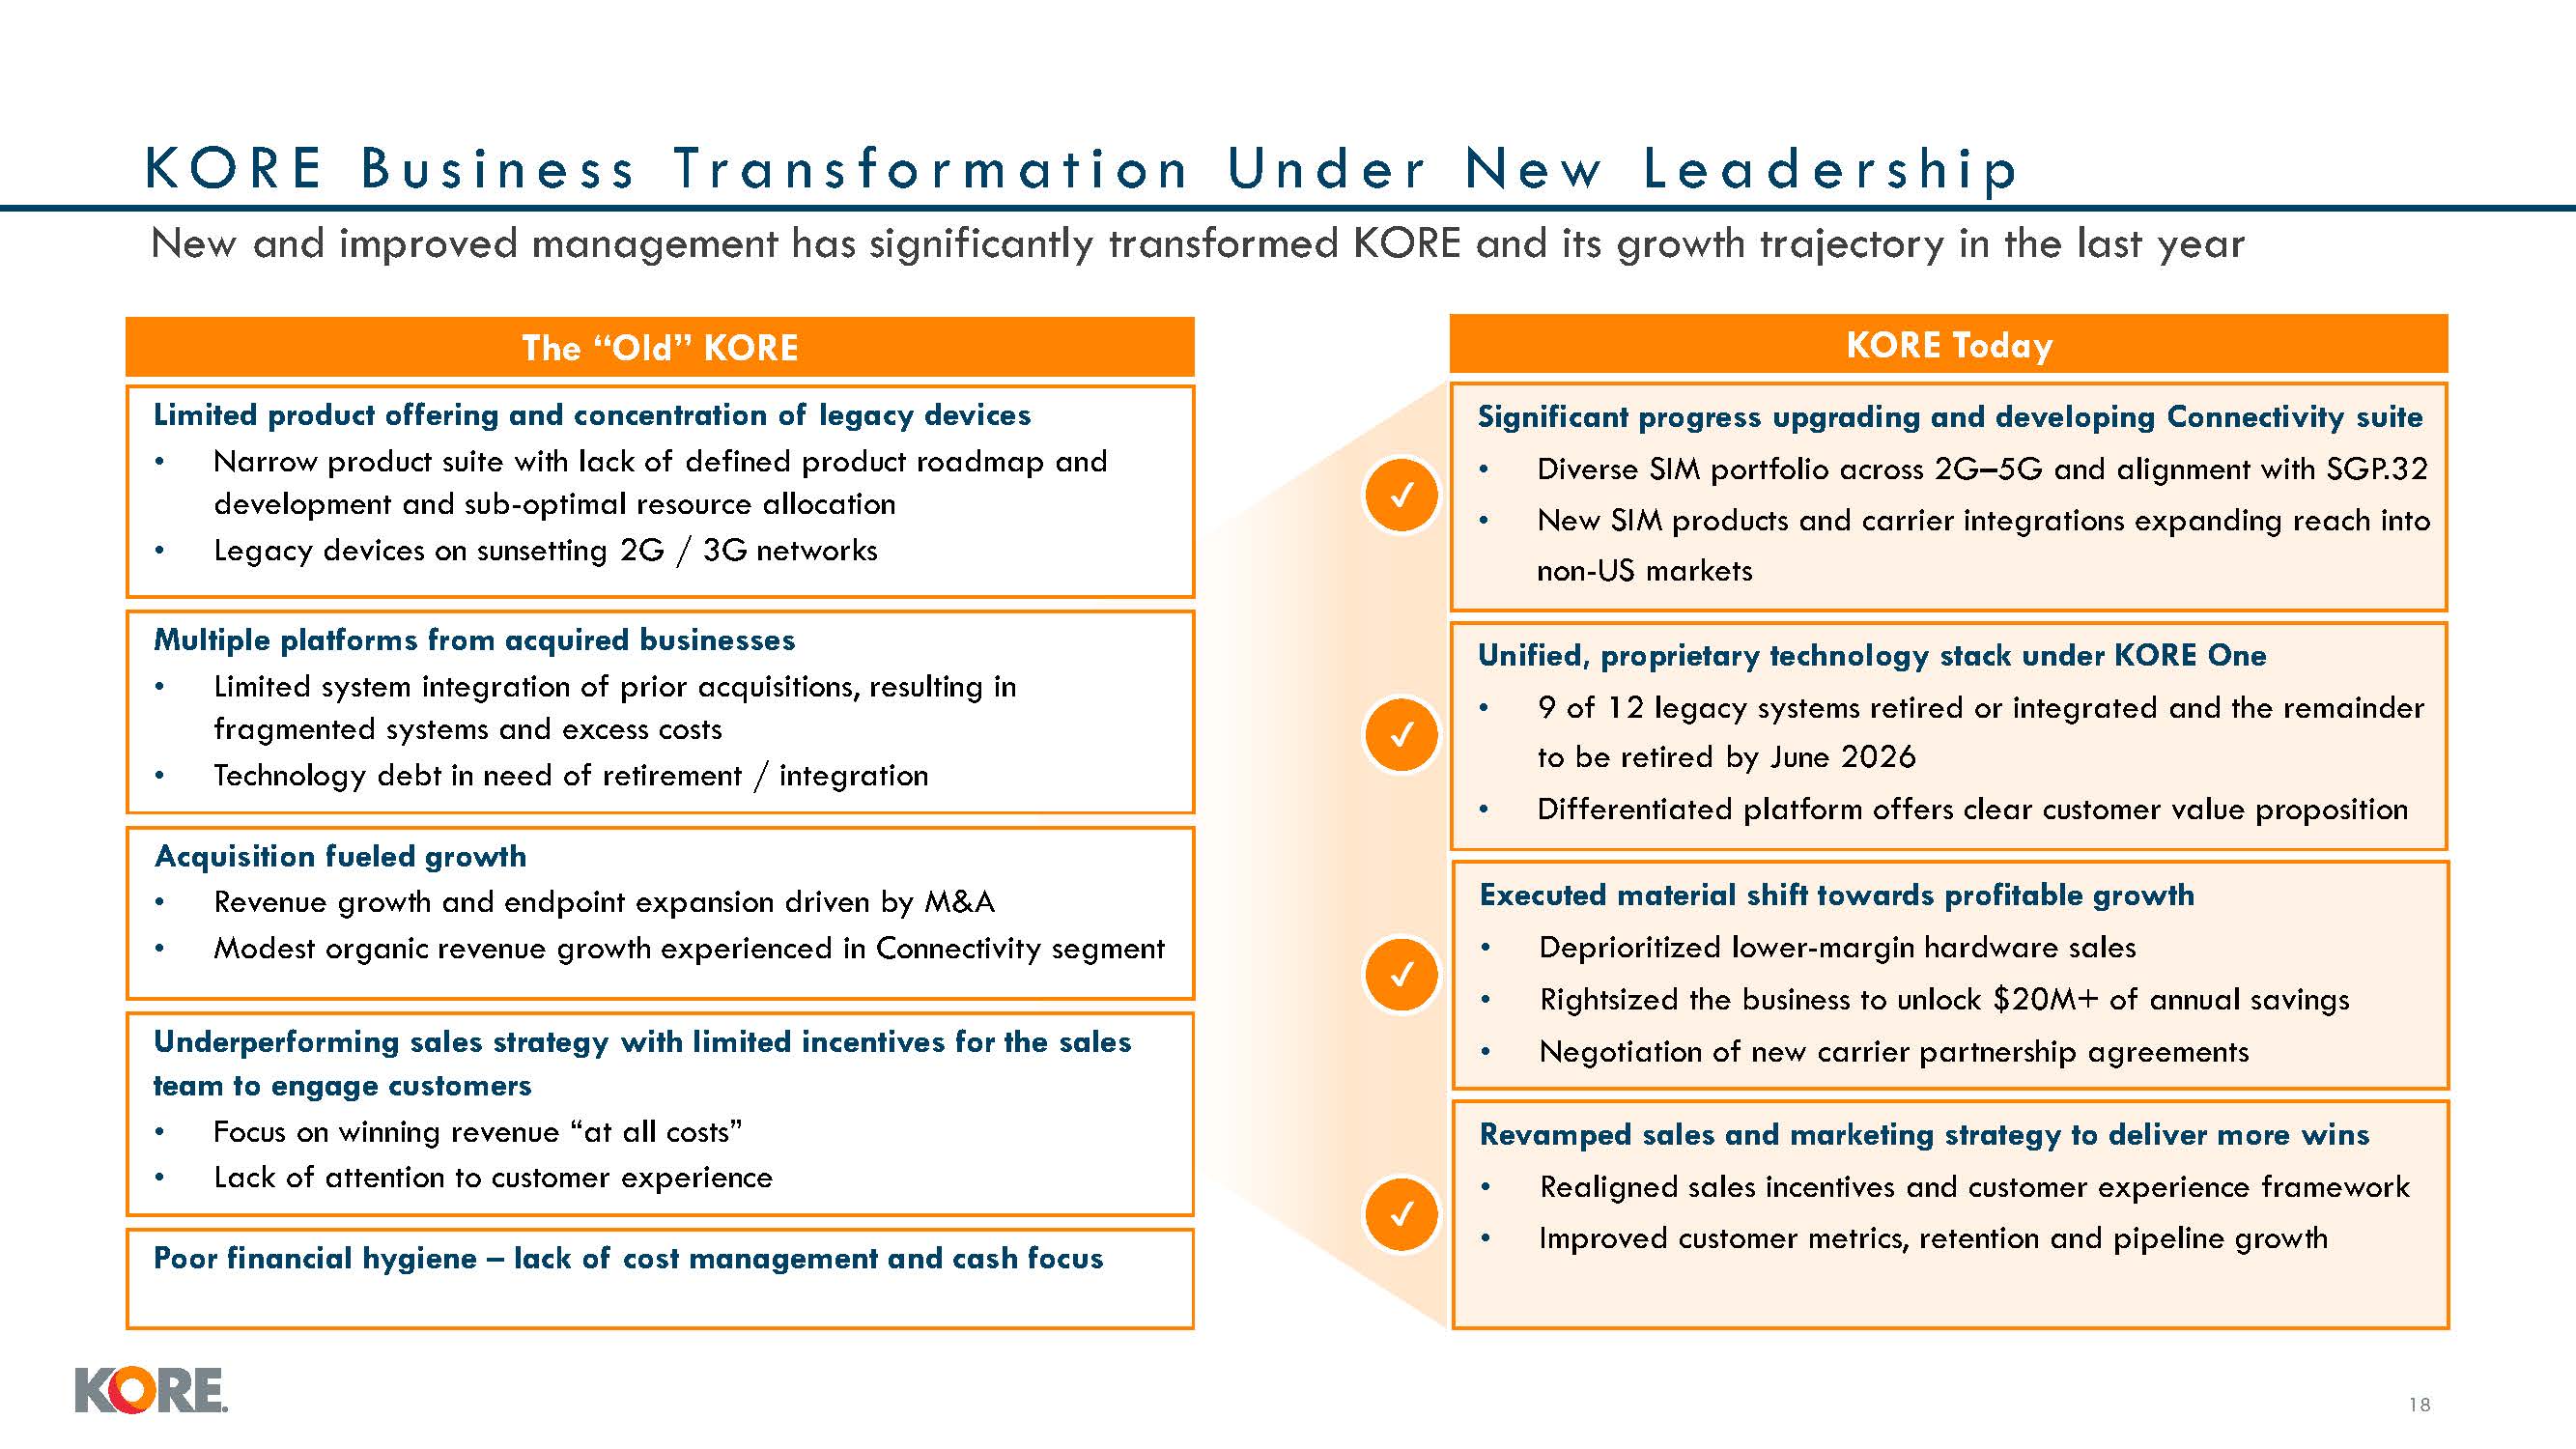
K O R E B u s i n e s s Tr a n s f o r m a t i o n U n d e r N e w L e a d e r s h
i p Limited product offering and concentration of legacy devices Narrow product suite with lack of defined product roadmap and development and sub-optimal resource allocation Legacy devices on sunsetting 2G / 3G networks Multiple platforms
from acquired businesses Limited system integration of prior acquisitions, resulting in fragmented systems and excess costs Technology debt in need of retirement / integration Acquisition fueled growth Revenue growth and endpoint expansion
driven by M&A Modest organic revenue growth experienced in Connectivity segment Underperforming sales strategy with limited incentives for the sales team to engage customers ocus on winning revenue “at all costs” Lack of attention to
customer experience The “Old” KORE Significant progress upgrading and developing Connectivity suite Diverse SIM portfolio across 2G–5G and alignment with SGP.32 New SIM products and carrier integrations expanding reach into non-US
markets Unified, proprietary technology stack under KORE One 9 of 12 legacy systems retired or integrated and the remainder to be retired by June 2026 Differentiated platform offers clear customer value proposition Executed material shift
towards profitable growth Deprioritized lower-margin hardware sales Rightsized the business to unlock $20M+ of annual savings Negotiation of new carrier partnership agreements Revamped sales and marketing strategy to deliver more
wins Realigned sales incentives and customer experience framework Improved customer metrics, retention and pipeline growth KORE Today New and improved management has significantly transformed KORE and its growth trajectory in the last
year Poor financial hygiene – lack of cost management and cash focus 16
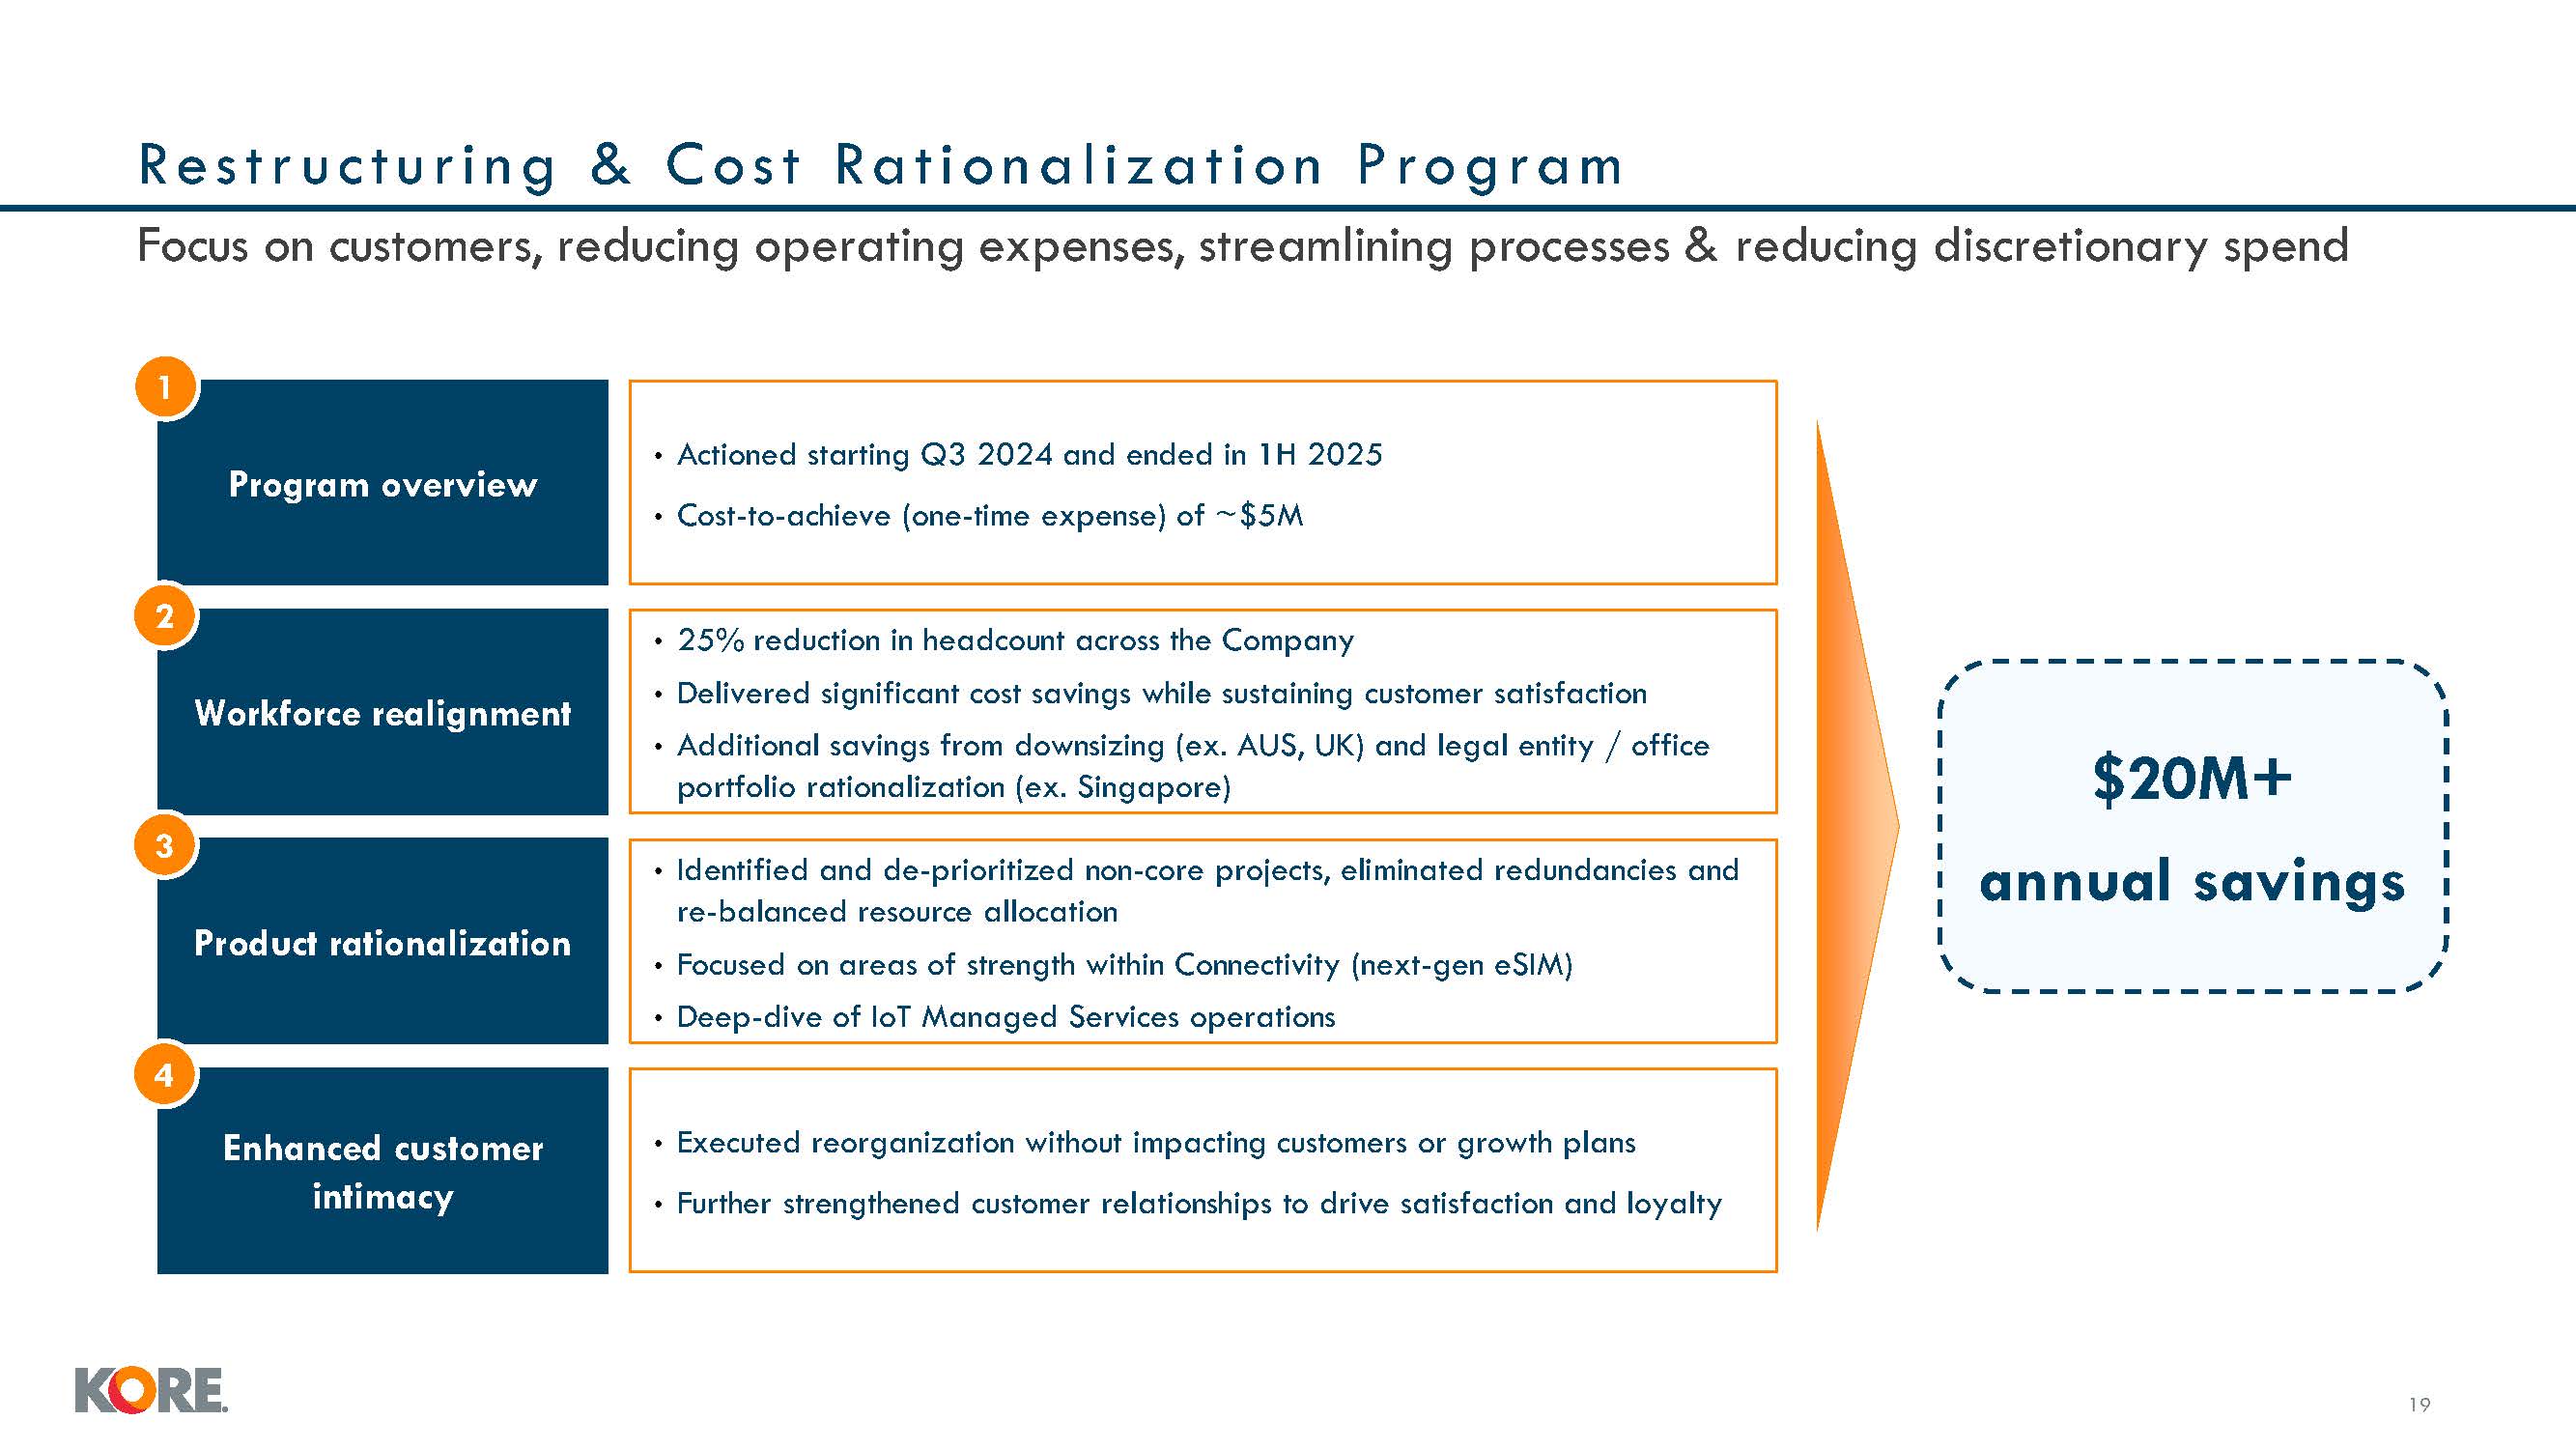
Workforce realignment Product rationalization Res t r u c t u r i n g & C os
t Ration a l i z at i on Program $20M+ annual savings Focus on customers, reducing operating expenses, streamlining processes & reducing discretionary spend Program overview Actioned starting Q3 2024 and ended in 1H
2025 Cost-to-achieve (one-time expense) of ~$5M 1 25% reduction in headcount across the Company Delivered significant cost savings while sustaining customer satisfaction Additional savings from downsizing (ex. AUS, UK) and legal entity /
office portfolio rationalization (ex. Singapore) 2 Identified and de-prioritized non-core projects, eliminated redundancies and re-balanced resource allocation Focused on areas of strength within Connectivity (next-gen eSIM) Deep-dive of
IoT Managed Services operations 3 Enhanced customer intimacy Executed reorganization without impacting customers or growth plans Further strengthened customer relationships to drive satisfaction and loyalty 4 16
S i g n i f i c a n t R e d u c t i o n i n G o - F o r wa r d N o n - R e c u r r
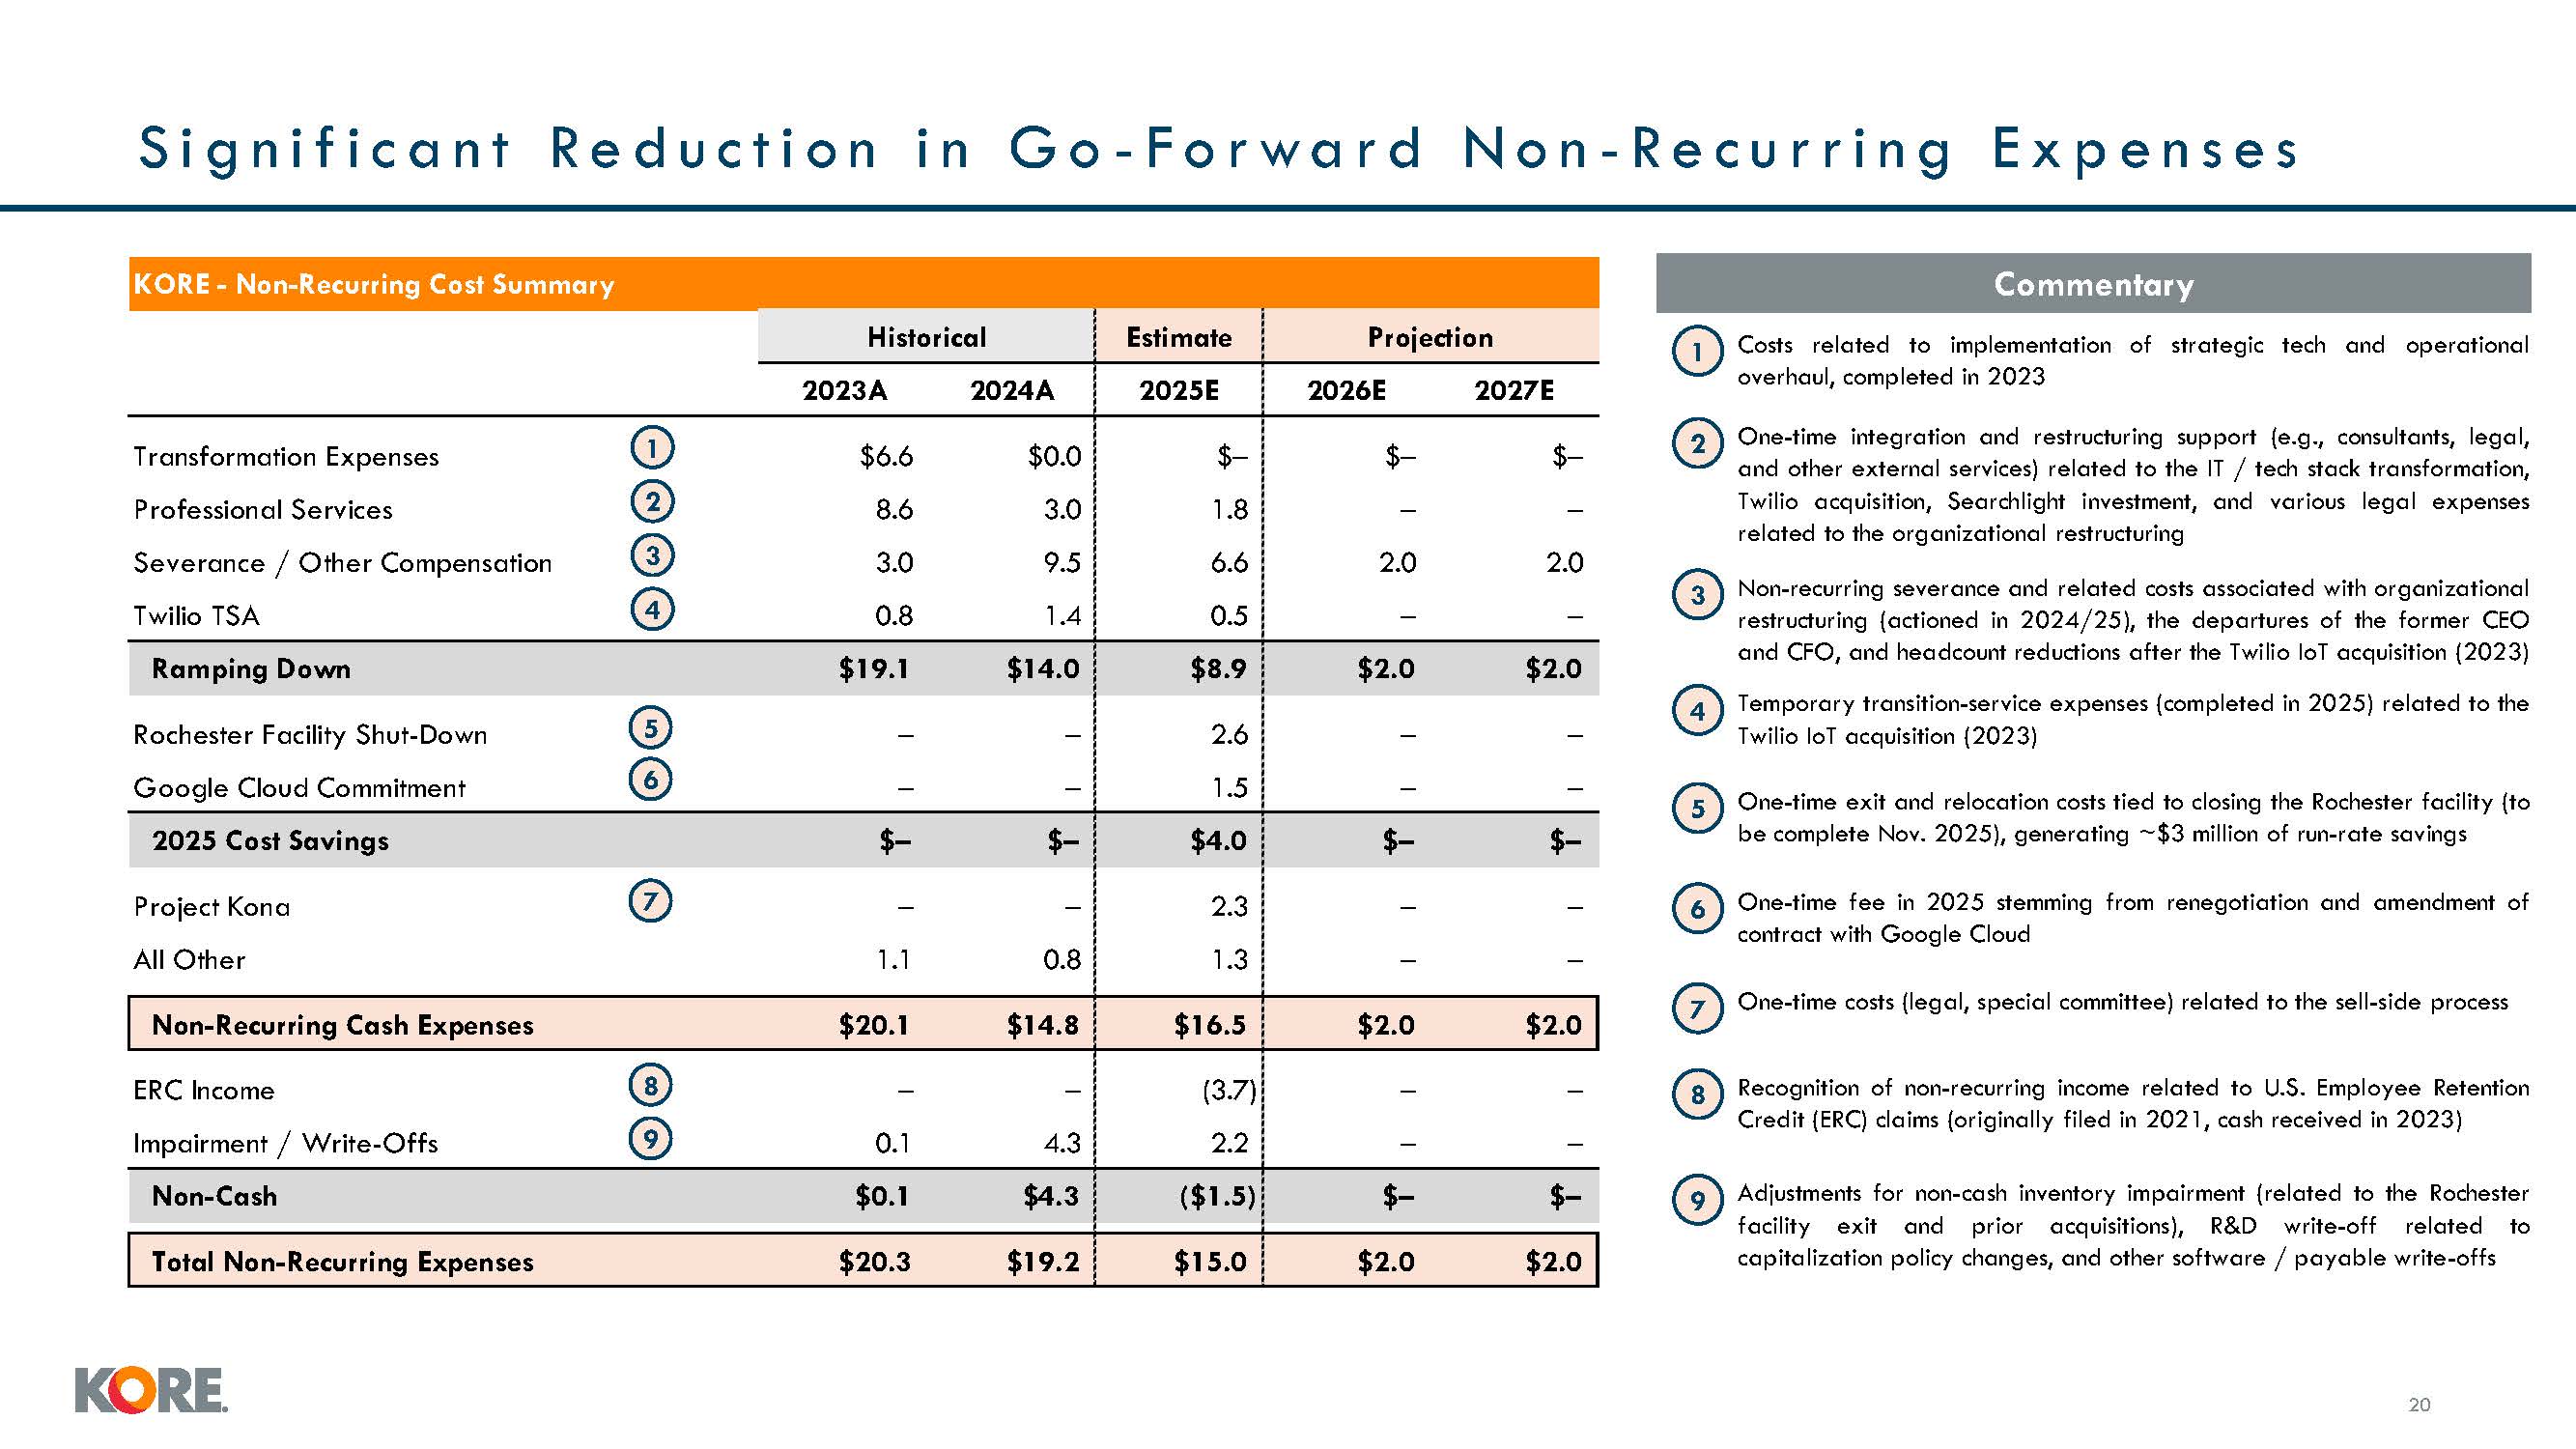
i n g E x p e n s e s Commentary 1 Costs related to implementation of strategic tech and operational overhaul, completed in 2023 KORE - Non-Recurring Cost Summary Historical Estimate Projection 2023A 2024A 2025E 2026E
2027E Transformation Expenses 1 $6.6 $0.0 Professional Services 2 8.6 3.0 Severance / Other Compensation 3 3.0 9.5 Twilio TSA 4 0.8 1.4 – 1.8 6.6 0.5 – – – – 2.0 2.0 – – Ramping Down $19.1 $14.0 $8.9 $2.0 $2.0 Rochester
Facility Shut-Down 5 – – Google Cloud Commitment 6 – – 2.6 1.5 – – – – 2025 Cost Savings $– $– $4.0 $– $– Project Kona 7 – – All Other 1.1 0.8 2.3 1.3 – – – – Non-Recurring Cash Expenses $20.1 $14.8 $16.5 $2.0 $2.0 ERC Income
8 – – Impairment / Write-Offs 9 0.1 4.3 (3.7) 2.2 – – – – Non-Cash $0.1 $4.3 ($1.5) $– $– Total Non-Recurring Expenses $20.3 $19.2 $15.0 $2.0 $2.0 7 One-time costs (legal, special committee) related to the sell-side
process 2 One-time integration and restructuring support (e.g., consultants, legal, and other external services) related to the IT / tech stack transformation, Twilio acquisition, Searchlight investment, and various legal expenses related to
the organizational restructuring Non-recurring severance and related costs associated with organizational restructuring (actioned in 2024/25), the departures of the former CEO and CFO, and headcount reductions after the Twilio IoT acquisition
(2023) Temporary transition-service expenses (completed in 2025) related to the Twilio IoT acquisition (2023) 3 4 5 One-time exit and relocation costs tied to closing the Rochester facility (to be complete Nov. 2025), generating ~$3
million of run-rate savings 6 One-time fee in 2025 stemming from renegotiation and amendment of contract with Google Cloud 8 Recognition of non-recurring income related to U.S. Employee Retention Credit (ERC) claims (originally filed in
2021, cash received in 2023) 9 16 Adjustments for non-cash inventory impairment (related to the Rochester facility exit and prior acquisitions), R&D write-off related to capitalization policy changes, and other software / payable
write-offs

Investment Highlights Proprietary & confidential to KORE Wireless |21
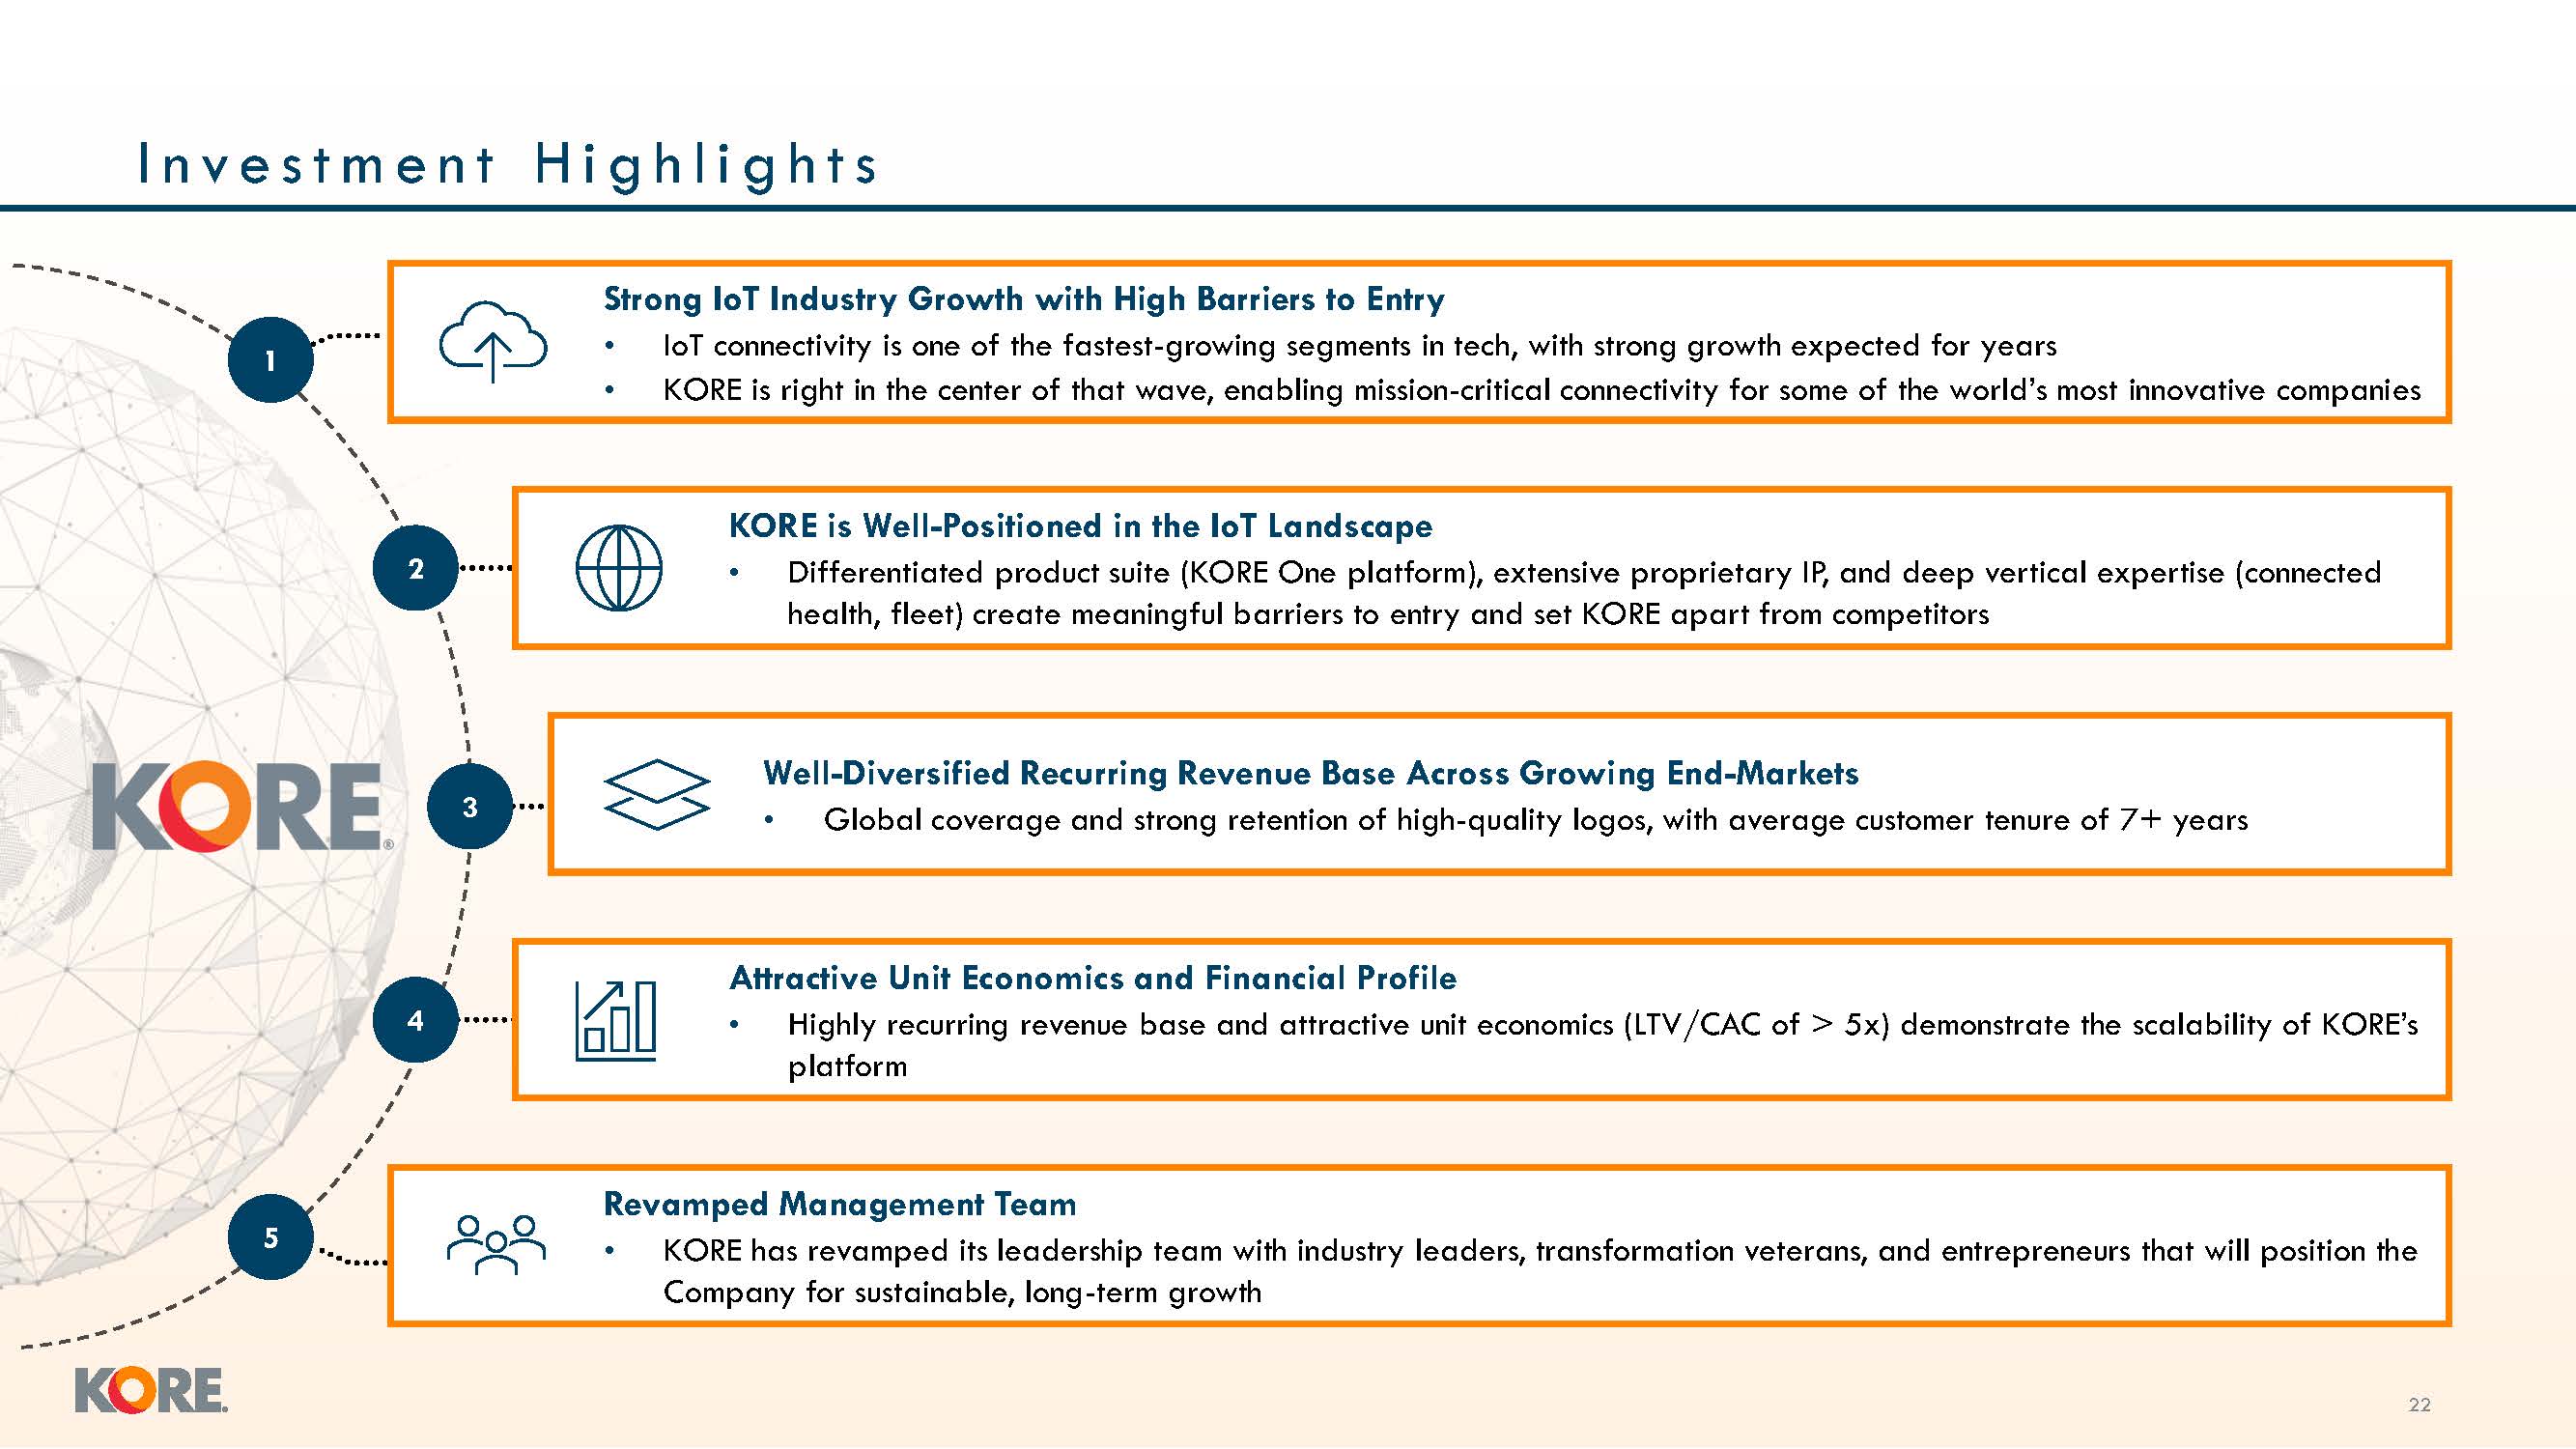
I n v e s t m e n t H i g h l i g h t s Strong IoT Industry Growth with High
Barriers to Entry IoT connectivity is one of the fastest-growing segments in tech, with strong growth expected for years KORE is right in the center of that wave, enabling mission-critical connectivity for some of the world’s most innovative
companies KORE is Well-Positioned in the IoT Landscape Differentiated product suite (KORE One platform), extensive proprietary IP, and deep vertical expertise (connected health, fleet) create meaningful barriers to entry and set KORE apart
from competitors Well-Diversified Recurring Revenue Base Across Growing End-Markets Global coverage and strong retention of high-quality logos, with average customer tenure of 7+ years Attractive Unit Economics and Financial Profile Highly
recurring revenue base and attractive unit economics (LTV/CAC of > x) demonstrate the scalability of KORE’s platform Revamped Management Team KORE has revamped its leadership team with industry leaders, transformation veterans, and
entrepreneurs that will position the Company for sustainable, long-term growth 2 5 1 3 4 22
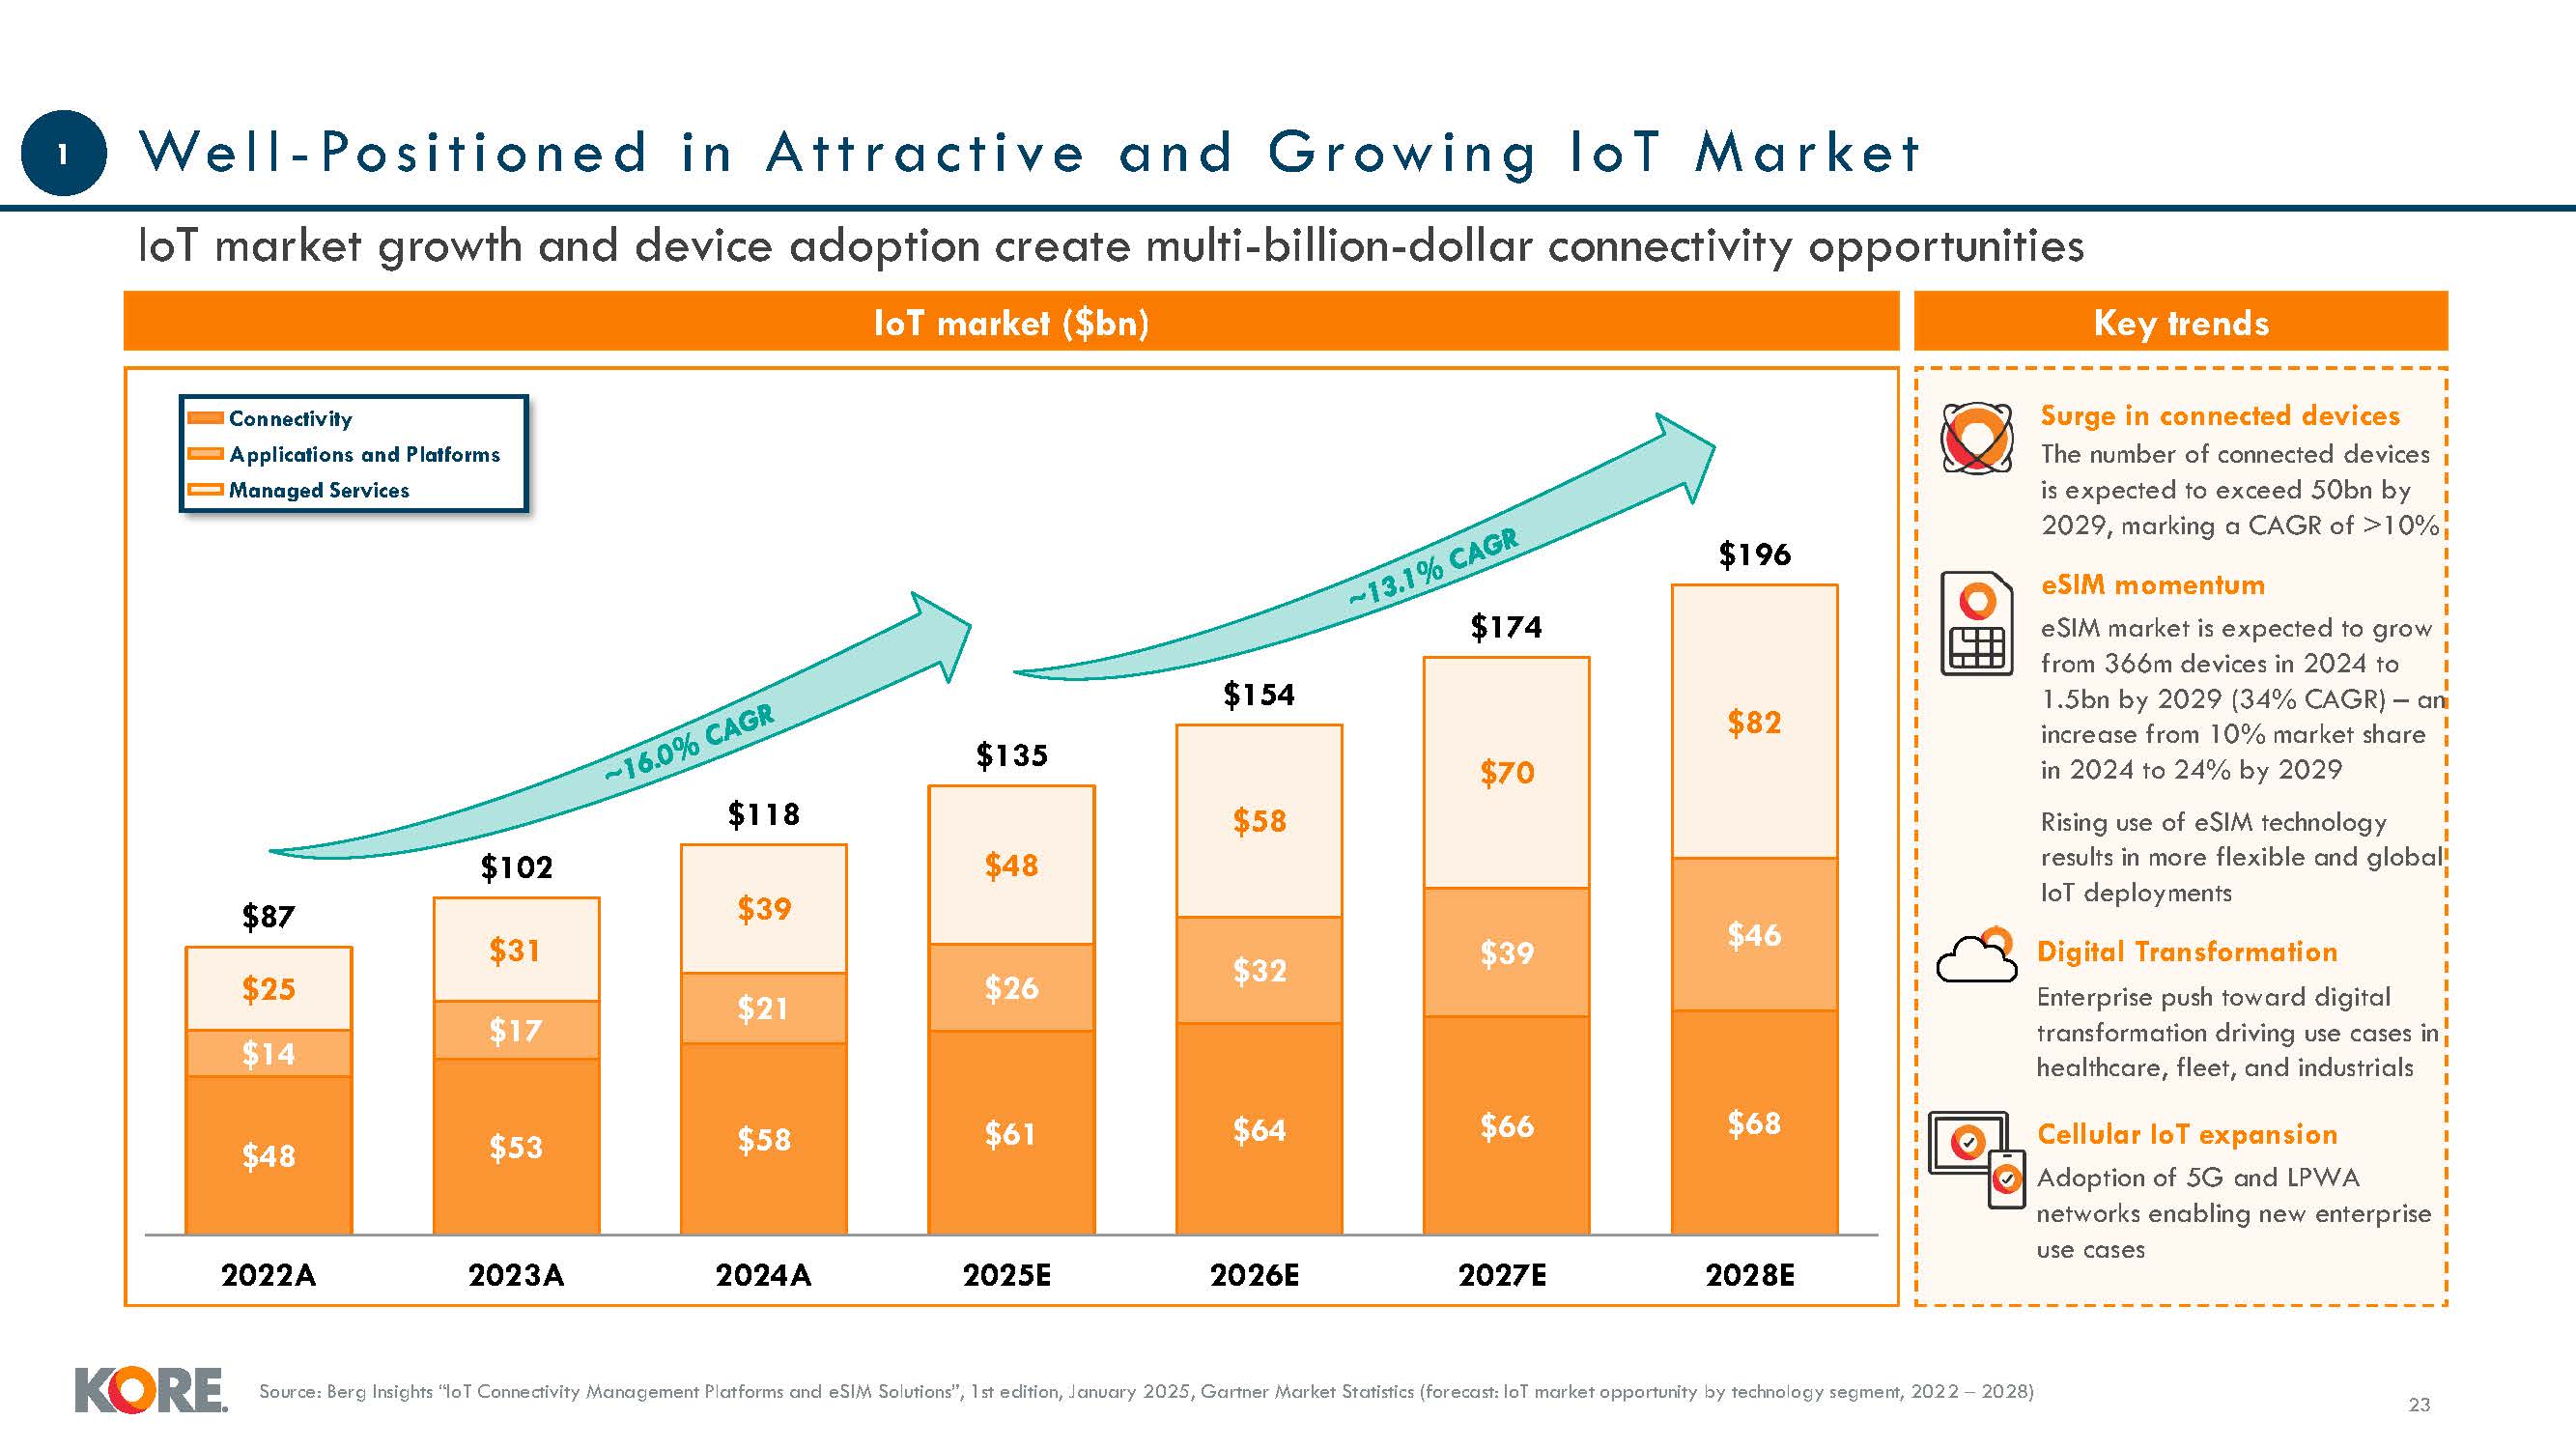
Well - Po s i t i o n e d i n A t t rac t i ve an d Growi n g I o T Mar ke t IoT
market growth and device adoption create multi-billion-dollar connectivity opportunities Surge in connected devices The number of connected devices is expected to exceed 50bn by 2029, marking a CAGR of >10% eSIM momentum eSIM market is
expected to grow from 366m devices in 2024 to 1.5bn by 2029 (34% CAGR) – an increase from 10% market share in 2024 to 24% by 2029 Rising use of eSIM technology results in more flexible and global IoT deployments Digital
Transformation Enterprise push toward digital transformation driving use cases in healthcare, fleet, and industrials Cellular IoT expansion Adoption of 5G and LPWA networks enabling new enterprise use cases Key trends IoT market
($bn) Connectivity Applications and Platforms Managed Services $48 $53 $58 $61 $64 $66 $68 $17 $21 $26 $32 $39 $46 $25 $14 $31 $39 $58 $70 $82 $87 $102
$48 $118 $135 $154 $174 $196 2022A 2023A 2024A 2025E 2026E 2027E 2028E 1 Source erg Insights “IoT Connectivity Management Platforms and eSIM Solutions”, 1st edition, January 202 , Gartner Market Statistics (forecast IoT market
opportunity by technology segment, 2022 – 2028) 23
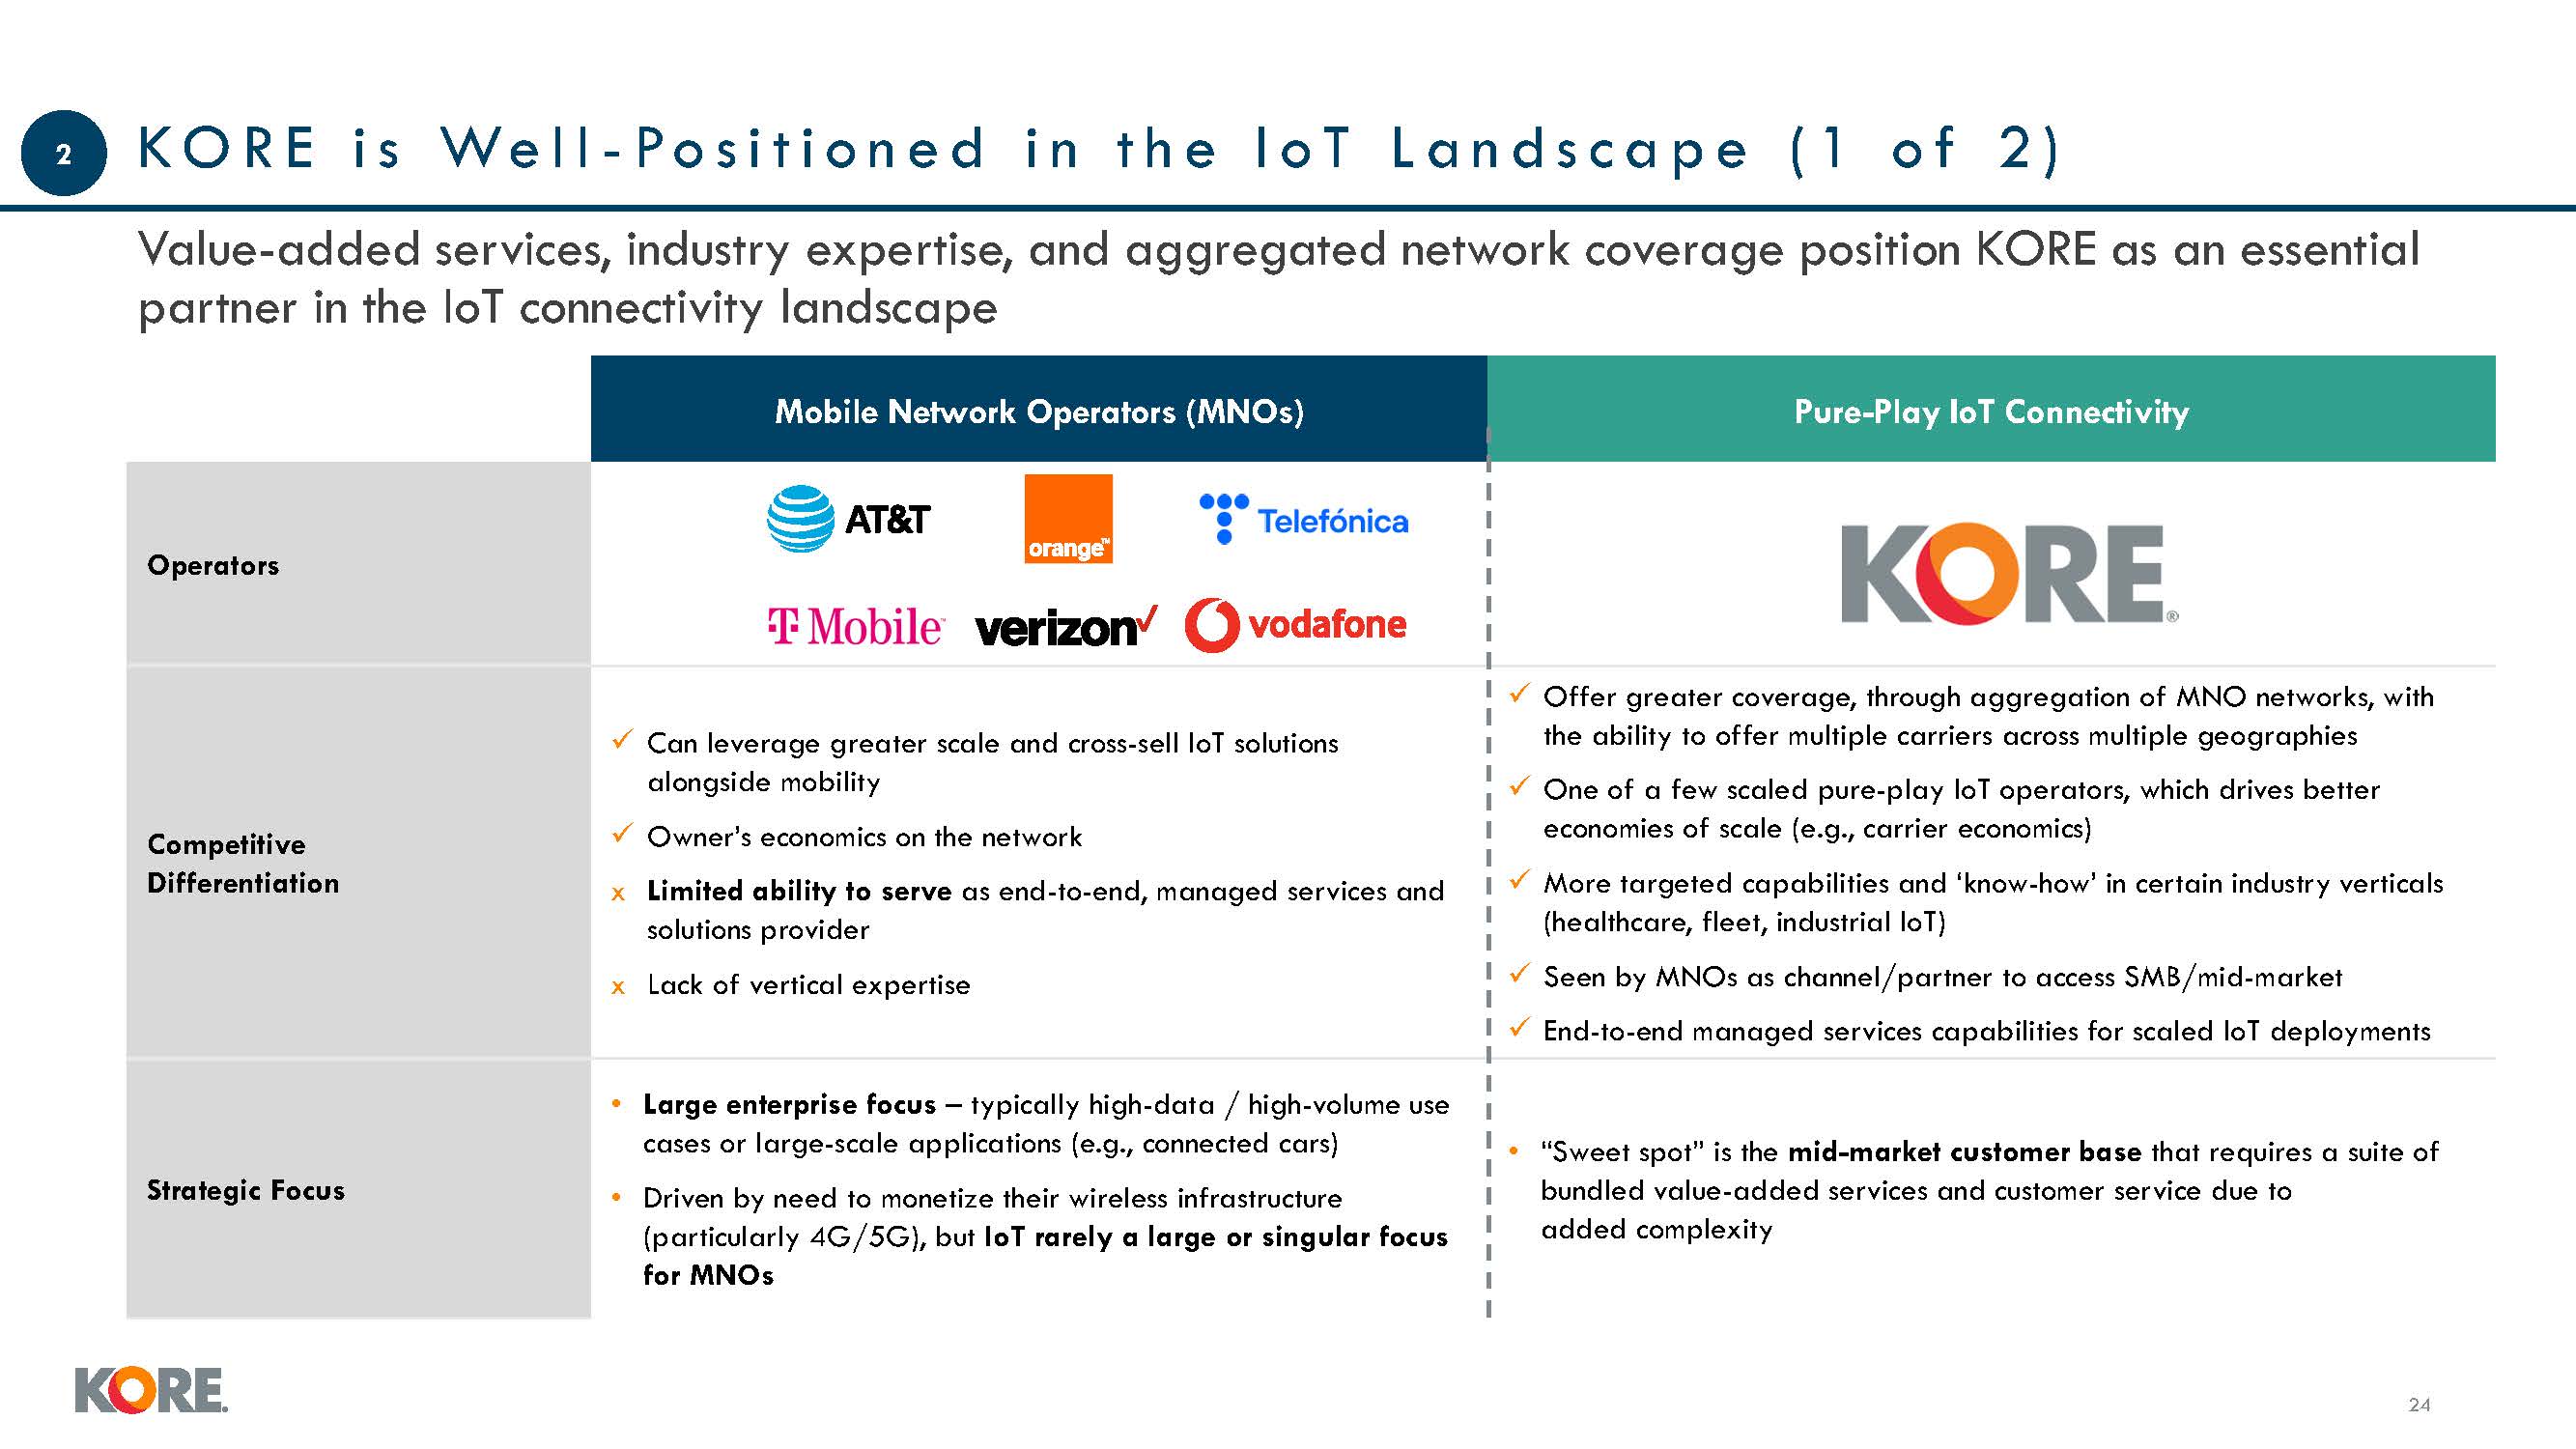
K O R E i s We l l - Po s i t i o n e d i n t h e I o T L a n d s c a p e ( 1 o f
2 ) Mobile Network Operators (MNOs) Pure-Play IoT Connectivity Operators Competitive Differentiation Can leverage greater scale and cross-sell IoT solutions alongside mobility Owner’s economics on the network x Limited ability to serve
as end-to-end, managed services and solutions provider x Lack of vertical expertise Offer greater coverage, through aggregation of MNO networks, with the ability to offer multiple carriers across multiple geographies One of a few scaled
pure-play IoT operators, which drives better economies of scale (e.g., carrier economics) More targeted capabilities and ‘know-how’ in certain industry verticals (healthcare, fleet, industrial IoT) Seen by MNOs as channel/partner to access
SMB/mid-market End-to-end managed services capabilities for scaled IoT deployments Strategic Focus Large enterprise focus – typically high-data / high-volume use cases or large-scale applications (e.g., connected cars) Driven by need to
monetize their wireless infrastructure (particularly 4G/5G), but IoT rarely a large or singular focus for MNOs “Sweet spot” is the mid-market customer base that requires a suite of bundled value-added services and customer service due
to added complexity 2 24 Value-added services, industry expertise, and aggregated network coverage position KORE as an essential partner in the IoT connectivity landscape
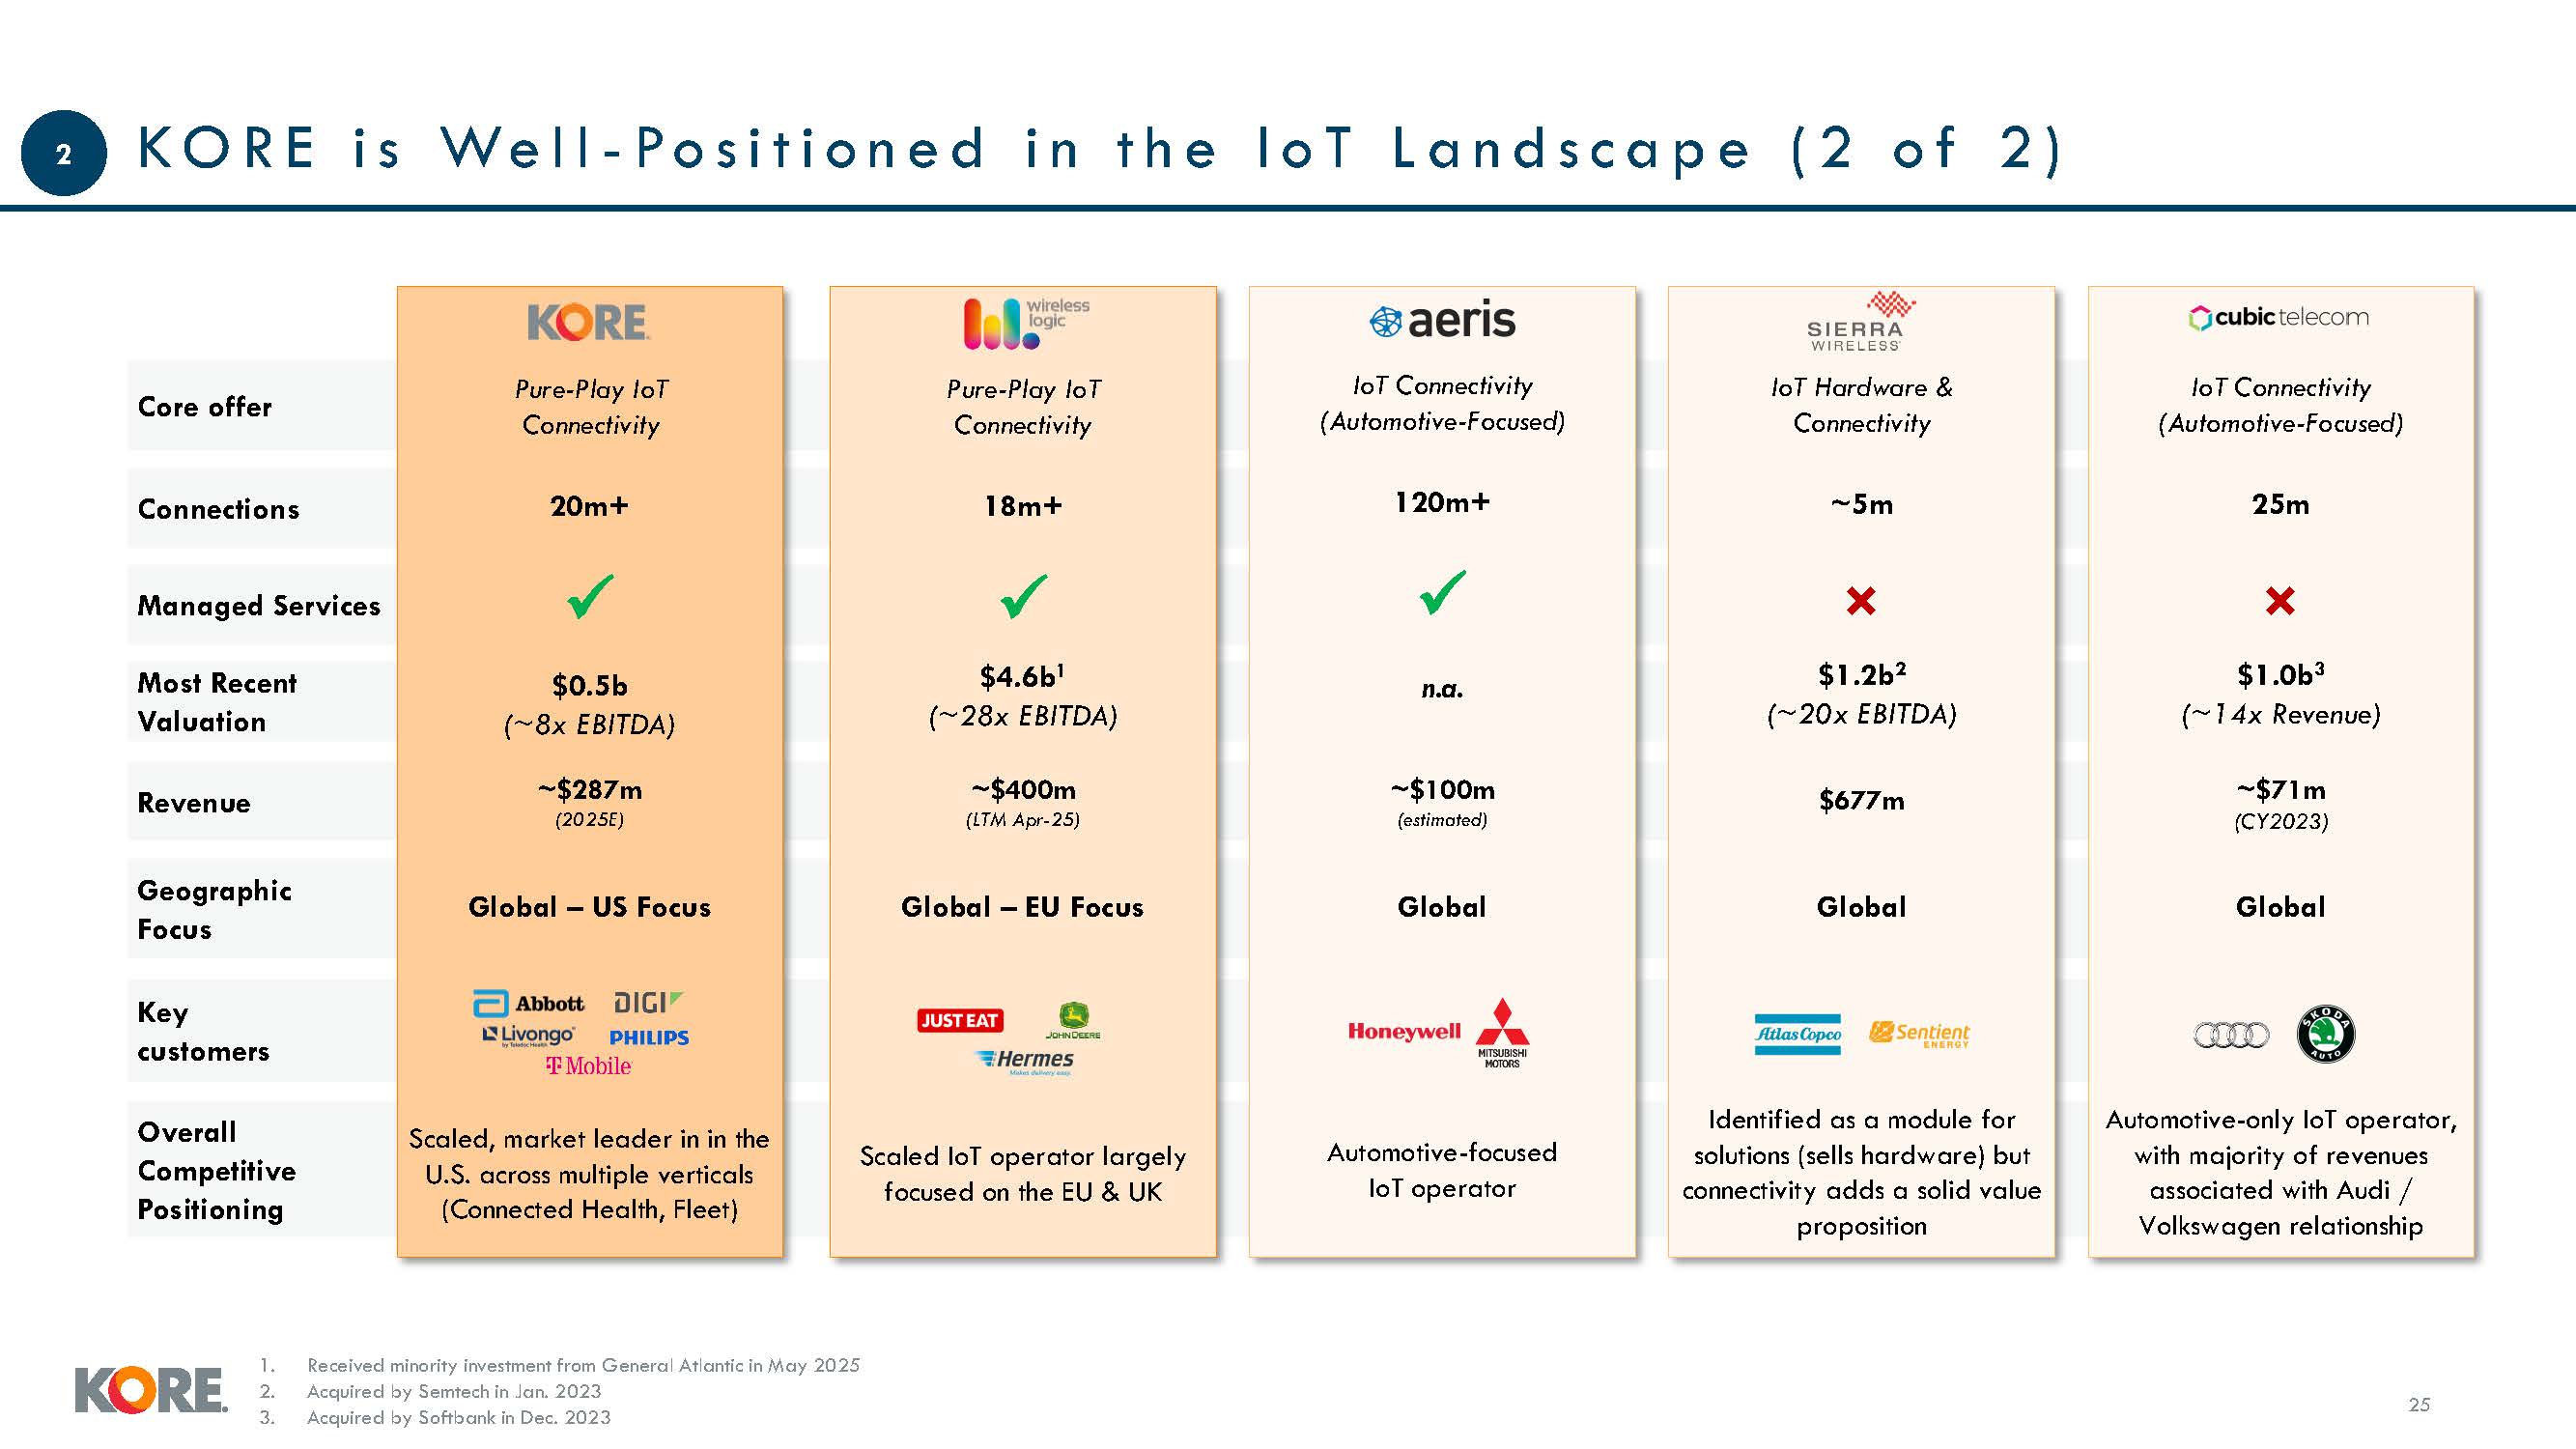
Managed Services Overall Competitive Positioning Most Recent Valuation K O R E
i s We l l - Po s i t i o n e d i n t h e I o T L a n d s c a p e ( 2 o f 2 ) 25 2 Revenue Key customers Geographic Focus Connections Core offer Pure-Play IoT Connectivity 18m+ $4.6b1 (~28x EBITDA) ~$400m (LTM Apr-25) Global –
EU Focus Scaled IoT operator largely focused on the EU & UK IoT Connectivity (Automotive-Focused) 120m+ n.a. ~$100m (estimated) Global Automotive-focused IoT operator IoT Hardware & Connectivity ~5m × $1.2b2 (~20x
EBITDA) $677m Global Identified as a module for solutions (sells hardware) but connectivity adds a solid value proposition IoT Connectivity (Automotive-Focused) 25m × $1.0b3 (~14x Revenue) ~$71m (CY2023) Global Automotive-only IoT
operator, with majority of revenues associated with Audi / Volkswagen relationship Pure-Play IoT Connectivity 20m+ $0.5b (~8x EBITDA) ~$287m (2025E) Global – US Focus Scaled, market leader in in the U.S. across multiple verticals
(Connected Health, Fleet) Received minority investment from General Atlantic in May 2025 Acquired by Semtech in Jan. 2023 Acquired by Softbank in Dec. 2023
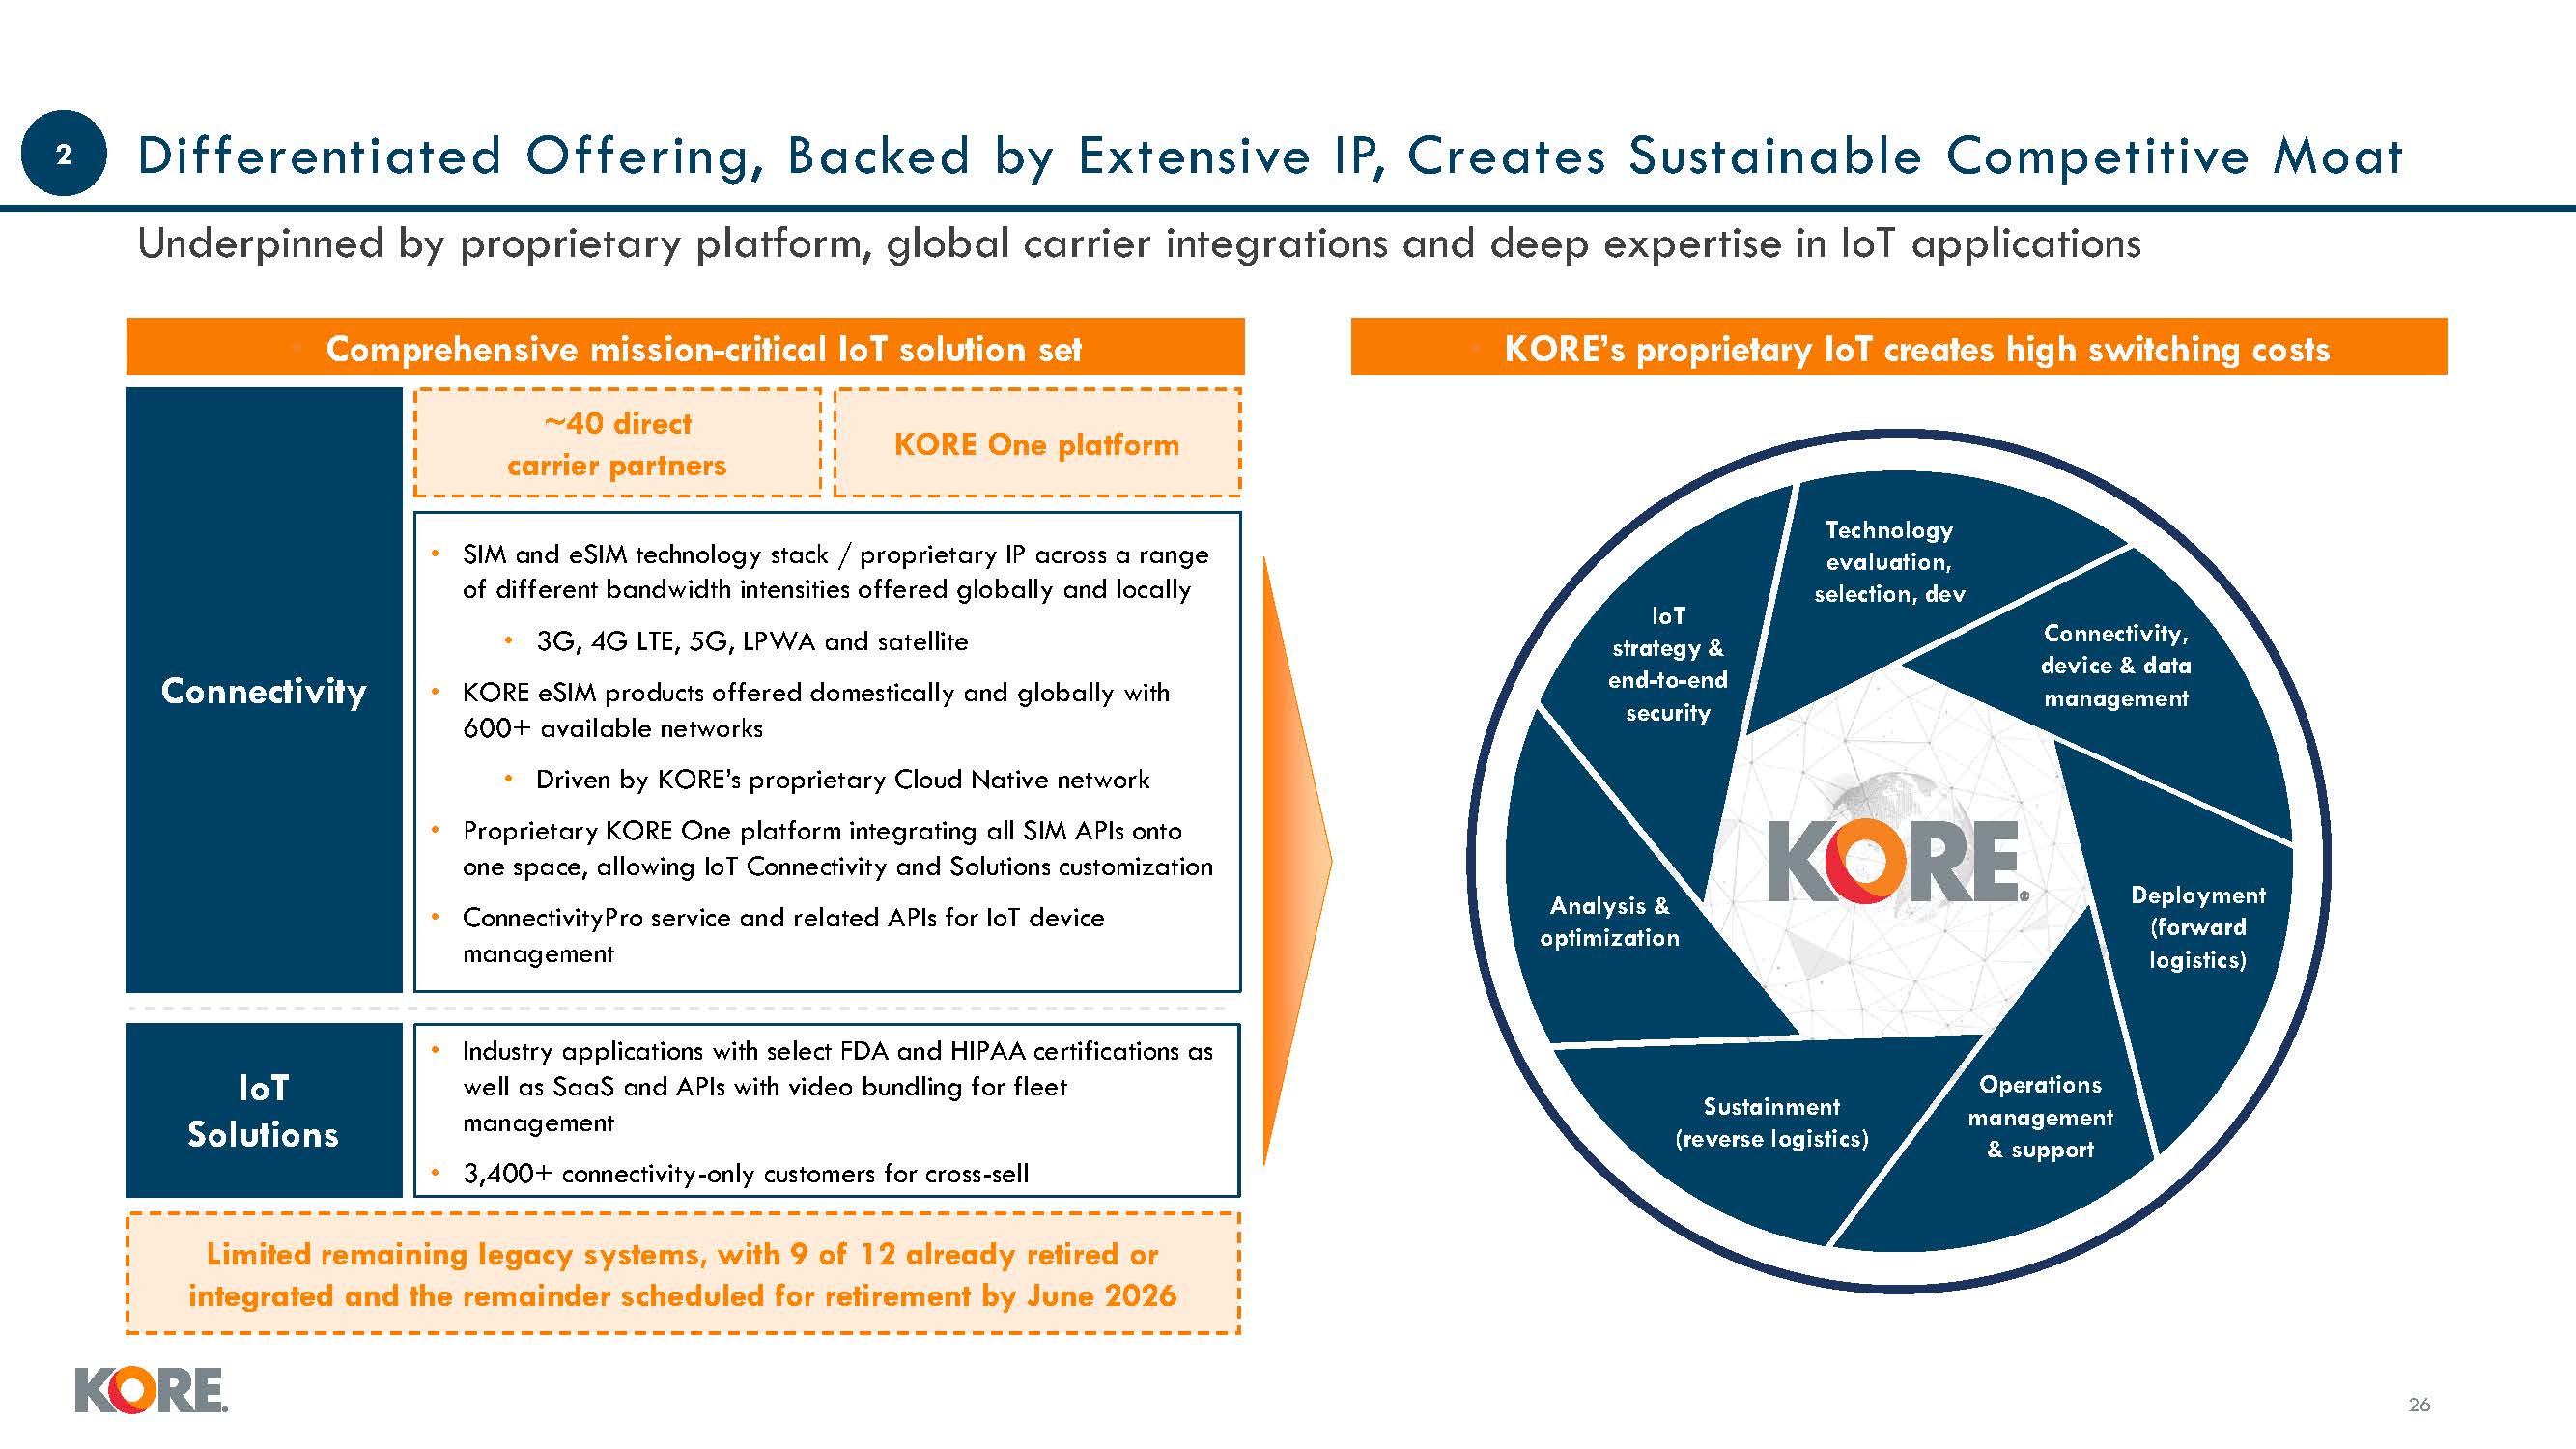
Differentiated Offering, Backed by Extensive IP, Creates Sustainable Competitive
Moat Underpinned by proprietary platform, global carrier integrations and deep expertise in IoT applications SIM and eSIM technology stack / proprietary IP across a range of different bandwidth intensities offered globally and locally 3G, 4G
LTE, 5G, LPWA and satellite KORE eSIM products offered domestically and globally with 600+ available networks Driven by KORE’s proprietary Cloud ative network Proprietary KORE One platform integrating all SIM APIs onto one space, allowing
IoT Connectivity and Solutions customization ConnectivityPro service and related APIs for IoT device management Connectivity IoT Solutions Industry applications with select FDA and HIPAA certifications as well as SaaS and APIs with video
bundling for fleet management 3,400+ connectivity-only customers for cross-sell Comprehensive mission-critical IoT solution set KORE’s proprietary IoT creates high switching costs ~40 direct carrier partners KORE One platform Limited
remaining legacy systems, with 9 of 12 already retired or integrated and the remainder scheduled for retirement by June 2026 Analysis & optimization Operations management & support Deployment (forward logistics) Sustainment (reverse
logistics) IoT strategy & end-to-end security Technology evaluation, selection, dev Connectivity, device & data management 2 26
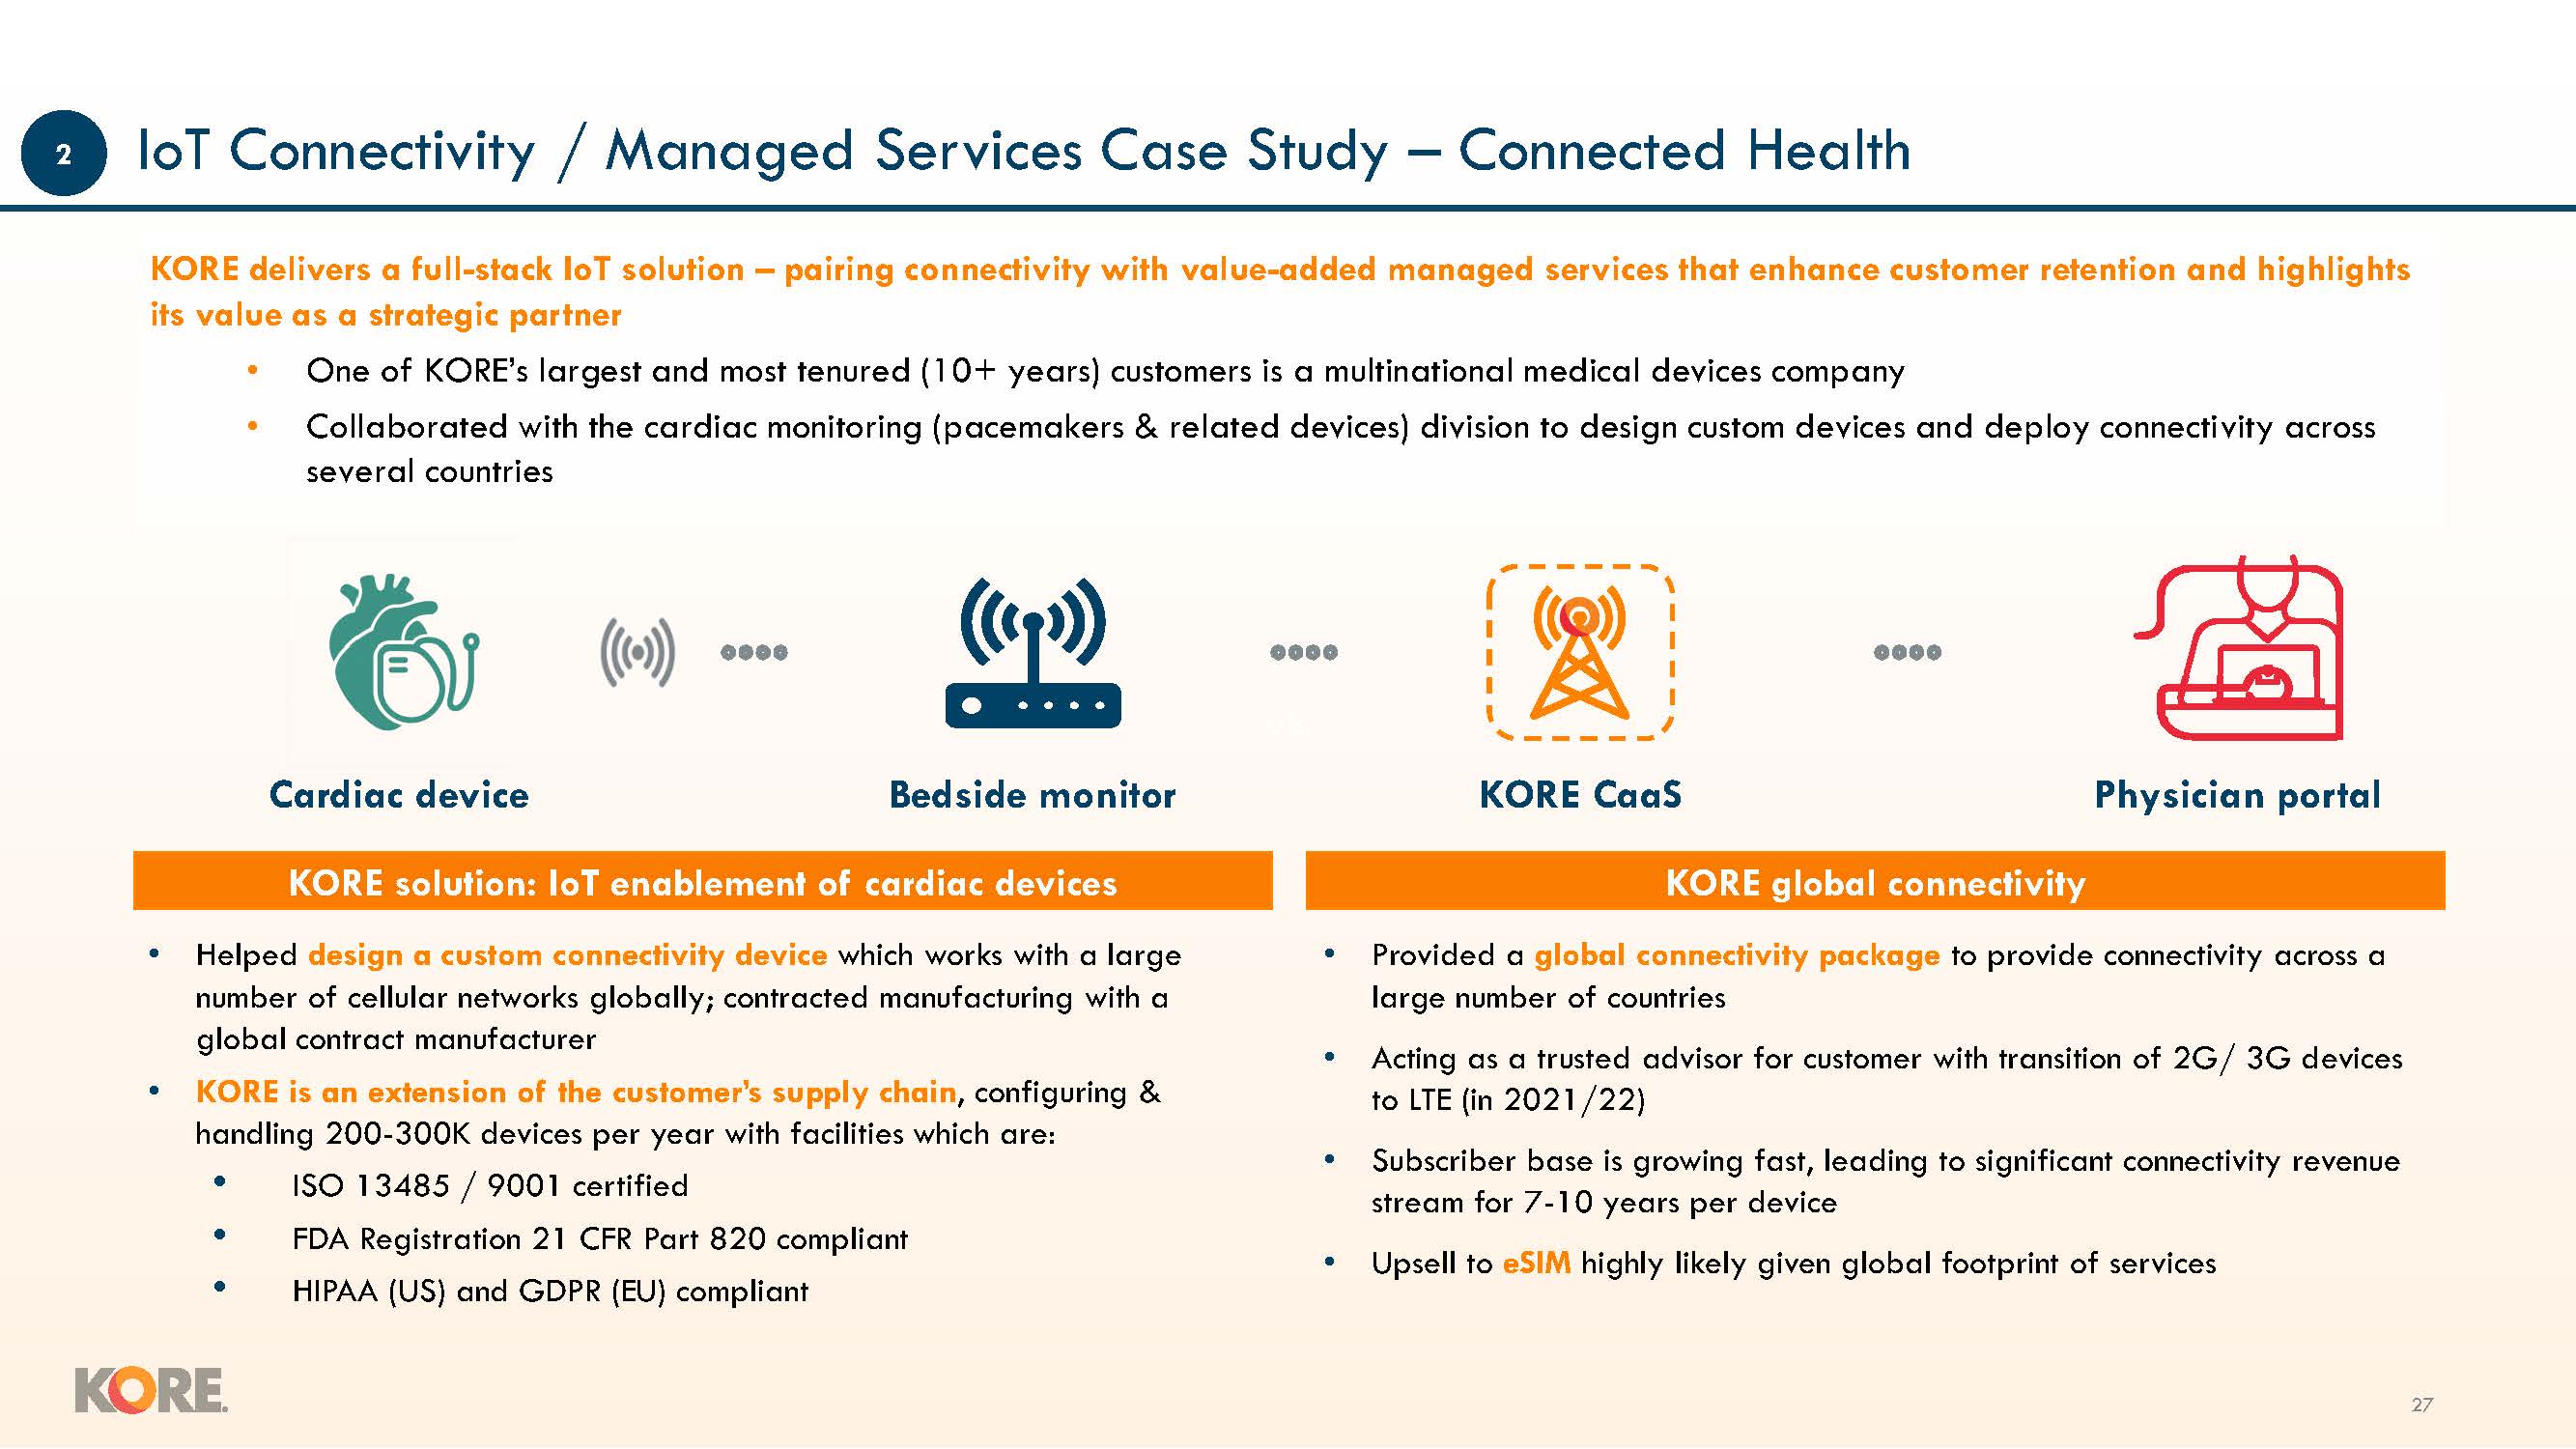
U.S. IoT Connectivity / Managed Services Case Study – Connected Health KORE
global connectivity Provided a global connectivity package to provide connectivity across a large number of countries Acting as a trusted advisor for customer with transition of 2G/ 3G devices to LTE (in 2021/22) Subscriber base is growing
fast, leading to significant connectivity revenue stream for 7-10 years per device Upsell to eSIM highly likely given global footprint of services KORE solution: IoT enablement of cardiac devices Helped design a custom connectivity device
which works with a large number of cellular networks globally; contracted manufacturing with a global contract manufacturer KORE is an extension of the customer’s supply chain, configuring & handling 200-300K devices per year with
facilities which are: ISO 13485 / 9001 certified FDA Registration 21 CFR Part 820 compliant HIPAA (US) and GDPR (EU) compliant KORE CaaS Physician portal Cardiac device Bedside monitor KORE delivers a full-stack IoT solution – pairing
connectivity with value-added managed services that enhance customer retention and highlights its value as a strategic partner One of KORE’s largest and most tenured (10+ years) customers is a multinational medical devices
company Collaborated with the cardiac monitoring (pacemakers & related devices) division to design custom devices and deploy connectivity across several countries 2 26
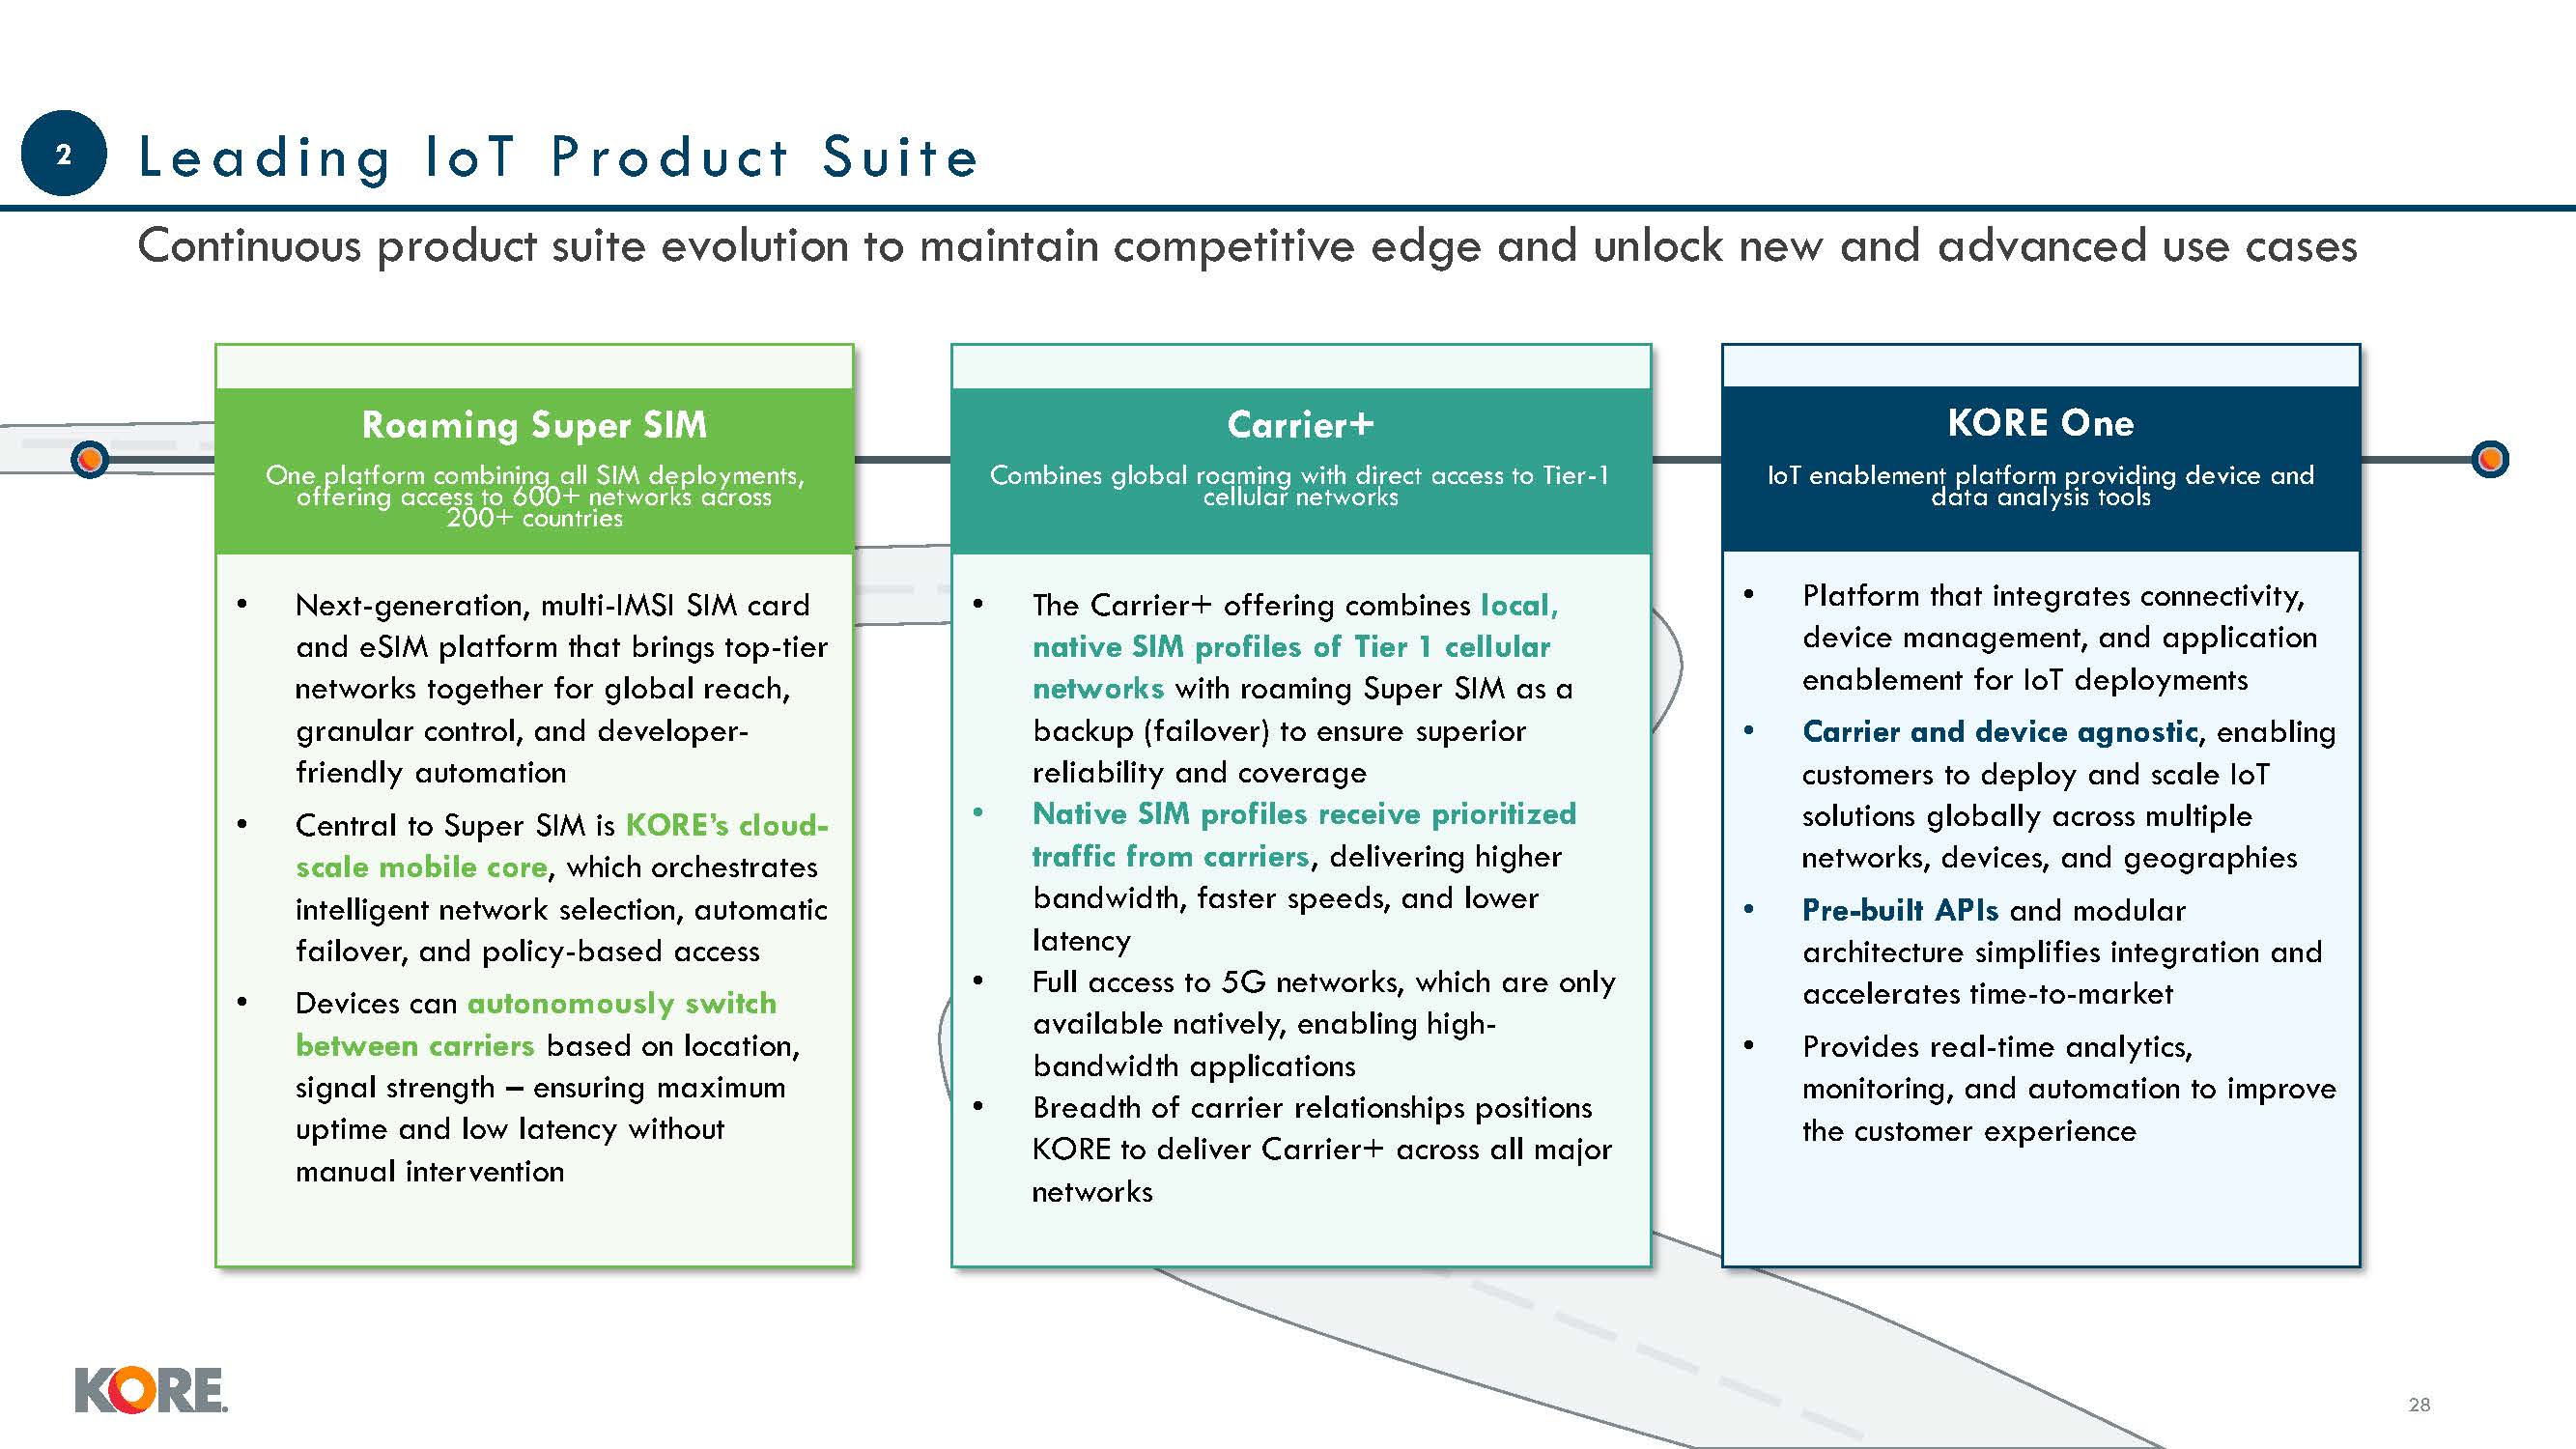
Leadin g I o T Produ c t Su i t e Continuous product suite evolution to maintain
competitive edge and unlock new and advanced use cases Platform that integrates connectivity, device management, and application enablement for IoT deployments Carrier and device agnostic, enabling customers to deploy and scale IoT solutions
globally across multiple networks, devices, and geographies Pre-built APIs and modular architecture simplifies integration and accelerates time-to-market Provides real-time analytics, monitoring, and automation to improve the customer
experience KORE One IoT enablement platform providing device and data analysis tools Next-generation, multi-IMSI SIM card and eSIM platform that brings top-tier networks together for global reach, granular control, and developer-friendly
automation Central to Super SIM is KORE’s cloud-scale mobile core, which orchestrates intelligent network selection, automatic failover, and policy-based access Devices can autonomously switch between carriers based on location, signal
strength – ensuring maximum uptime and low latency without manual intervention Roaming Super SIM One platform combining all SIM deployments, offering access to 600+ networks across 200+ countries The Carrier+ offering combines local,
native SIM profiles of Tier 1 cellular networks with roaming Super SIM as a backup (failover) to ensure superior reliability and coverage Native SIM profiles receive prioritized traffic from carriers, delivering higher bandwidth, faster
speeds, and lower latency Full access to 5G networks, which are only available natively, enabling high-bandwidth applications Breadth of carrier relationships positions KORE to deliver Carrier+ across all major networks Carrier+ Combines
global roaming with direct access to Tier-1 cellular networks 2 26
We l l - D i ve r s i f i e d Re c u r r i n g Re ve n u e B a s e A c ro s s G
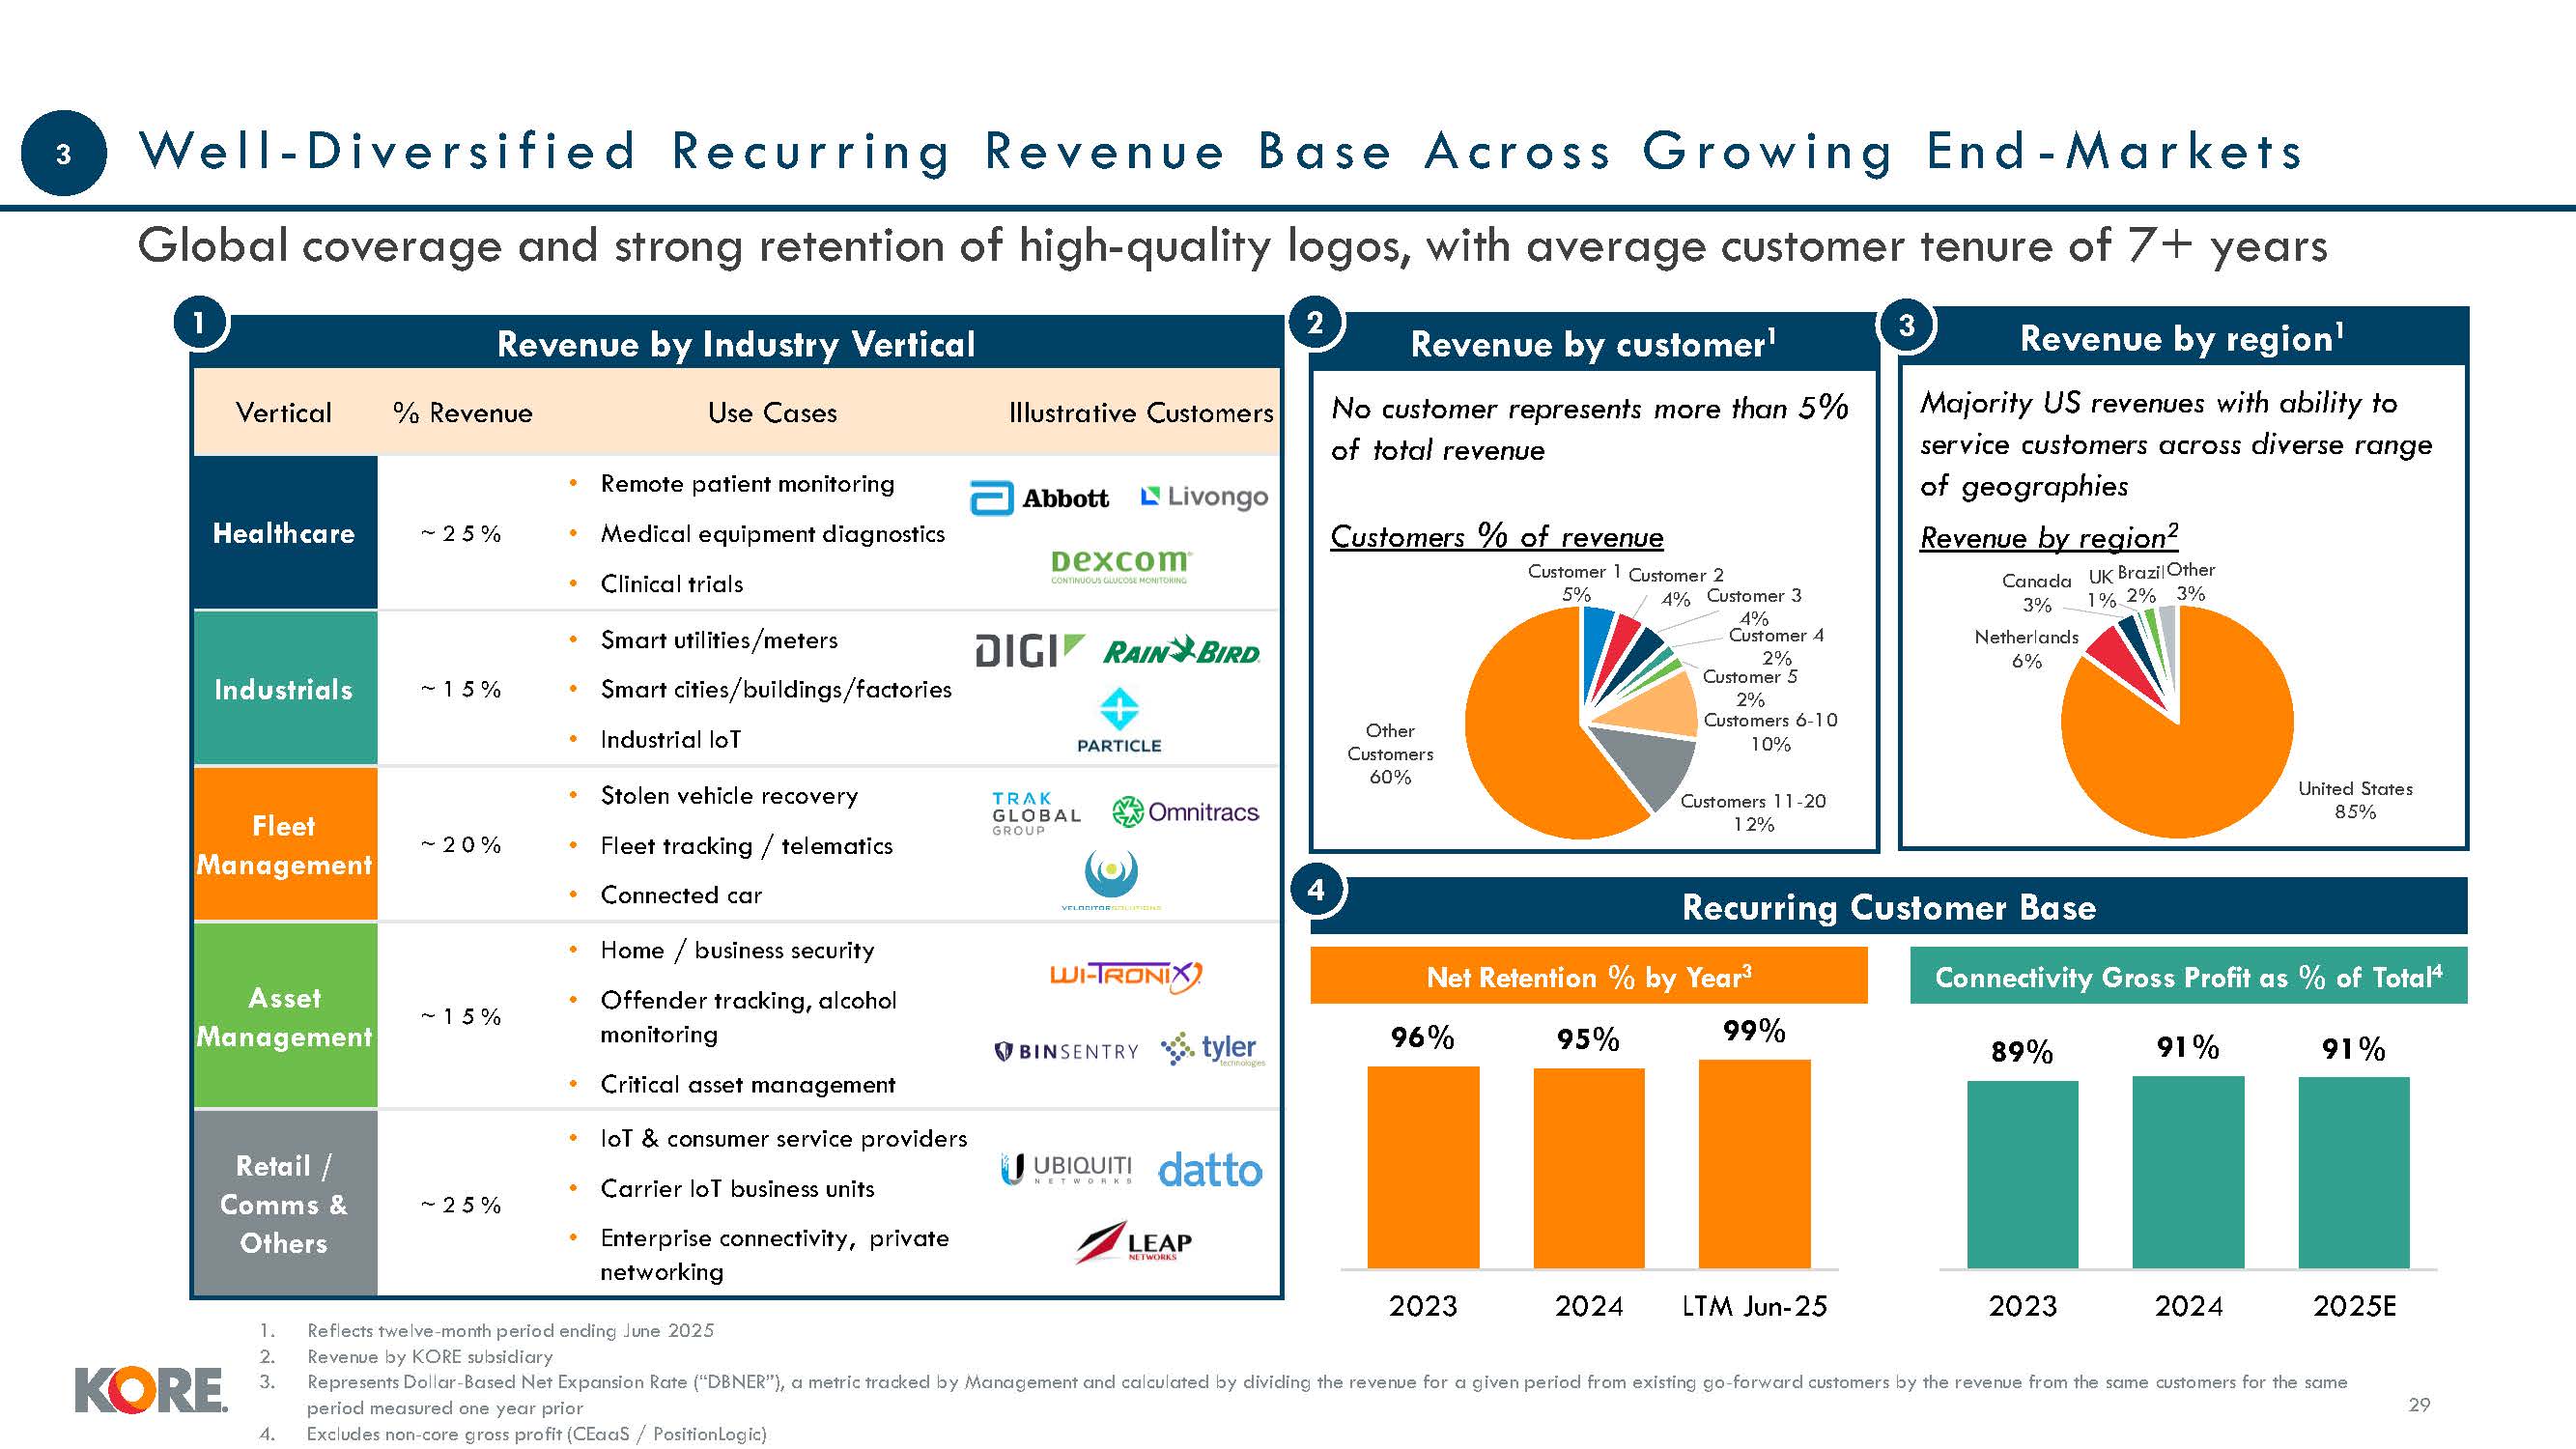
row i n g E n d - M a r ke t s Global coverage and strong retention of high-quality logos, with average customer tenure of 7+ years 29 Revenue by customer1 2 Revenue by region1 3 Reflects twelve-month period ending June 2025 Revenue by
KORE subsidiary Represents Dollar- ased et Expansion Rate (“D ER”), a metric tracked by Management and calculated by dividing the revenue for a given period from existing go-forward customers by the revenue from the same customers for the same
period measured one year prior Excludes non-core gross profit (CEaaS / PositionLogic) Recurring Customer Base 4 Net Retention % by Year3 1 Revenue by Industry Vertical Vertical % Revenue Use Cases Illustrative Customers Healthcare ~
2 5 % Remote patient monitoring Medical equipment diagnostics Clinical trials Industrials ~ 1 5 % Smart utilities/meters Smart cities/buildings/factories Industrial IoT Fleet Management ~ 2 0 % Stolen vehicle recovery Fleet tracking
/ telematics Connected car Asset Management ~ 1 5 % Home / business security Offender tracking, alcohol monitoring Critical asset management Retail / Comms & Others ~ 2 5 % IoT & consumer service providers Carrier IoT business
units Enterprise connectivity, private networking No customer represents more than 5% of total revenue Customers % of revenue Customer 1 Customer 2 5% 4% 4% Customer 3 Customer 4 2% Customer 5 2% Customers 6-10 10% Customers
11-20 12% Other Customers 60% United States 85% 3% Netherlands 6% Majority US revenues with ability to service customers across diverse range of geographies Revenue by region2 Canada UK BrazilOther 1% 2% 3% 96% 95% 99% 2023 2024 LTM
Jun-25 2023 2024 2025E Connectivity Gross Profit as % of Total4 89% 91% 91% 3
P r o v e n S u c c e s s i n S e r v i n g H i g h - B a n d w i d t h I o T U s
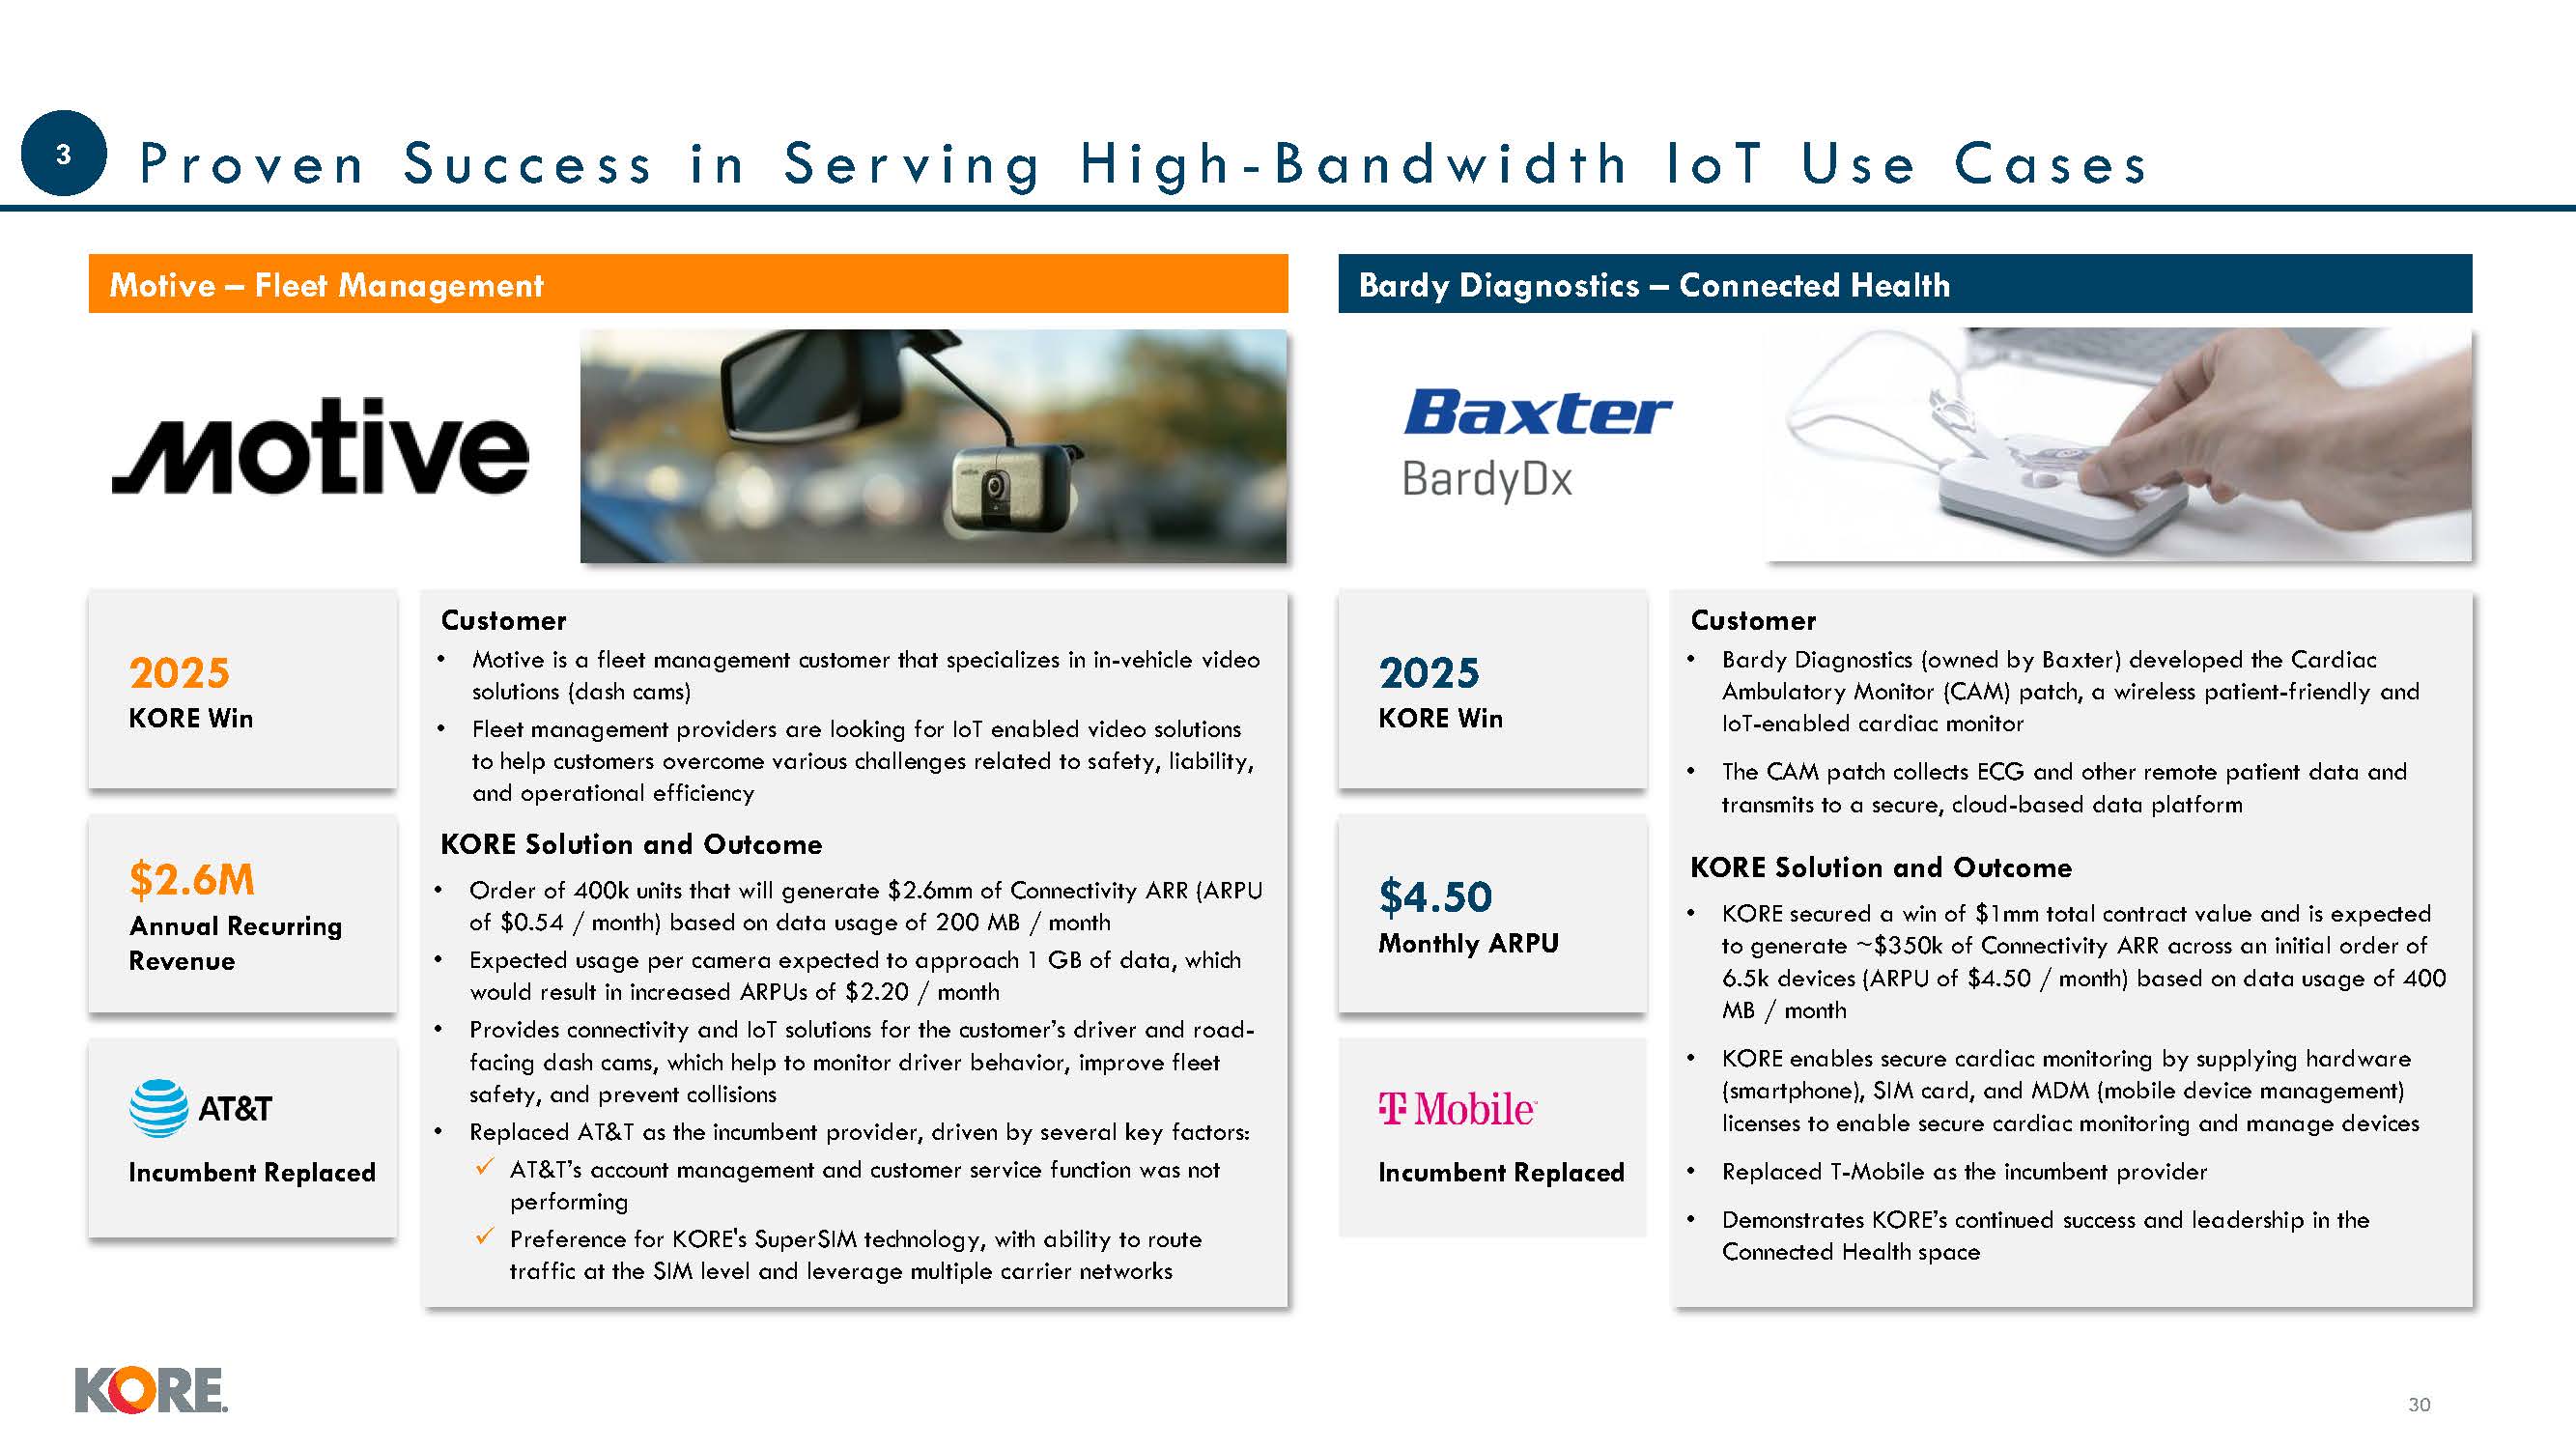
e C a s e s 30 Motive – Fleet Management Bardy Diagnostics – Connected Health 2025 KORE Win $2.6M Annual Recurring Revenue Incumbent Replaced Customer Motive is a fleet management customer that specializes in in-vehicle video
solutions (dash cams) Fleet management providers are looking for IoT enabled video solutions to help customers overcome various challenges related to safety, liability, and operational efficiency KORE Solution and Outcome Order of 400k units
that will generate $2.6mm of Connectivity ARR (ARPU of $0.54 / month) based on data usage of 200 MB / month Expected usage per camera expected to approach 1 GB of data, which would result in increased ARPUs of $2.20 / month Provides
connectivity and IoT solutions for the customer’s driver and road-facing dash cams, which help to monitor driver behavior, improve fleet safety, and prevent collisions Replaced AT&T as the incumbent provider, driven by several key
factors: AT&T’s account management and customer service function was not performing Preference for KORE's SuperSIM technology, with ability to route traffic at the SIM level and leverage multiple carrier networks 3 2025 KORE
Win $4.50 Monthly ARPU Customer Bardy Diagnostics (owned by Baxter) developed the Cardiac Ambulatory Monitor (CAM) patch, a wireless patient-friendly and IoT-enabled cardiac monitor The CAM patch collects ECG and other remote patient data
and transmits to a secure, cloud-based data platform KORE Solution and Outcome KORE secured a win of $1mm total contract value and is expected to generate ~$350k of Connectivity ARR across an initial order of 6.5k devices (ARPU of $4.50 /
month) based on data usage of 400 MB / month KORE enables secure cardiac monitoring by supplying hardware (smartphone), SIM card, and MDM (mobile device management) licenses to enable secure cardiac monitoring and manage devices Replaced
T-Mobile as the incumbent provider Demonstrates KORE’s continued success and leadership in the Connected Health space Incumbent Replaced
G r o w i n g R e c u r r i n g M i x S u p p o r t s D u r a b l e O p e r a t i
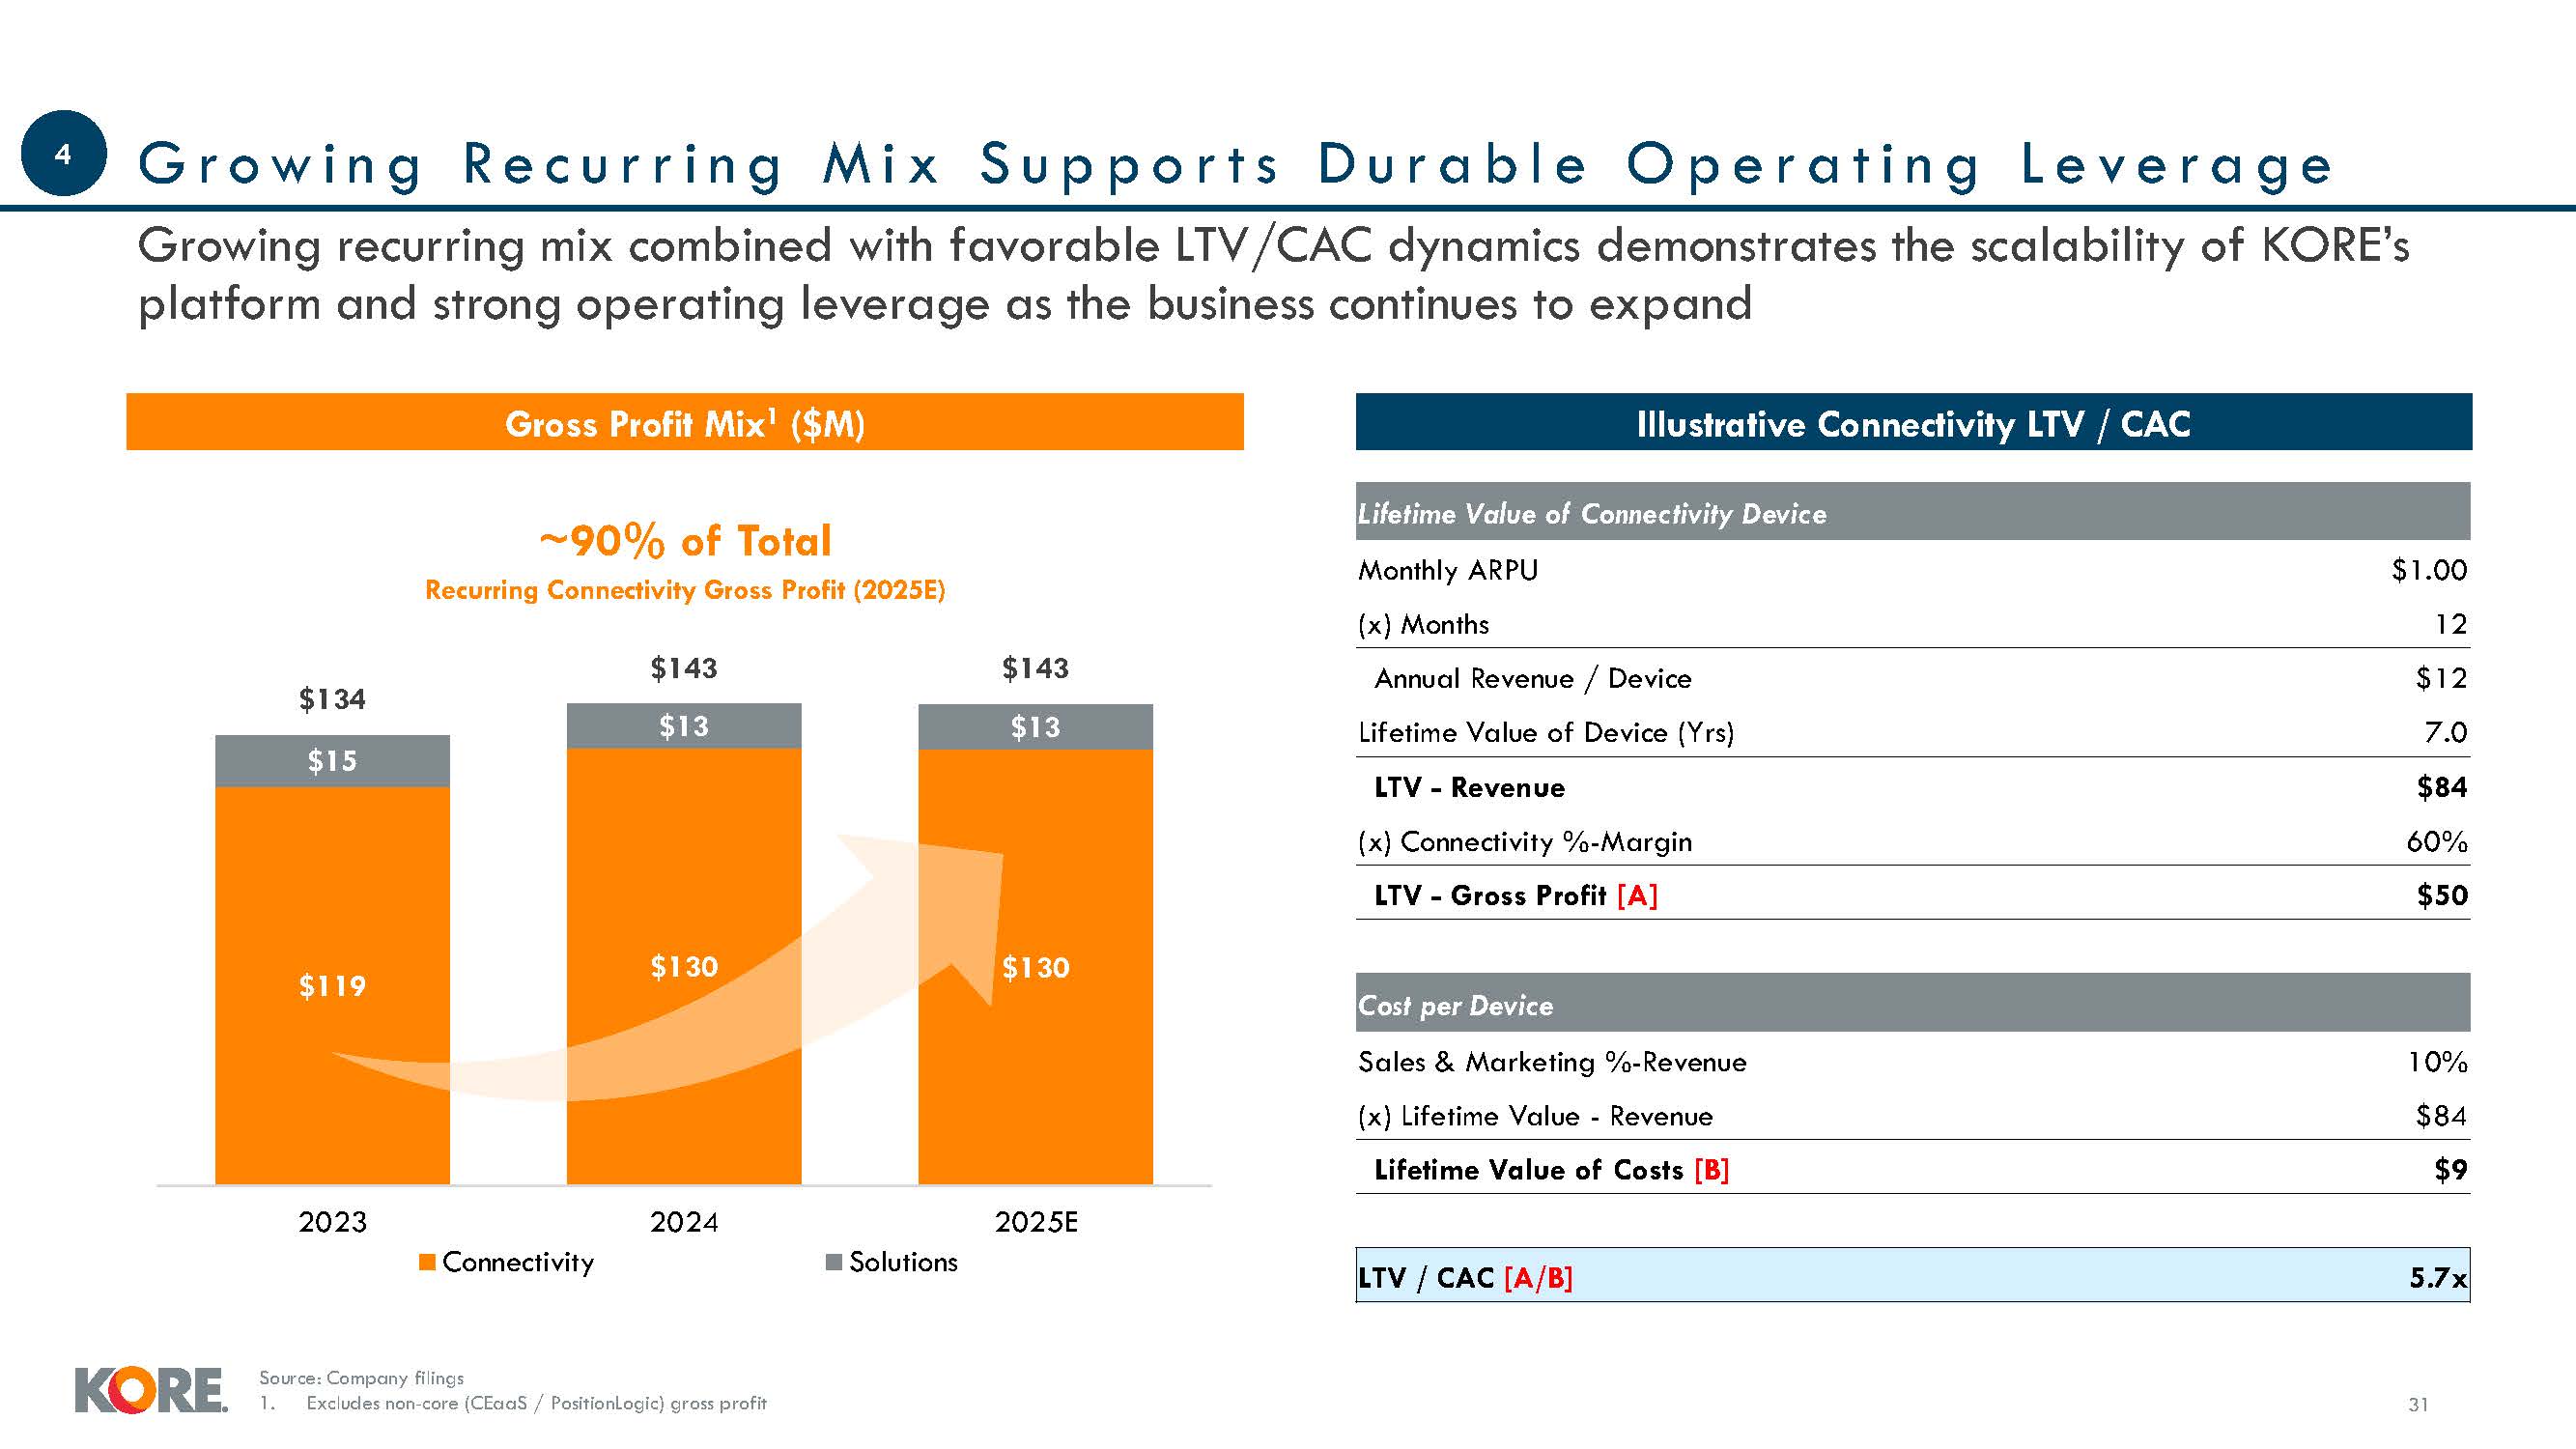
n g L e v e r a g e 31 Gross Profit Mix1 ($M) Illustrative Connectivity LTV / CAC Source: Company filings 1. Excludes non-core (CEaaS / PositionLogic) gross
profit $119 $15 $13 $13 $134 $143 $143 2023 2024 2025E Connectivity Solutions ~90% of Total Recurring Connectivity Gross Profit (2025E) Growing recurring mix combined with favorable LTV/CAC dynamics demonstrates the scalability
of KORE’s platform and strong operating leverage as the business continues to expand Lifetime Value of Connectivity Device Monthly ARPU $1.00 (x) Months 12 Annual Revenue / Device $12 Lifetime Value of Device (Yrs) 7.0 LTV -
Revenue $84 (x) Connectivity %-Margin 60% LTV - Gross Profit [A] $50 $130 $130 Cost per Device Sales & Marketing %-Revenue 10% (x) Lifetime Value - Revenue $84 Lifetime Value of Costs [B] $9 LTV / CAC [A/B] 5.7x 4

Financial Overview Proprietary & confidential to KORE Wireless |32
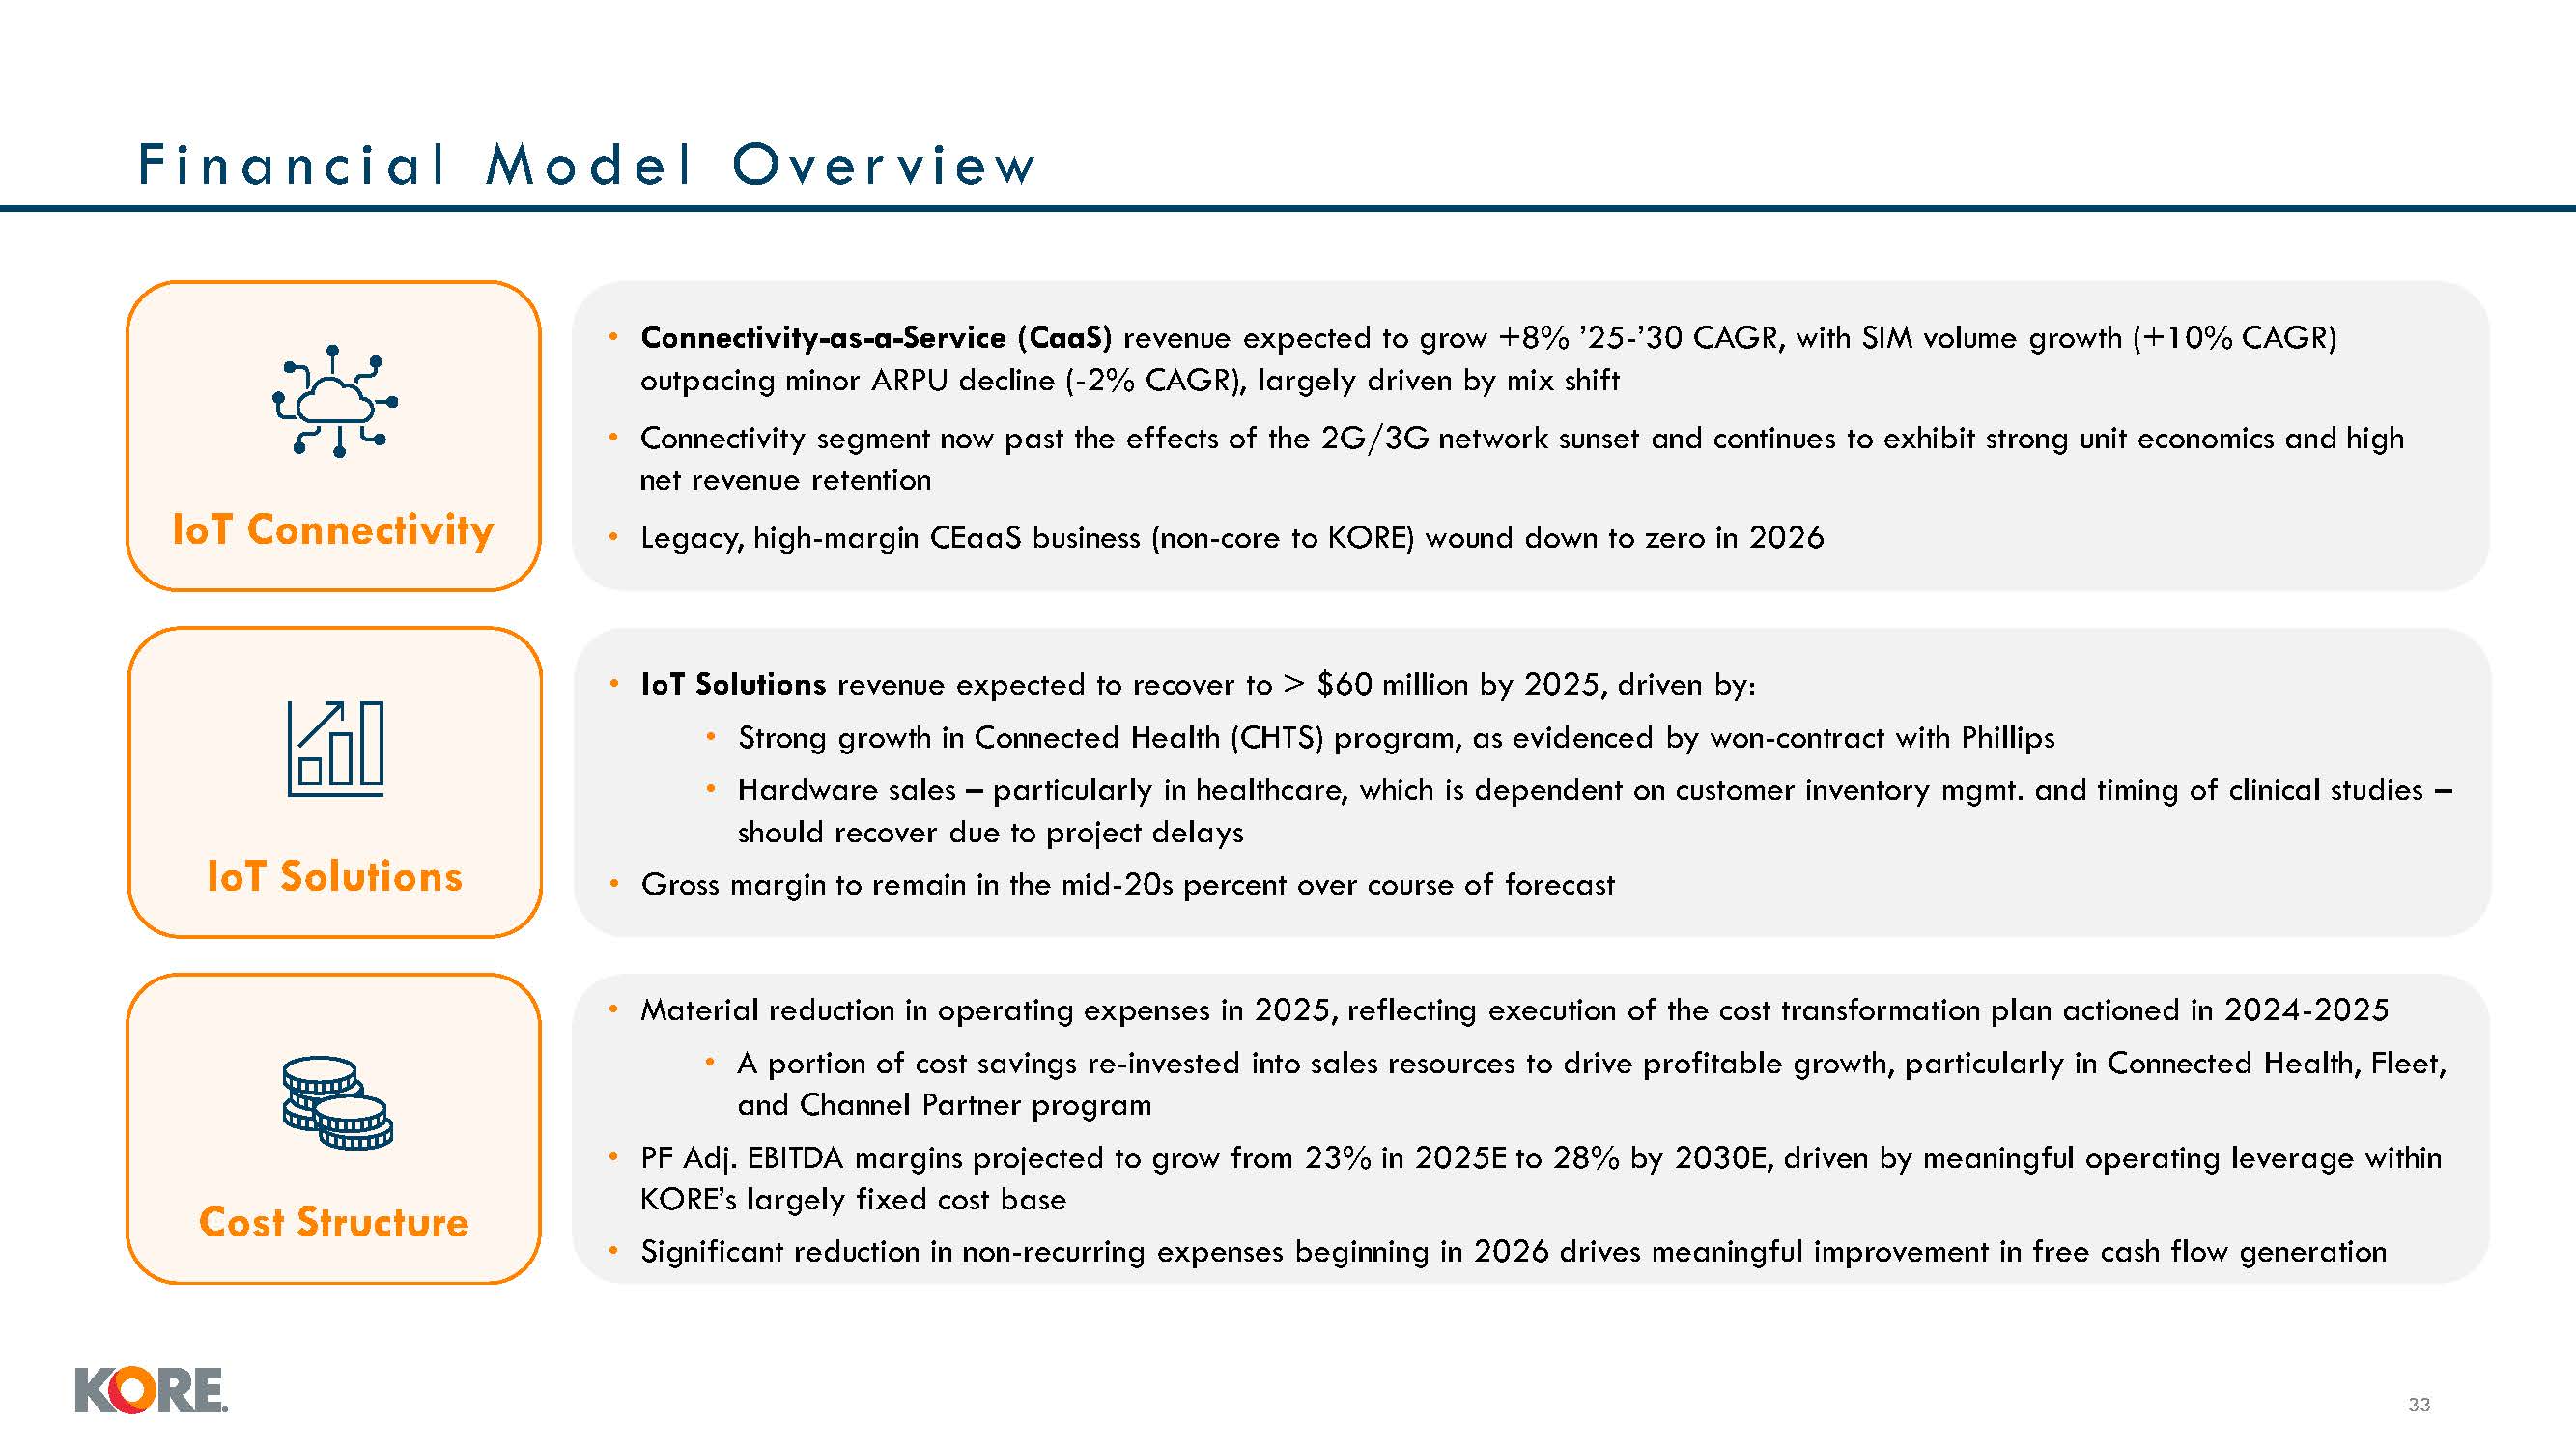
F i n a n c i a l M o d e l Over v i ew 33 Connectivity-as-a-Service (CaaS)
revenue expected to grow +8% ’2 -’30 CAGR, with SIM volume growth (+10% CAGR) outpacing minor ARPU decline (-2% CAGR), largely driven by mix shift Connectivity segment now past the effects of the 2G/3G network sunset and continues to exhibit
strong unit economics and high net revenue retention Legacy, high-margin CEaaS business (non-core to KORE) wound down to zero in 2026 IoT Connectivity IoT Solutions revenue expected to recover to > $60 million by 2025, driven by: Strong
growth in Connected Health (CHTS) program, as evidenced by won-contract with Phillips Hardware sales – particularly in healthcare, which is dependent on customer inventory mgmt. and timing of clinical studies – should recover due to project
delays Gross margin to remain in the mid-20s percent over course of forecast IoT Solutions Material reduction in operating expenses in 2025, reflecting execution of the cost transformation plan actioned in 2024-2025 A portion of cost
savings re-invested into sales resources to drive profitable growth, particularly in Connected Health, Fleet, and Channel Partner program PF Adj. EBITDA margins projected to grow from 23% in 2025E to 28% by 2030E, driven by meaningful
operating leverage within KORE’s largely fixed cost base Significant reduction in non-recurring expenses beginning in 2026 drives meaningful improvement in free cash flow generation Cost Structure
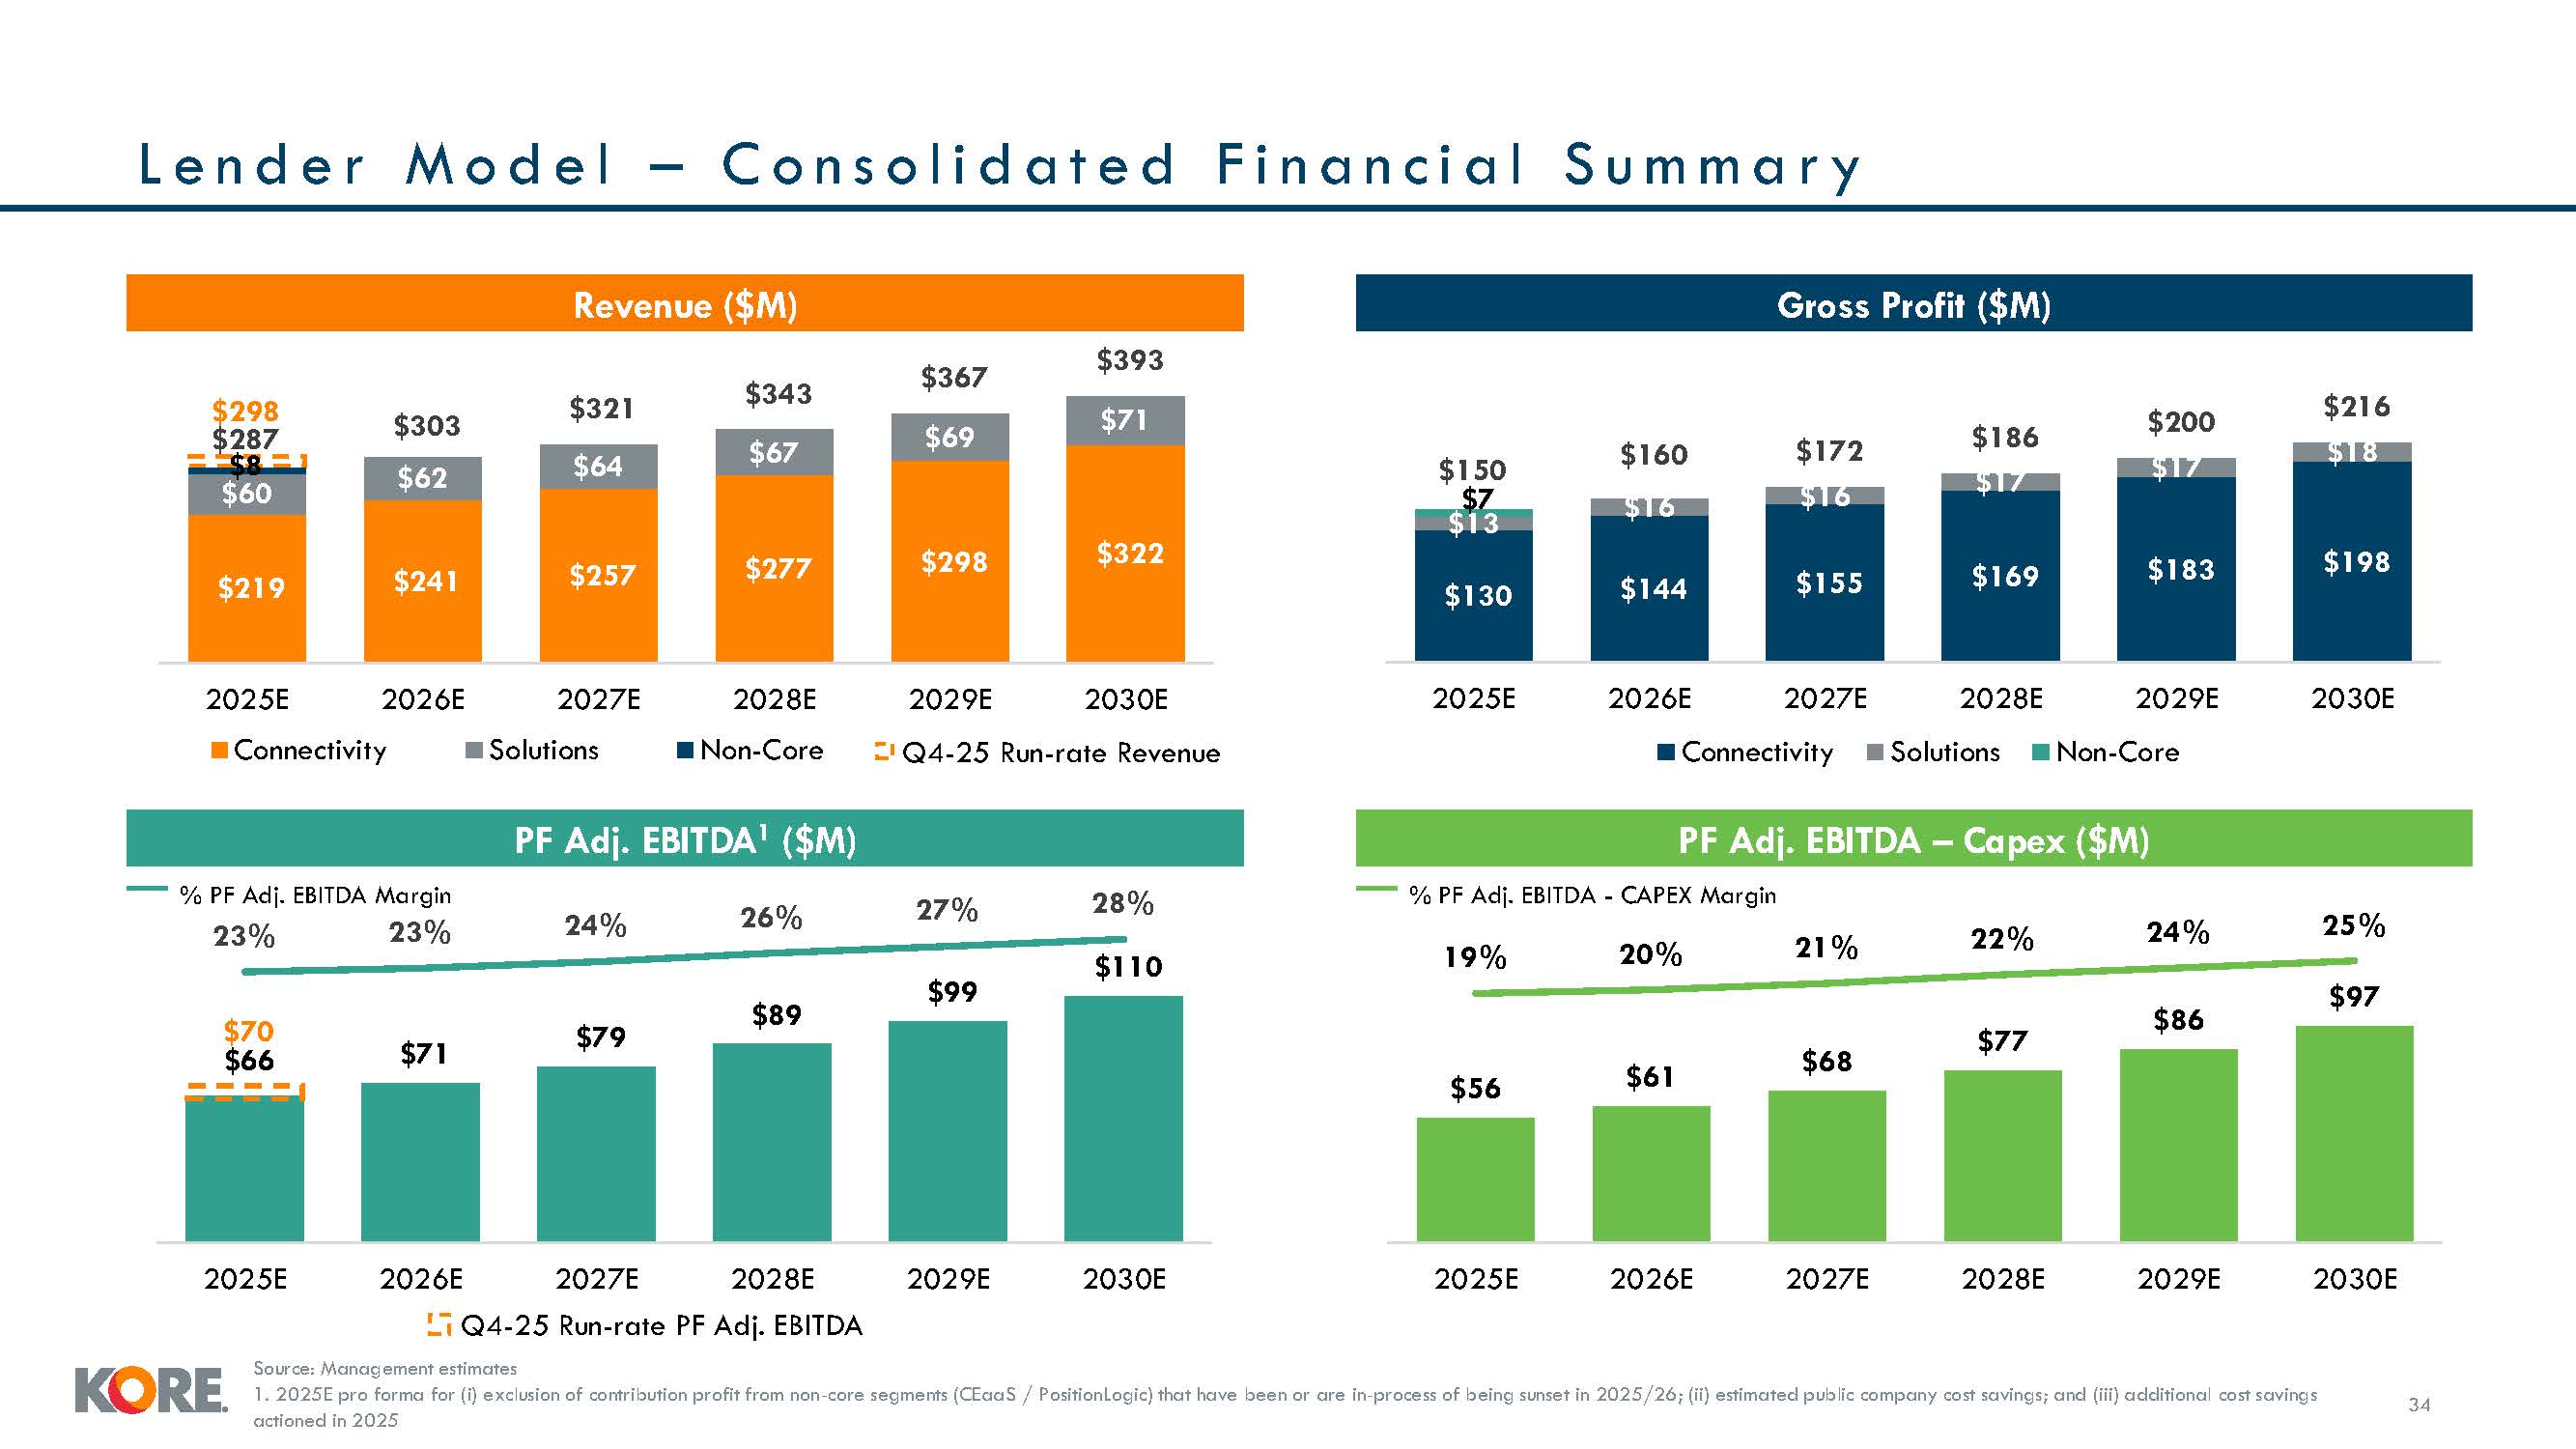
L e n d e r M o d e l – C o n s o l i d a t e d F i n a n c i a l S u m m a r
y 34 Revenue ($M) Gross Profit ($M) PF Adj. EBITDA1 ($M) PF Adj. EBITDA – Capex ($M) $219 $241 $257 $277 $298 $322 $62 $64 $67 $69 $71 $8 $60 $303 $321 $343 $367 $393 2025E
2026E Connectivity 2027E Solutions 2028E Non-Core $298 $287 2029E 2030E Q4-25 Run-rate Revenue $71 $79 $89 $99 23% 23% 24% 28% $110 26% 27% 2025E 2026E 2027E 2028E 2029E 2030E 2025E 2026E 2027E 2028E
2029E $56 $61 $68 $77 $86 $97 19% 20% 21% 22% 24% 25% 2030E $130 $144 $155 $169 $183 $198 $13 $16 $16 $17 $17 $7 $150 $160 $172 $186 $216 $18 $200 2025E 2026E 2027E 2028E Solutions 2030E Connectivity 2029E Non-Core %
PF Adj. EBITDA Margin $70 $66 % PF Adj. EBITDA - CAPEX Margin Q4-25 Run-rate PF Adj. EBITDA Source: Management estimates 1. 2025E pro forma for (i) exclusion of contribution profit from non-core segments (CEaaS / PositionLogic) that have
been or are in-process of being sunset in 2025/26; (ii) estimated public company cost savings; and (iii) additional cost savings actioned in 2025
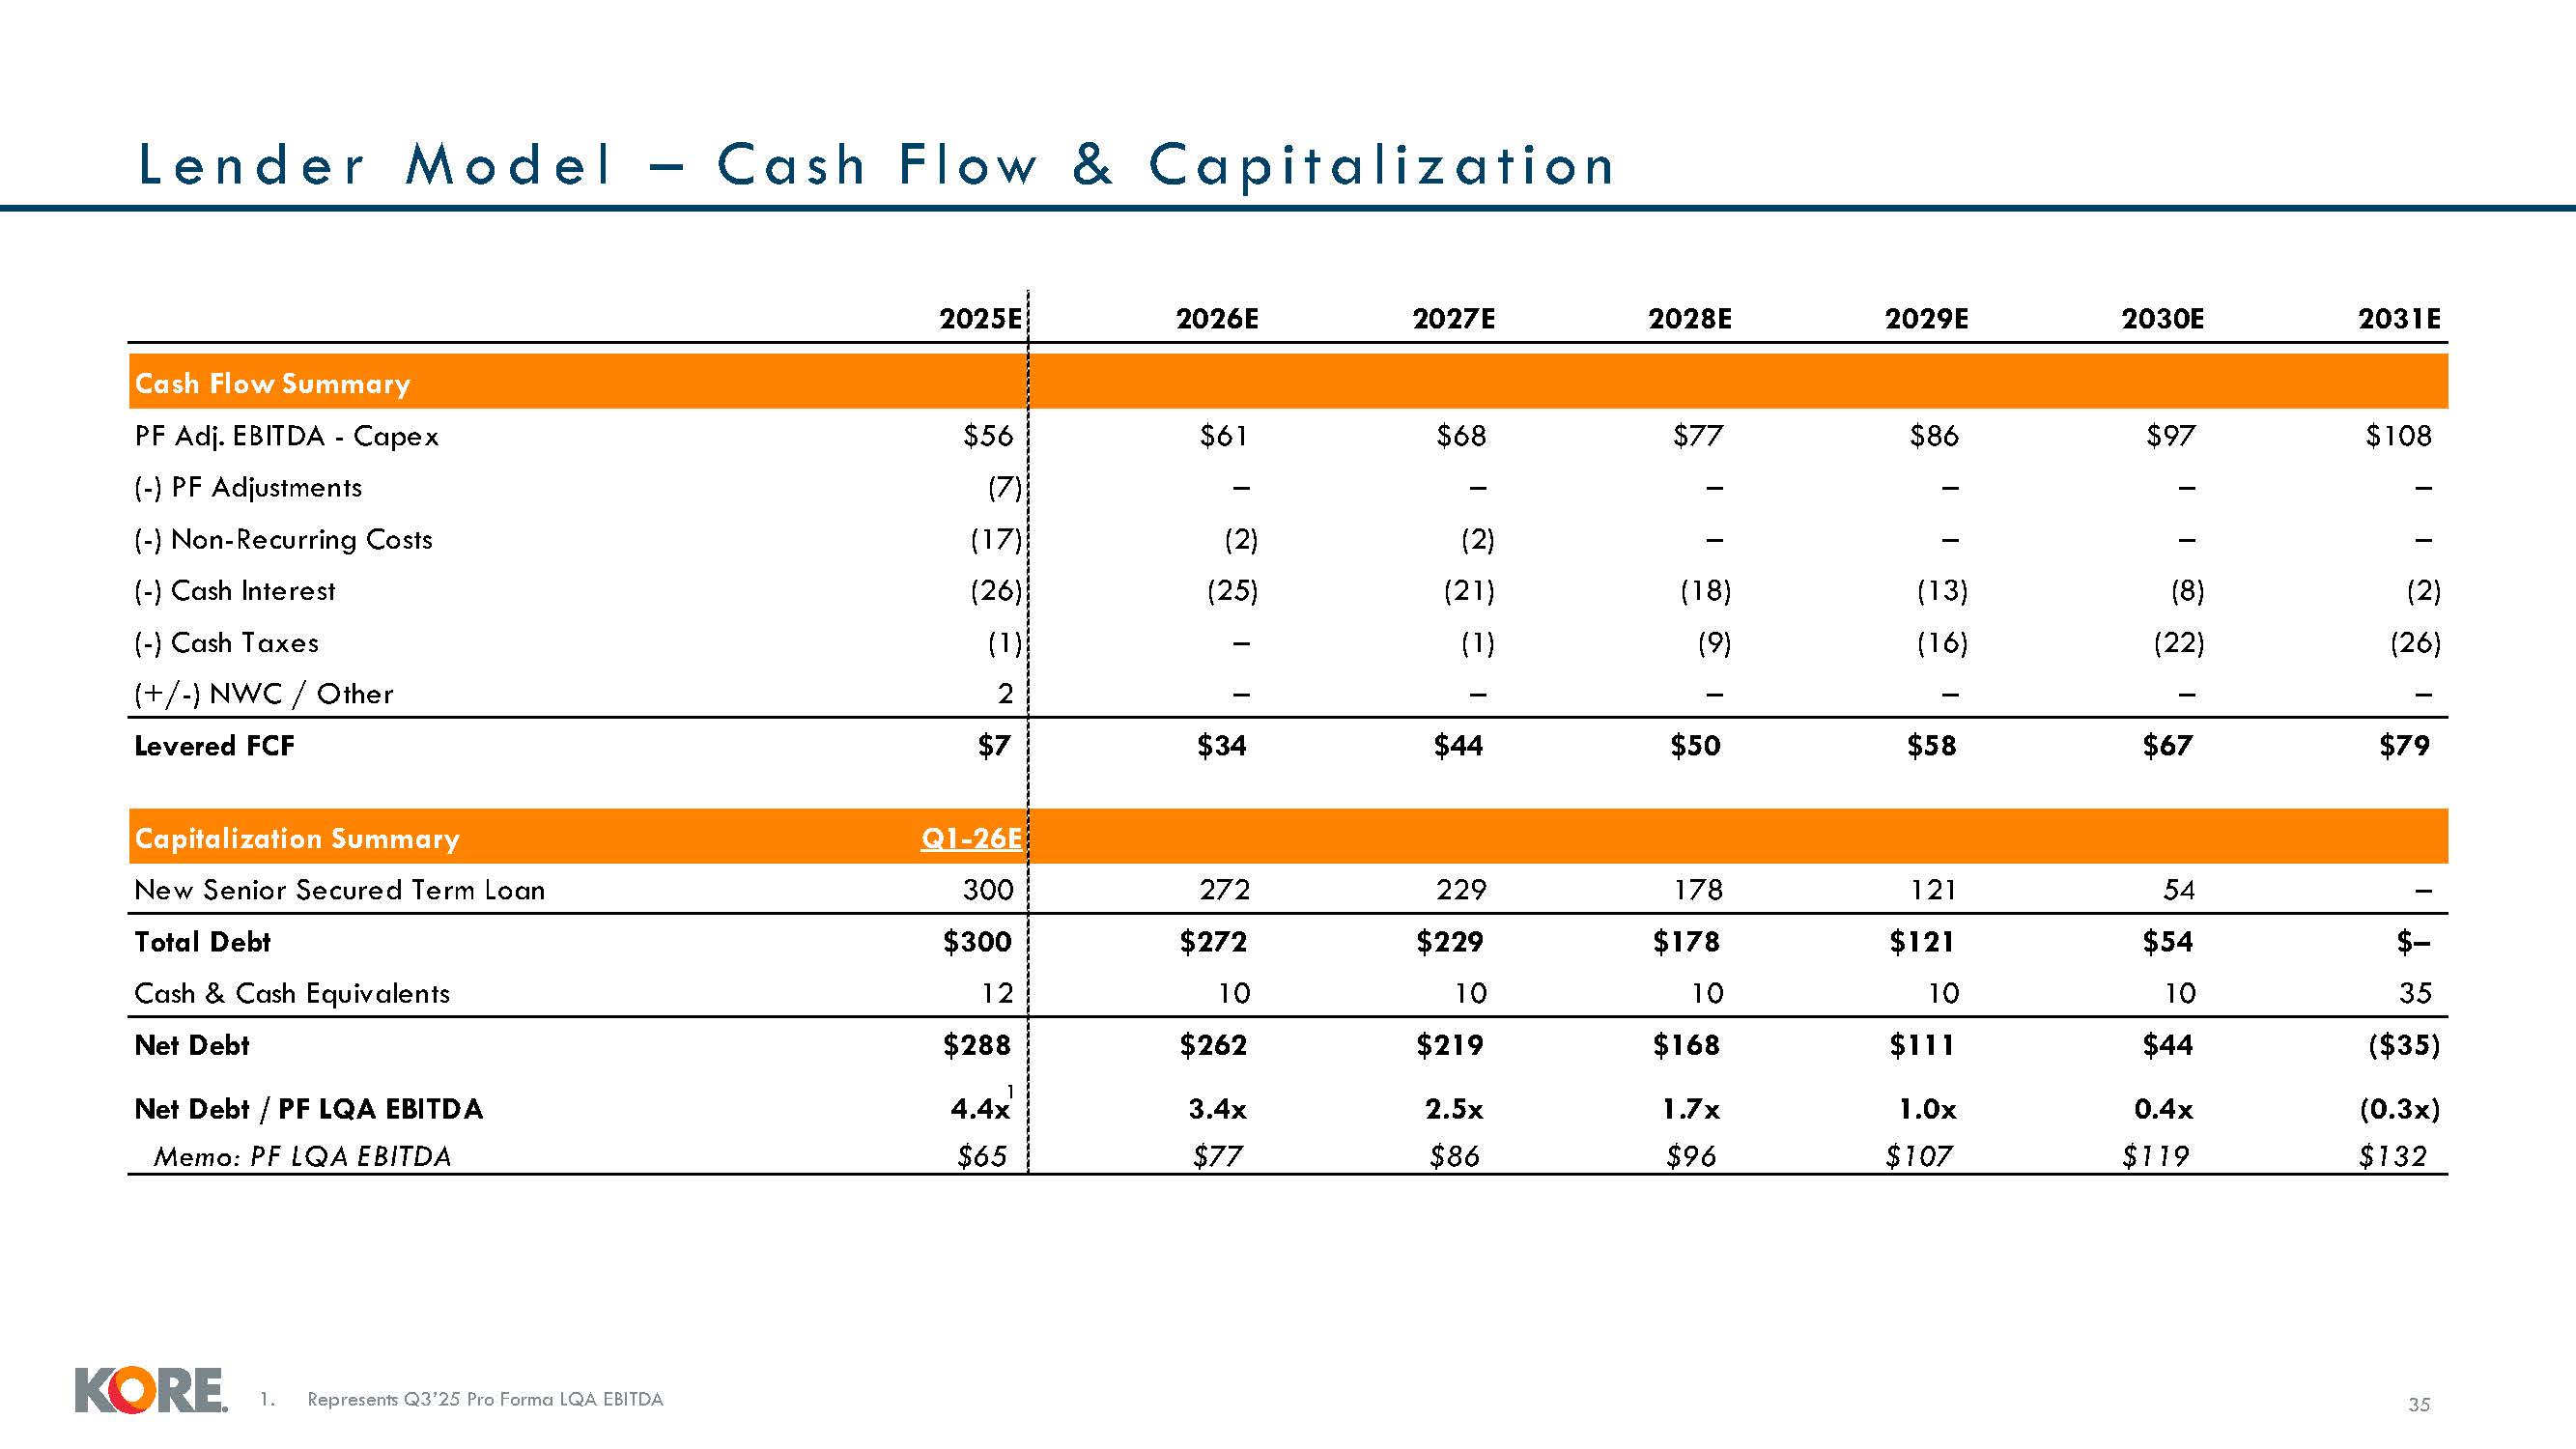
2025E 2026E 2027E 2028E 2029E 2030E 2031E Cash Flow Summary PF Adj. EBITDA
- Capex $56 $61 $68 $77 $86 $97 $108 (-) PF Adjustments (7) – – – – – – (-) Non-Recurring Costs (17) (2) (2) – – – – (-) Cash Interest (26) (25) (21) (18) (13) (8) (2) (-) Cash Taxes (1) –
(1) (9) (16) (22) (26) (+/-) NWC / Other 2 – – – – – – Levered FCF $7 $34 $44 $50 $58 $67 $79 Capitalization Summary Q1-26E New Senior Secured Term Loan 300 272 229 178 121 54 – Total Debt $300 $272
$229 $178 $121 $54 $– Cash & Cash Equivalents 12 10 10 10 10 10 35 Net Debt $288 $262 $219 $168 $111 $44 ($35) Net Debt / PF LQA EBITDA 1 4.4x 3.4x 2.5x 1.7x 1.0x 0.4x (0.3x) Memo: PF LQA EBITDA $65 $77
$86 $96 $107 $119 $132 L e n d e r M o d e l – Cas h F l ow & Capitaliz at i on 35 1. Represents 3’2 Pro orma L A E ITDA

Appendix Proprietary & confidential to KORE Wireless |36
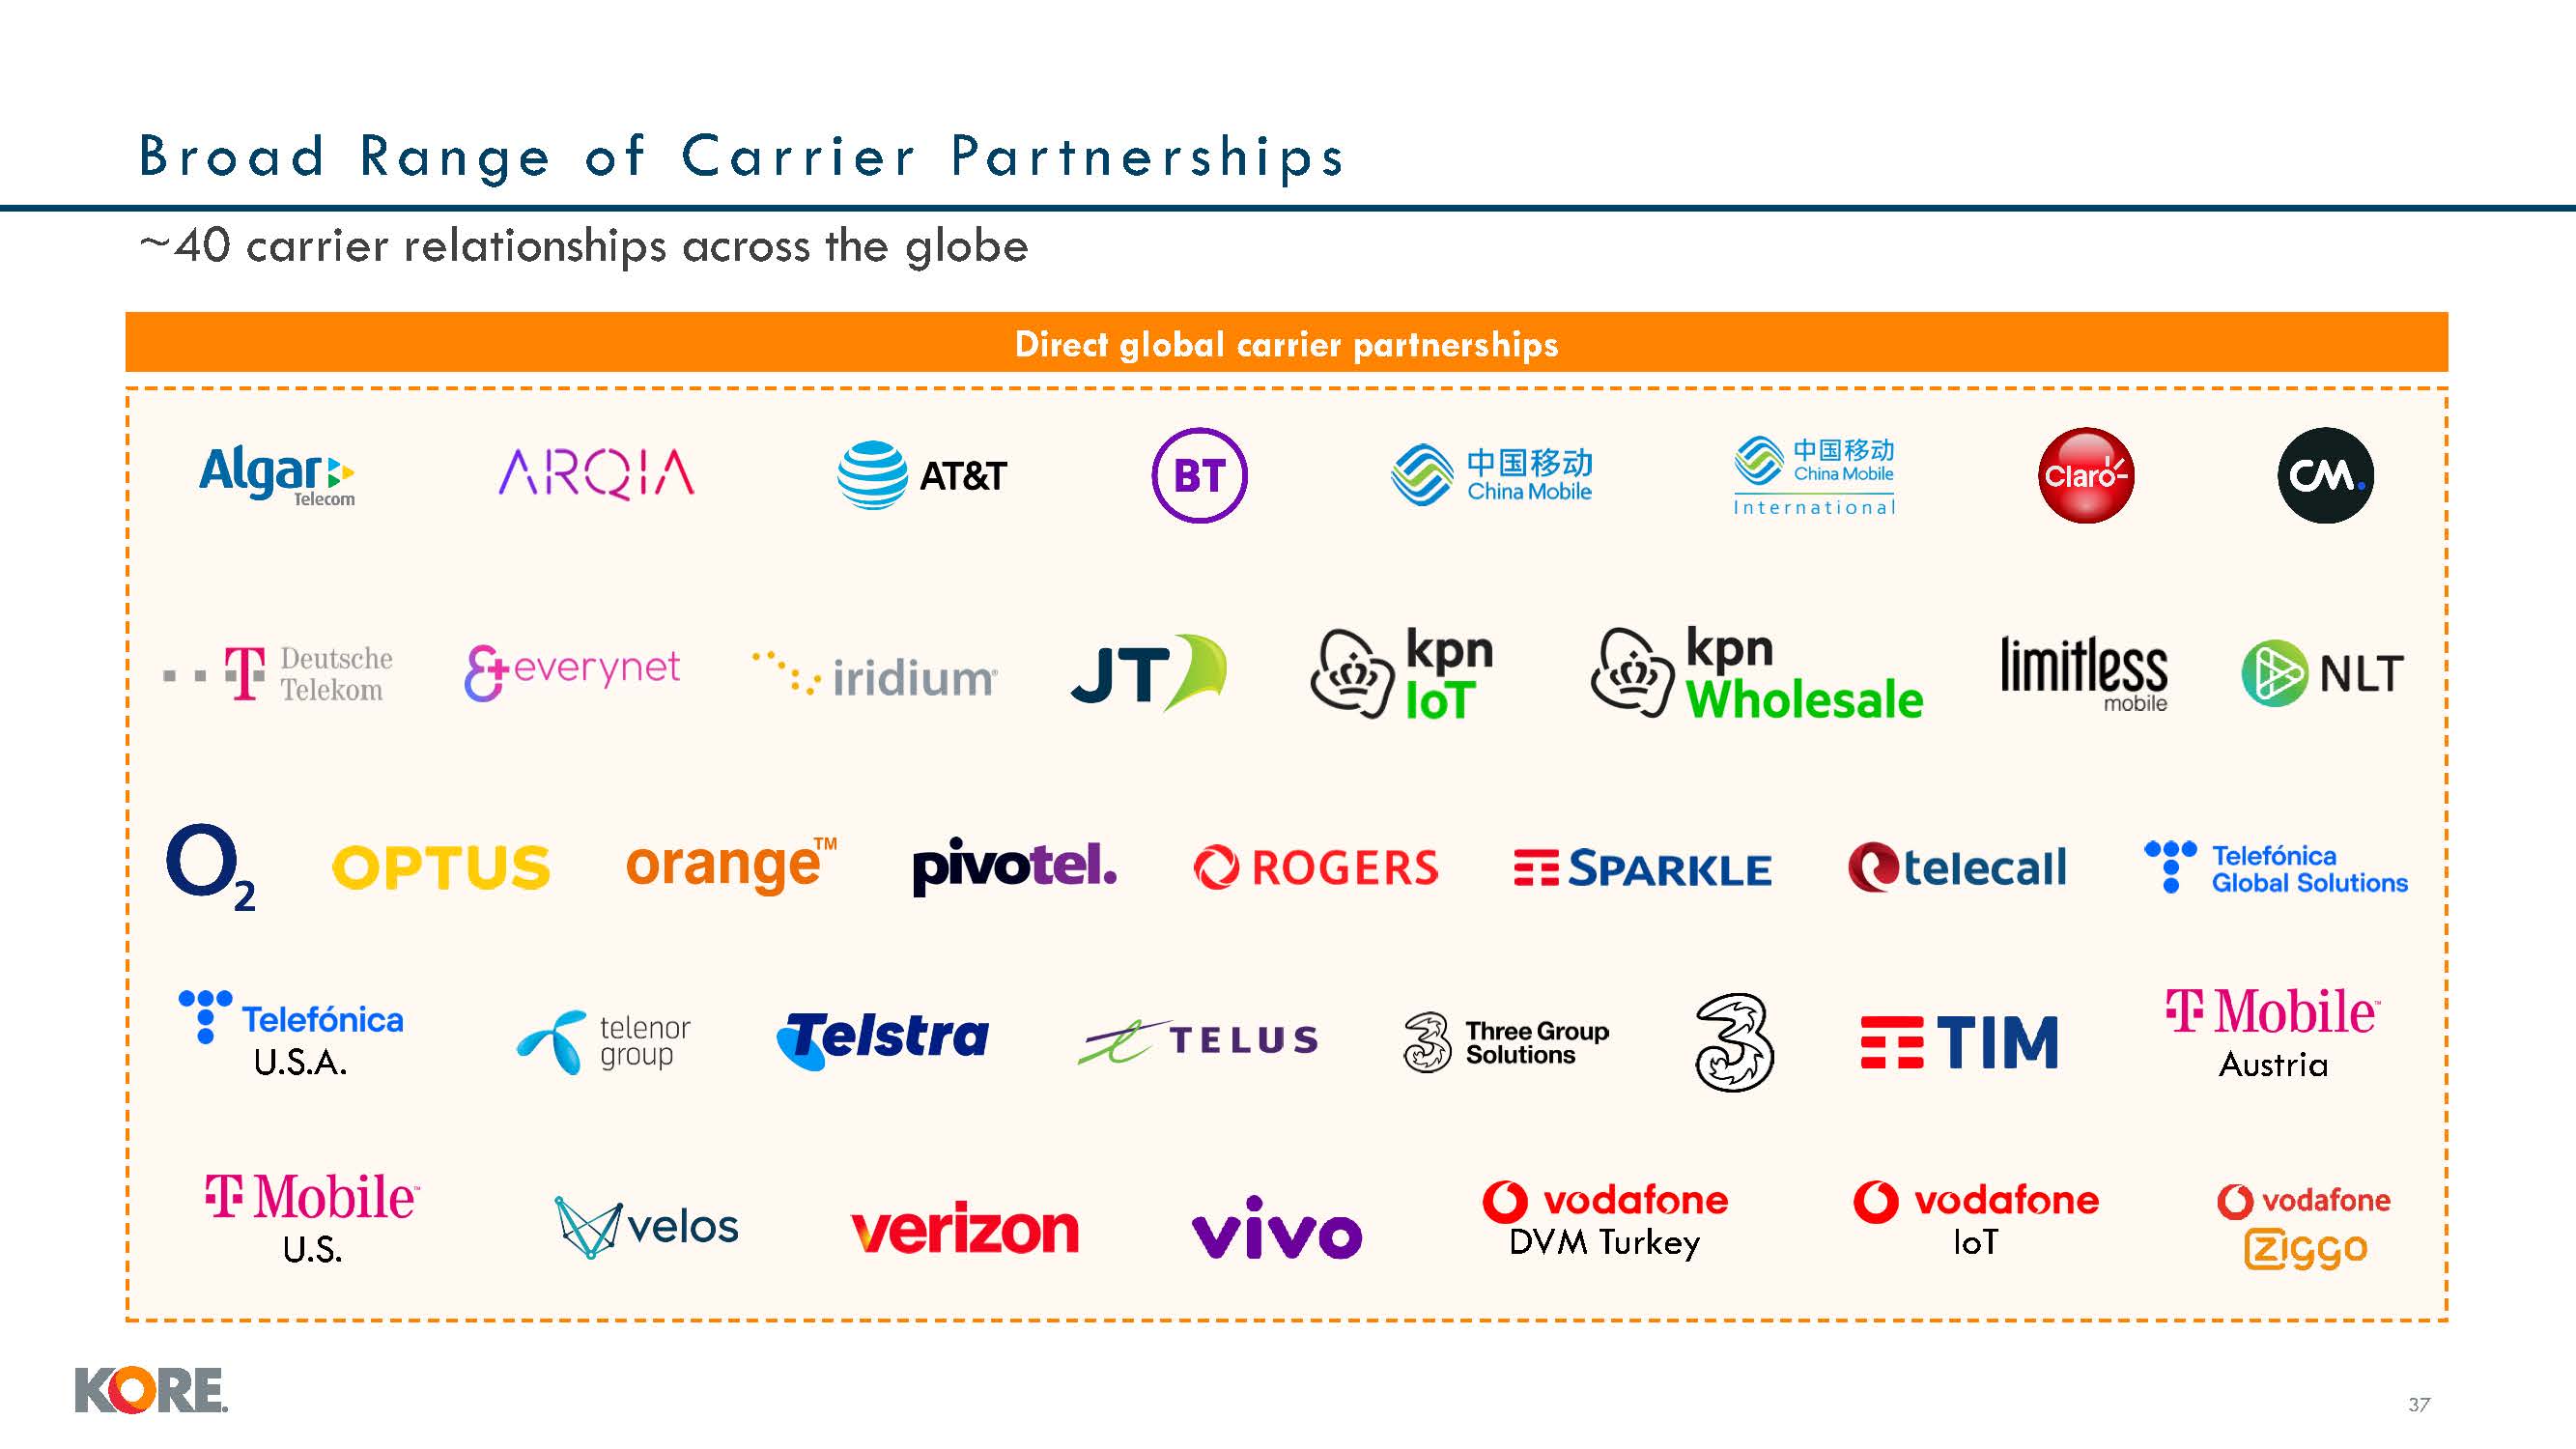
~40 carrier relationships across the globe Direct global carrier
partnerships Broad Ran ge of C ar r i er Par t n er s h i ps U.S.A. Austria U.S. DVM Turkey IoT 37
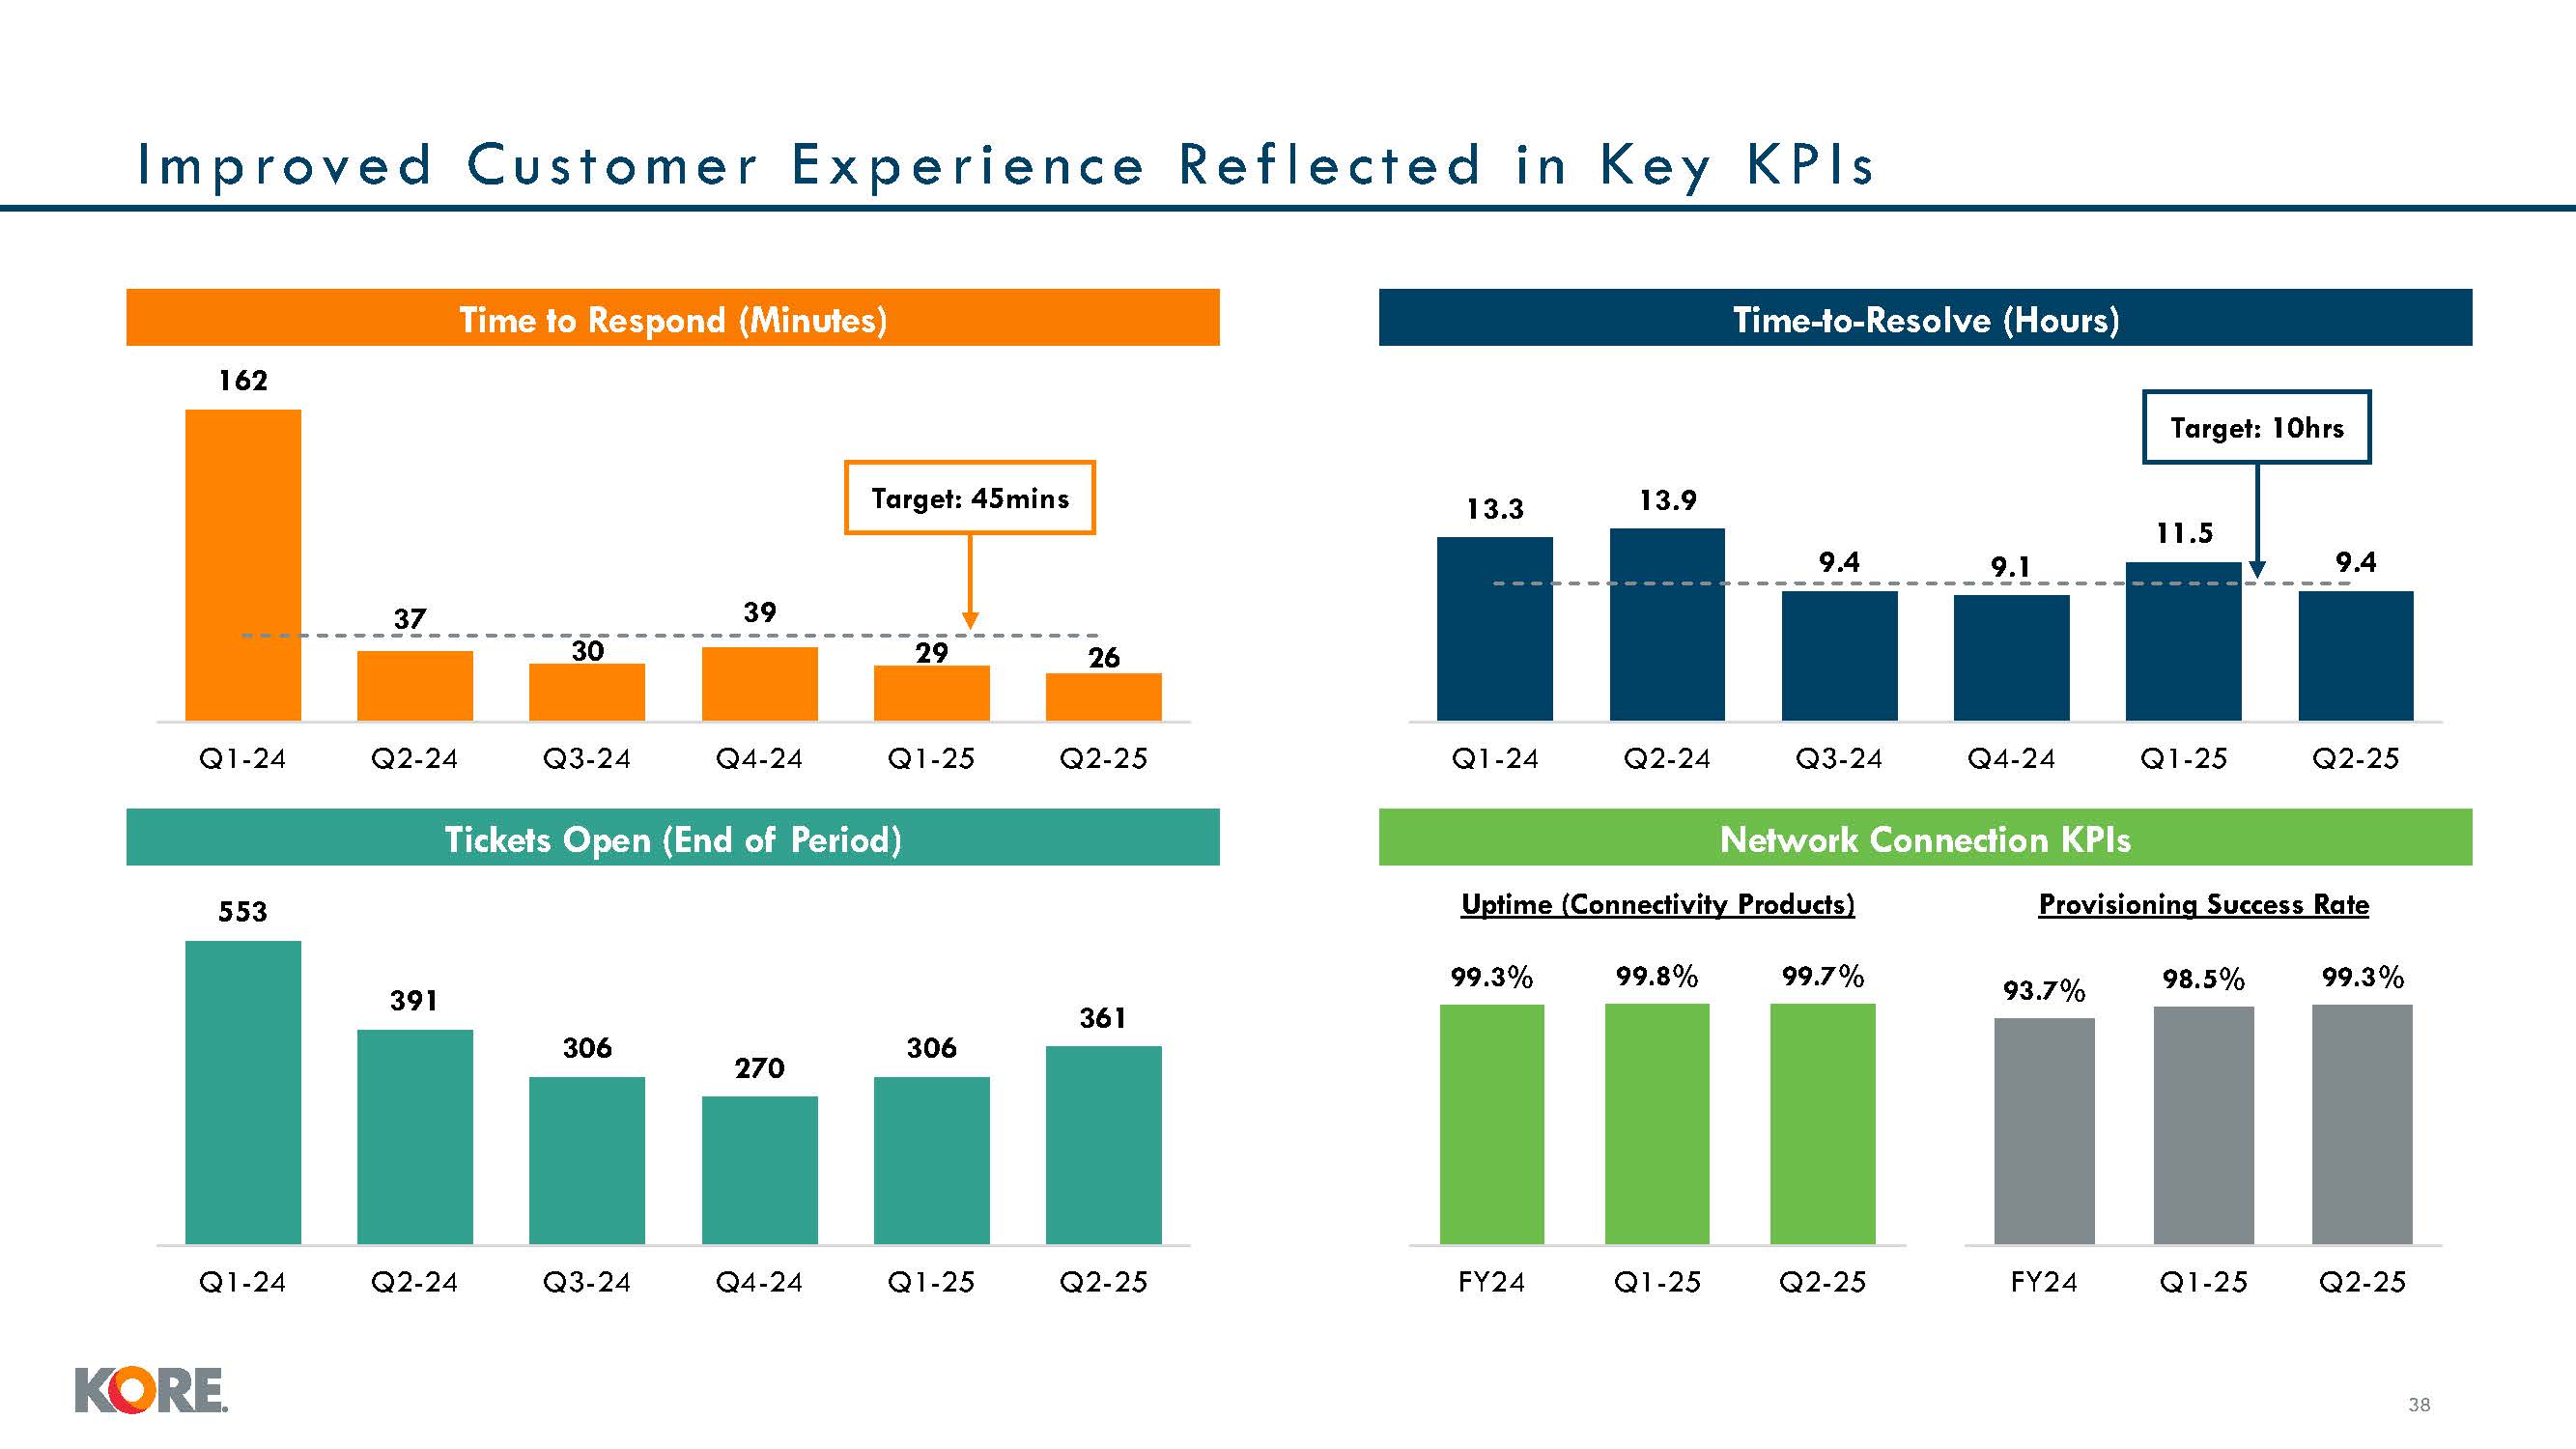
Time to Respond (Minutes) Time-to-Resolve (Hours) Tickets Open (End of
Period) Uptime (Connectivity Products) Provisioning Success Rate 162 37 30 39 29 26 Q1-24 Q2-24 Q3-24 Q4-24 Q1-25 Q2-25 13.3 13.9 9.4 9.1 11.5 9.4 Q1-24 Q2-24 Q3-24 Q4-24 Q1-25
Q2-25 553 391 306 270 306 361 Q1-24 Q2-24 Q3-24 Q4-24 Q1-25 Q2-25 99.3% 99.8% 99.7% FY24 Q1-25 Q2-25 Improved C u s t omer E xper i en ce Ref l ected i n Key KPIs 93.7% 98.5% 99.3% FY24 Q1-25 Q2-25 Target: 45mins Target:
10hrs 37 Network Connection KPIs