Project Kona Process and valuation materials February 11, 2026 DRAFT All
numbers and references herein are highly preliminary and subject to material refinement Exhibit (c)(x)
PRELIMINARY, ILLUSTRATIVE DRAFT – FOR REFERENCE ONLY AND SUBJECT TO MATERIAL
CHANGE Disclaimer 1. Section name This presentation was prepared by Rothschild & Co US Inc. (“Rothschild & Co”) on a confidential basis for the benefit and internal use of the Special Committee (the “Special Committee”) of the Board
of Directors of KORE Group Holdings, Inc. (the “Company” or “Kona”) in the context of the Special Committee’s consideration of the matters described herein. In creating this presentation, Rothschild & Co has relied upon information that is
publicly available or which was provided to Rothschild & Co by or on behalf of the Company’s management, including, without limitation, management operating and financial forecasts or projections. Such information involves numerous
significant assumptions and subjective determinations that may or may not be correct. Rothschild & Co has not assumed any responsibility for independent verification of any of such information contained herein, including, but not limited
to, any forecasts or projections set forth herein, and Rothschild & Co has relied on such information being complete and accurate in all material respects. Accordingly, no representation or warranty, express or implied, can be made or is
made by Rothschild & Co as to the accuracy or completeness of any such information or the achievability of any such forecasts or projections. Except where otherwise indicated, this presentation speaks as of the date hereof and is
necessarily based upon the information available to Rothschild & Co and financial, stock market and other conditions and circumstances existing and disclosed to Rothschild & Co as of the date hereof, all of which are subject to change.
Rothschild & Co does not have any obligation to update, bring-down, review or reaffirm this presentation. Under no circumstances should the delivery of this presentation imply that any information or analyses included in this presentation
would be the same if made as of any other date. Nothing contained in this presentation is, or shall be relied upon as, a promise or representation as to the past, present or future. Nothing contained herein shall be deemed to be a
recommendation from Rothschild & Co to any party, including without limitation, any security holder of the Company, to enter into any transaction or to take any course of action. By accepting these materials, the Special Committee
acknowledges that Rothschild & Co is not in the business of providing (and the Special Committee is not relying on Rothschild & Co for) legal, tax or accounting advice, and the Special Committee should receive (and rely on) separate and
qualified legal, tax and accounting advice. These materials do not constitute an offer or solicitation to sell or purchase any securities. Rothschild & Co is not acting in any capacity as a fiduciary or agent of the Special Committee, the
Board of Directors of the Company, the Company or the Company’s security holders. In the ordinary course of their asset management, merchant banking and other business activities, affiliates of Rothschild & Co may at any time hold long or
short positions, and may trade or otherwise effect transactions, for their own accounts or the accounts of their clients in equity, debt or other securities (or related derivative securities) or financial instruments of the Company or any of
its affiliates or any other company that may be involved in any transaction. This presentation is confidential and was not prepared with a view to public disclosure or filing thereof under state or federal securities laws or otherwise. This
presentation may not be copied by, or disclosed or made available to, any person without the prior written consent of Rothschild & Co. This presentation was not prepared for use by readers not as familiar with the business and affairs of
the Company as the Special Committee, and accordingly, Rothschild & Co does not take any responsibility for the accuracy or completeness of any material if used by persons other than the Special Committee. Rothschild & Co shall not
have any liability, whether direct or indirect, in contract or tort or otherwise, to any person in connection with this presentation. 2
PRELIMINARY, ILLUSTRATIVE DRAFT – FOR REFERENCE ONLY AND SUBJECT TO MATERIAL
CHANGE Contents Executive summary Overview of Standalone LTP Preliminary valuation perspectives Appendix – Valuation supplement 4 12 15 19
1 Executive summary
PRELIMINARY, ILLUSTRATIVE DRAFT – FOR REFERENCE ONLY AND SUBJECT TO MATERIAL
CHANGE Rothschild & Co engagement 5 Rothschild & Co US Inc. (“Rothschild & Co” or “We”) has been engaged by the Special Committee (the “Special Committee”) of the Board of Directors of Kona (the “Company”) as financial advisor in
connection with advising the Special Committee with respect to a potential transaction (the “Transaction”) proposed by Samoa (together with its affiliated investment funds) and Amelia (collectively, referred herein as the “Samoa Group”) as
well as in evaluating potential strategic alternatives to the Transaction, and if requested by the Special Committee, rendering an opinion as to the fairness, from a financial point of view, of the consideration to be received by the Company’s
disinterested stockholders. To this end, these materials focus on the following: Review of Kona’s Standalone LTP Preliminary valuation analysis of Kona In connection with our engagement, Rothschild & Co has, among other things: At the
direction of the Special Committee, utilized financial forecasts for Kona, prepared and provided by Kona’s management team (“Management”) and confirmed and approved by Management and by the Special Committee on October 20, 2025 (the “Standalone
Long Term Plan” or “Standalone LTP”) Held discussions with the Special Committee regarding: The proposed Transaction; Past and current business operations and financial condition and prospects of Kona, including the Standalone LTP and the
financial implications thereof; Strategic alternatives available to the Company; and Certain other matters believed necessary or appropriate to our inquiry Held discussions with key members of Management on a regular basis over the course
of our engagement 1.1SITEUxAeTcIOuNtiOvVeEsRuVmIEmWary
PRELIMINARY, ILLUSTRATIVE DRAFT – FOR REFERENCE ONLY AND SUBJECT TO MATERIAL
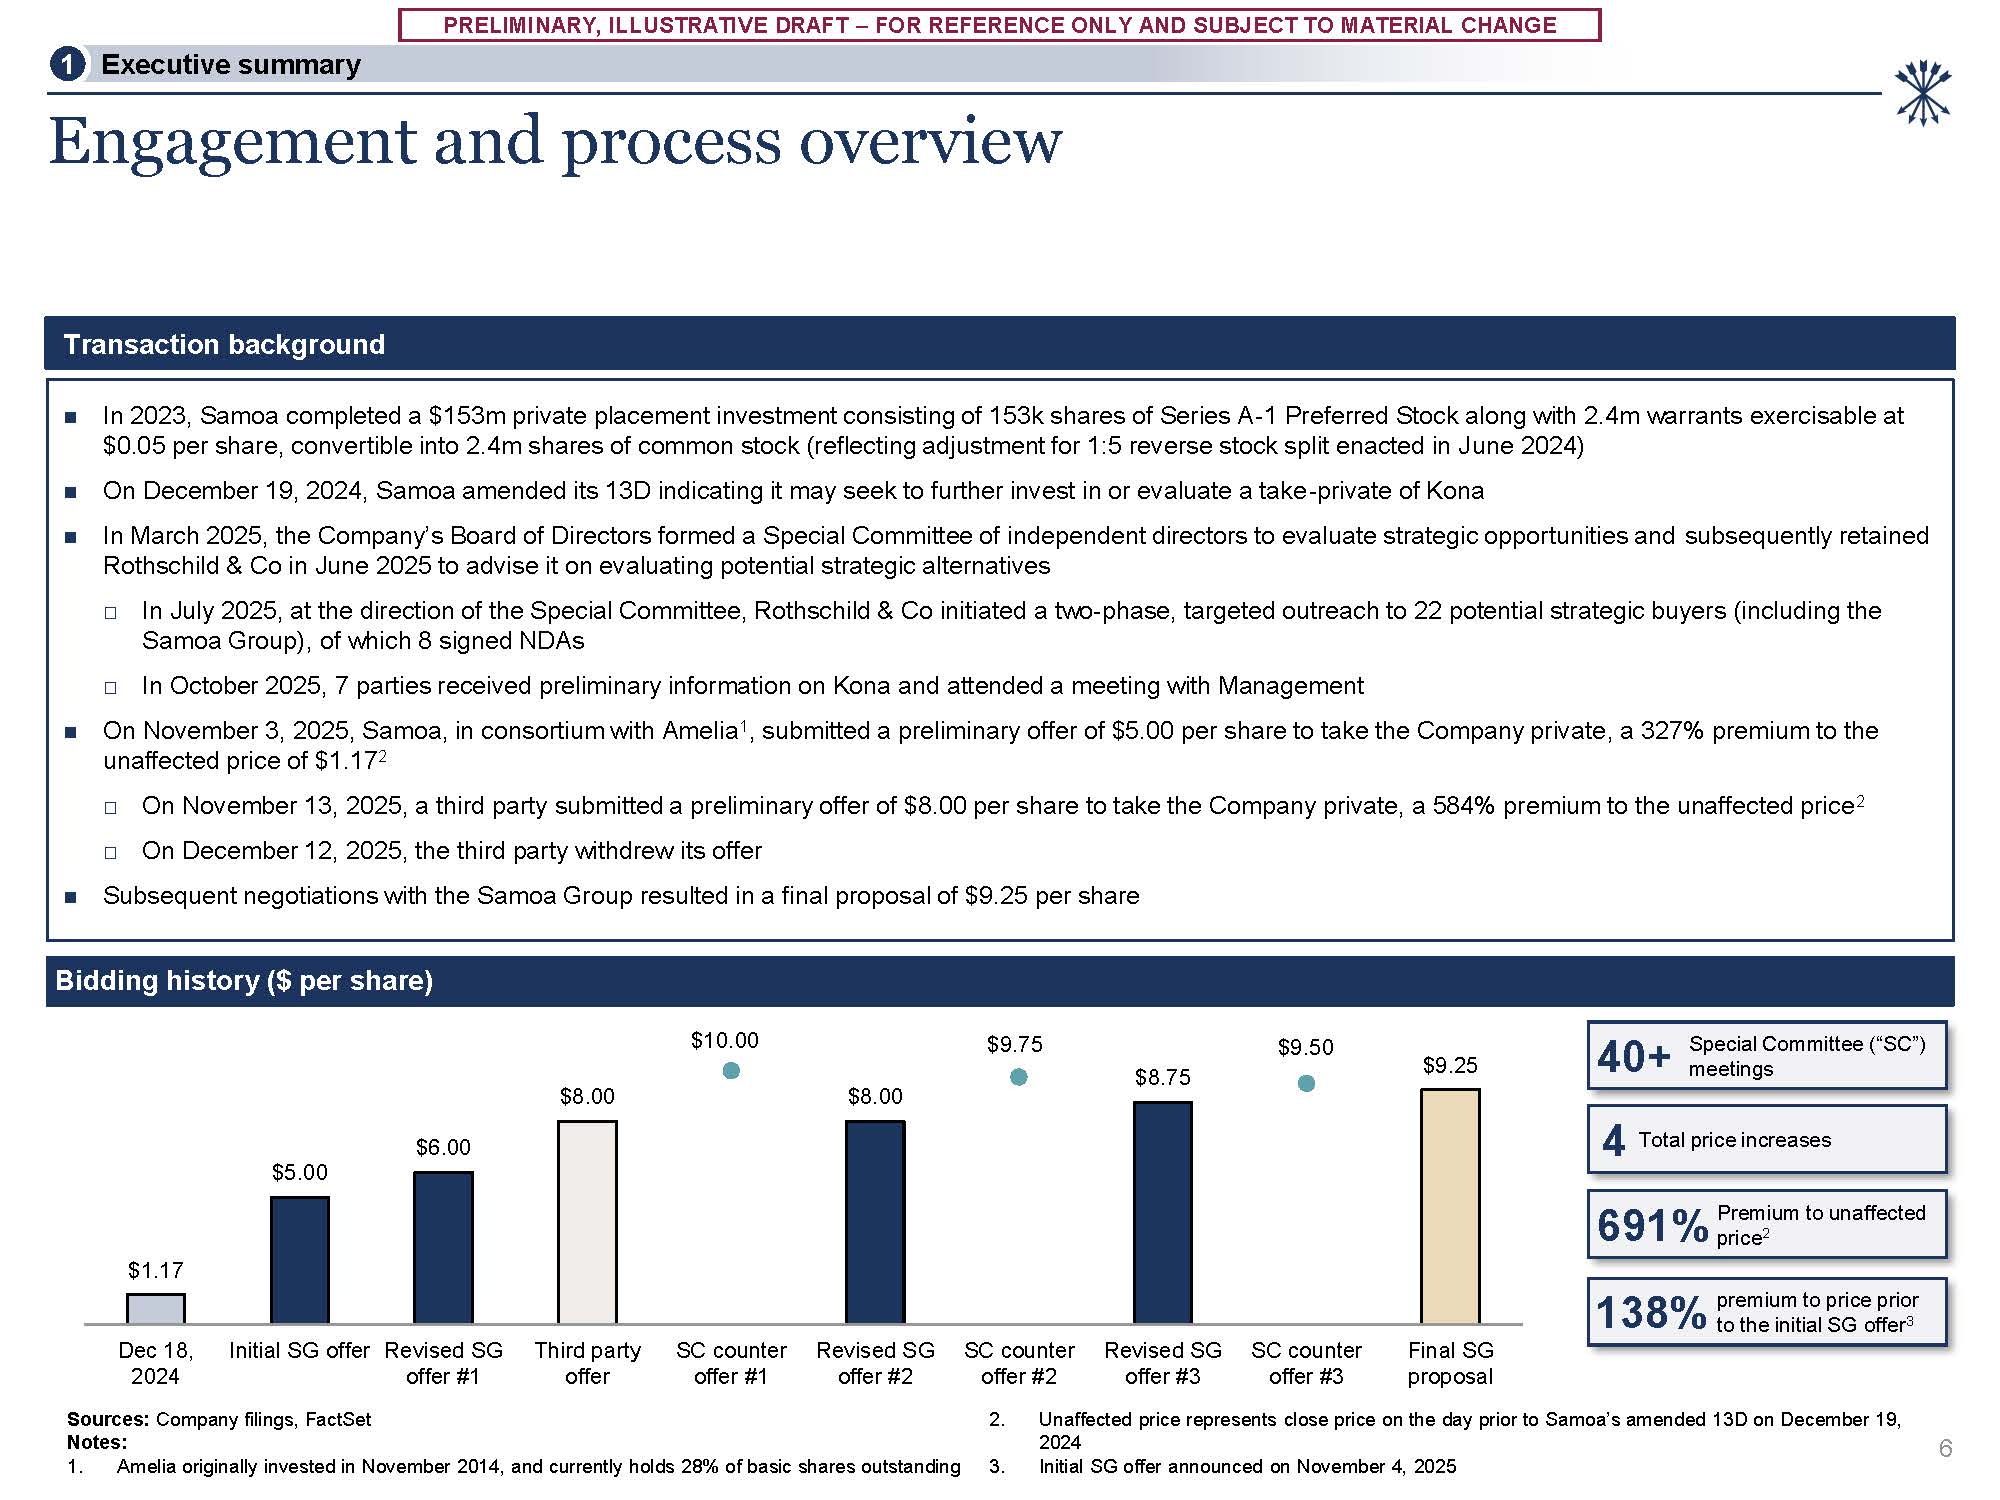
CHANGE In 2023, Samoa completed a $153m private placement investment consisting of 153k shares of Series A-1 Preferred Stock along with 2.4m warrants exercisable at $0.05 per share, convertible into 2.4m shares of common stock (reflecting
adjustment for 1:5 reverse stock split enacted in June 2024) On December 19, 2024, Samoa amended its 13D indicating it may seek to further invest in or evaluate a take-private of Kona In March 2025, the Company’s Board of Directors formed a
Special Committee of independent directors to evaluate strategic opportunities and subsequently retained Rothschild & Co in June 2025 to advise it on evaluating potential strategic alternatives In July 2025, at the direction of the Special
Committee, Rothschild & Co initiated a two-phase, targeted outreach to 22 potential strategic buyers (including the Samoa Group), of which 8 signed NDAs In October 2025, 7 parties received preliminary information on Kona and attended a
meeting with Management On November 3, 2025, Samoa, in consortium with Amelia1, submitted a preliminary offer of $5.00 per share to take the Company private, a 327% premium to the unaffected price of $1.172 On November 13, 2025, a third party
submitted a preliminary offer of $8.00 per share to take the Company private, a 584% premium to the unaffected price2 On December 12, 2025, the third party withdrew its offer Subsequent negotiations with the Samoa Group resulted in a final
proposal of $9.25 per share Engagement and process overview Transaction background Sources: Company filings, FactSet 2. Notes: 1. Amelia originally invested in November 2014, and currently holds 28% of basic shares outstanding
3. Unaffected price represents close price on the day prior to Samoa’s amended 13D on December 19, 2024 Initial SG offer announced on November 4, 2025 6 Special Committee (“SC”) meetings 40+ Bidding history ($ per share) 4 Total price
increases Premium to unaffected price2 691% 1.1SITEUxAeTcIOuNtiOvVeEsRuVmIEmWary $1.17 $5.00 $6.00 $8.00 $8.00 $8.75 $9.25 $10.00 $9.75 $9.50 Dec 18, 2024 Initial SG offer Revised SG Third party offer #1 offer SC
counter offer #1 Revised SG SC counter Revised SG offer #2 offer #2 offer #3 SC counter offer #3 Final SG proposal premium to price prior to the initial SG offer3 138%
PRELIMINARY, ILLUSTRATIVE DRAFT – FOR REFERENCE ONLY AND SUBJECT TO MATERIAL
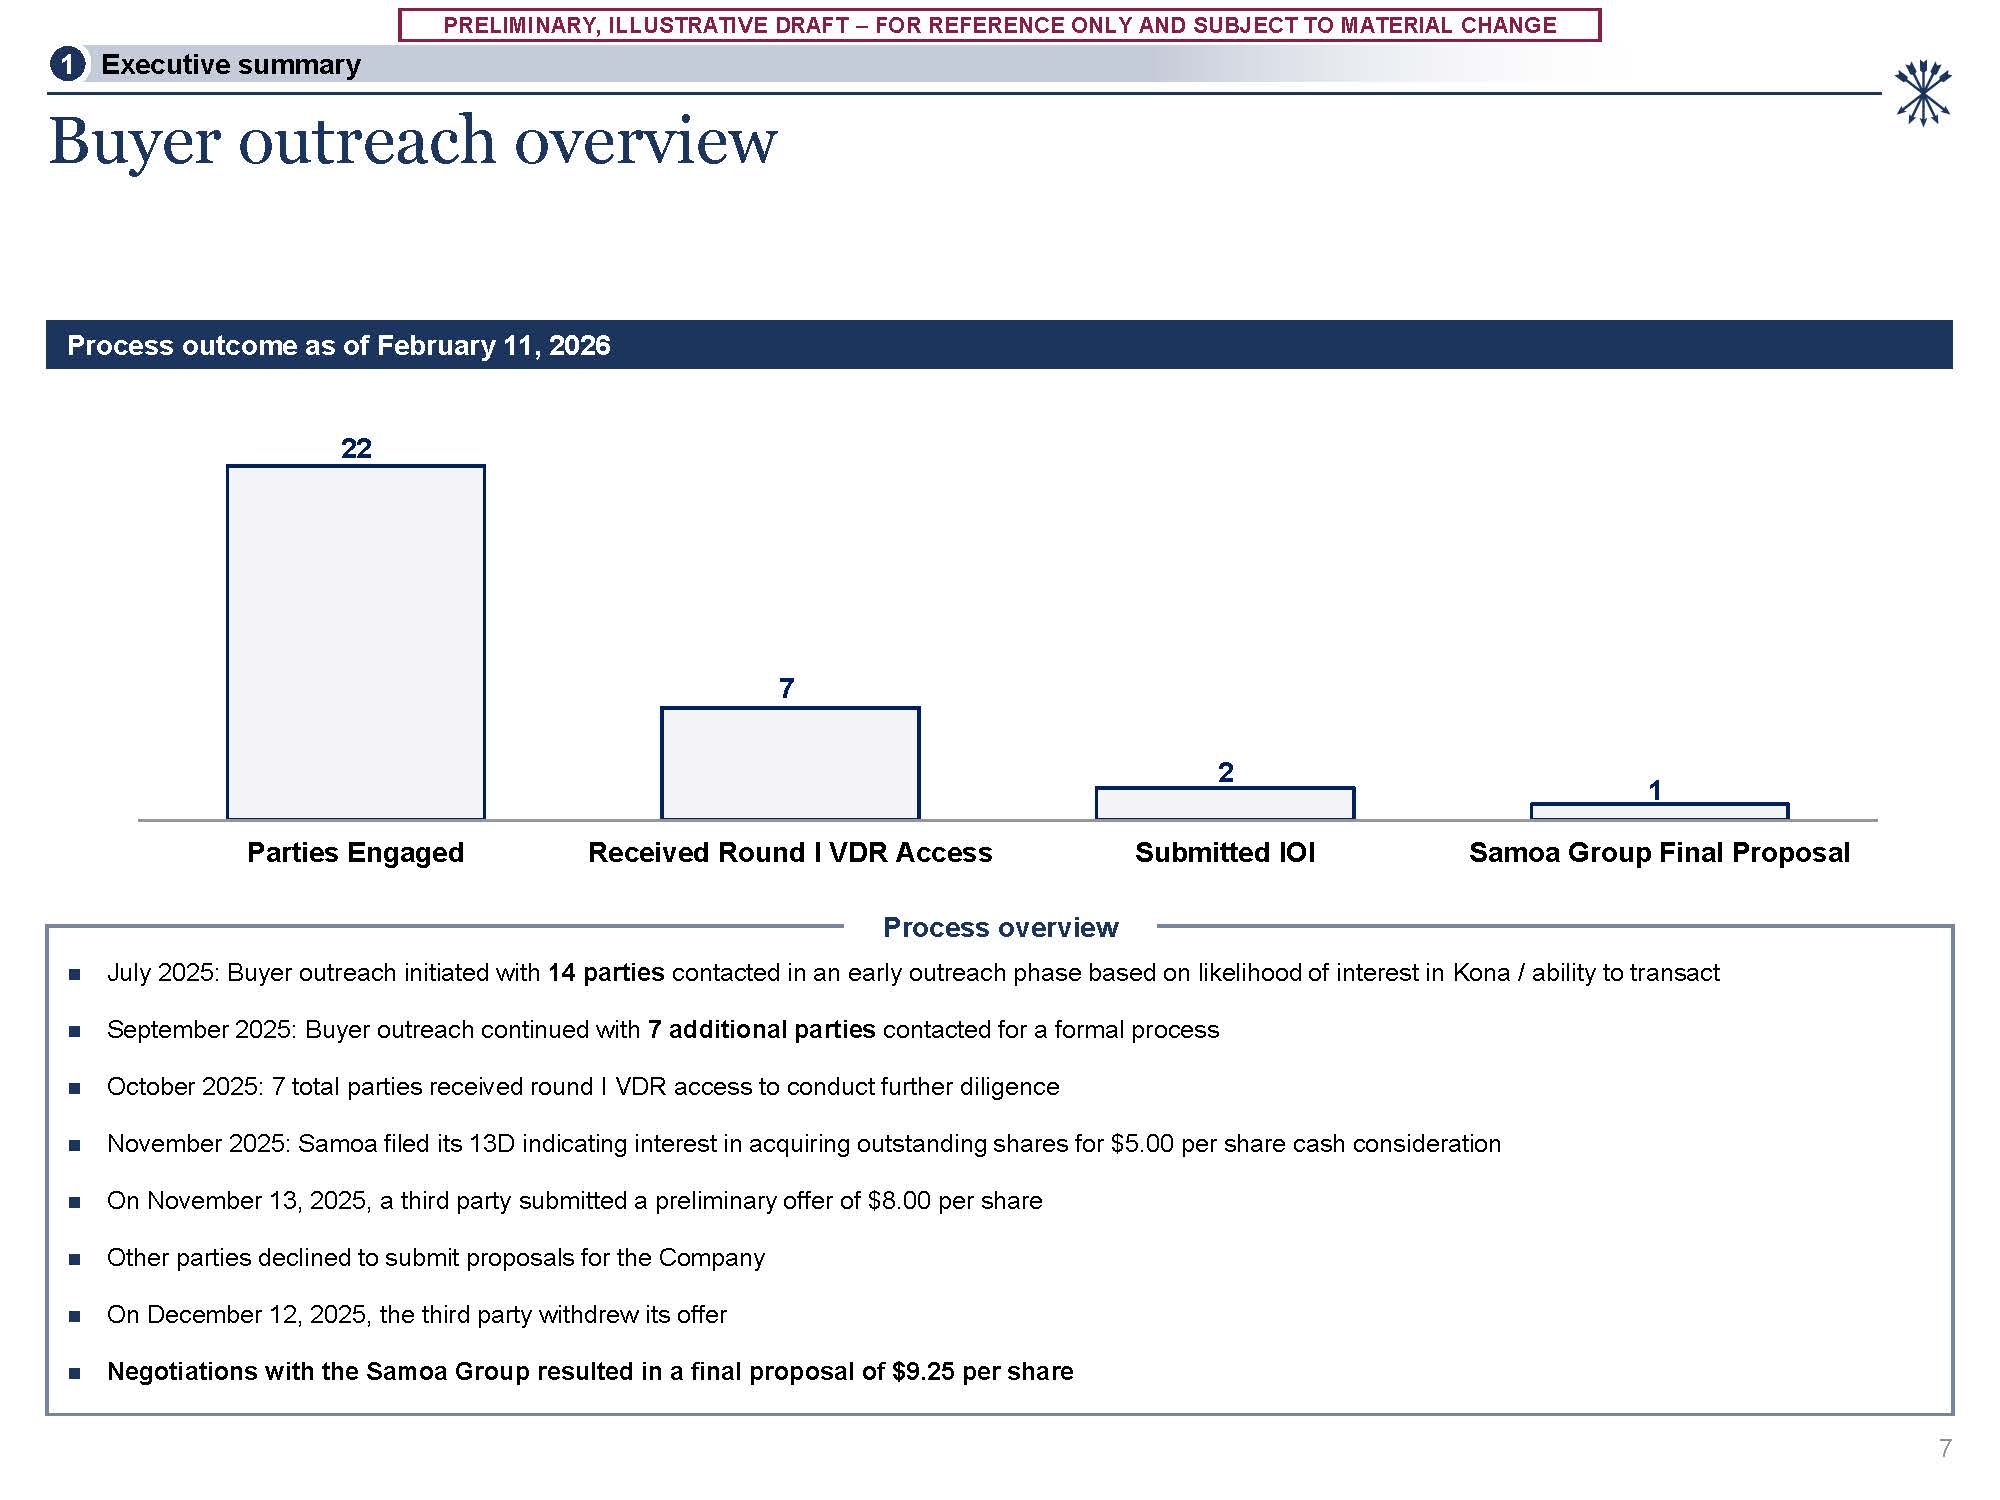
CHANGE 22 7 2 1 Parties Engaged Received Round I VDR Access Submitted IOI Samoa Group Final Proposal 1.1SITEUxAeTcIOuNtiOvVeEsRuVmIEmWary Buyer outreach overview 7 Process overview July 2025: Buyer outreach initiated with 14
parties contacted in an early outreach phase based on likelihood of interest in Kona / ability to transact September 2025: Buyer outreach continued with 7 additional parties contacted for a formal process October 2025: 7 total parties
received round I VDR access to conduct further diligence November 2025: Samoa filed its 13D indicating interest in acquiring outstanding shares for $5.00 per share cash consideration On November 13, 2025, a third party submitted a preliminary
offer of $8.00 per share Other parties declined to submit proposals for the Company On December 12, 2025, the third party withdrew its offer Negotiations with the Samoa Group resulted in a final proposal of $9.25 per share Process outcome
as of February 11, 2026
PRELIMINARY, ILLUSTRATIVE DRAFT – FOR REFERENCE ONLY AND SUBJECT TO MATERIAL
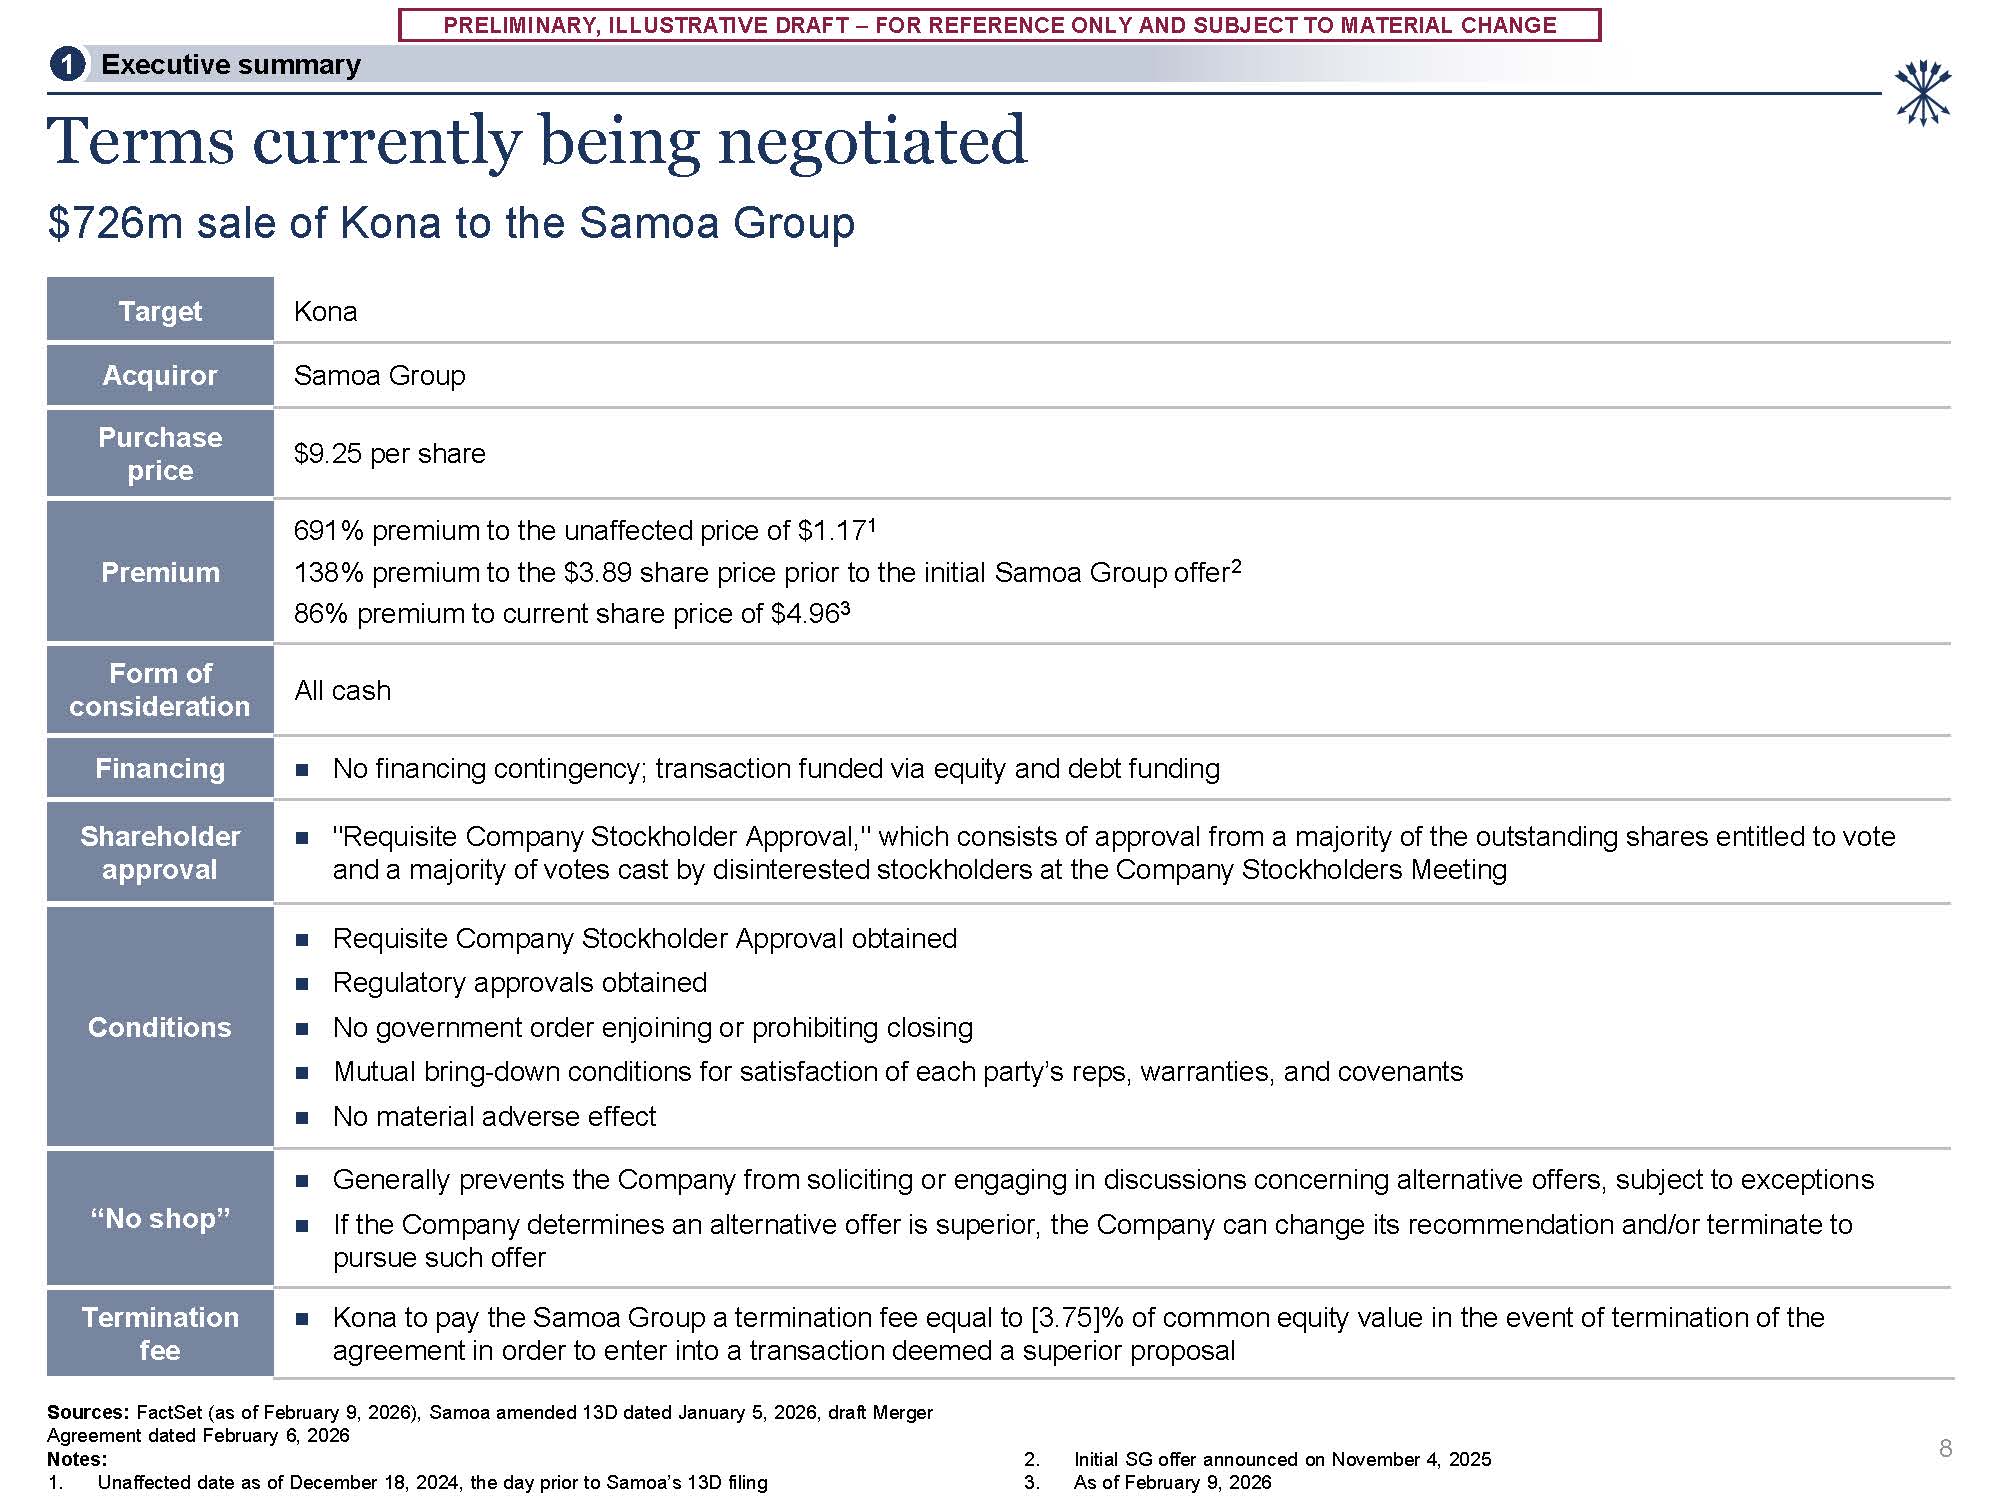
CHANGE Terms currently being negotiated $726m sale of Kona to the Samoa Group 8 Sources: FactSet (as of February 9, 2026), Samoa amended 13D dated January 5, 2026, draft Merger Agreement dated February 6, 2026 Notes: 1. Unaffected date as
of December 18, 2024, the day prior to Samoa’s 13D filing Initial SG offer announced on November 4, 2025 As of February 9, 2026 1 Executive summary Target Kona Acquiror Samoa Group Purchase price $9.25 per share Premium 691% premium
to the unaffected price of $1.171 138% premium to the $3.89 share price prior to the initial Samoa Group offer2 86% premium to current share price of $4.963 Form of consideration All cash Financing No financing contingency; transaction
funded via equity and debt funding Shareholder approval "Requisite Company Stockholder Approval," which consists of approval from a majority of the outstanding shares entitled to vote and a majority of votes cast by disinterested stockholders
at the Company Stockholders Meeting Conditions Requisite Company Stockholder Approval obtained Regulatory approvals obtained No government order enjoining or prohibiting closing Mutual bring-down conditions for satisfaction of each party’s
reps, warranties, and covenants No material adverse effect “No shop” Generally prevents the Company from soliciting or engaging in discussions concerning alternative offers, subject to exceptions If the Company determines an alternative
offer is superior, the Company can change its recommendation and/or terminate to pursue such offer Termination fee Kona to pay the Samoa Group a termination fee equal to [3.75]% of common equity value in the event of termination of the
agreement in order to enter into a transaction deemed a superior proposal
PRELIMINARY, ILLUSTRATIVE DRAFT – FOR REFERENCE ONLY AND SUBJECT TO MATERIAL
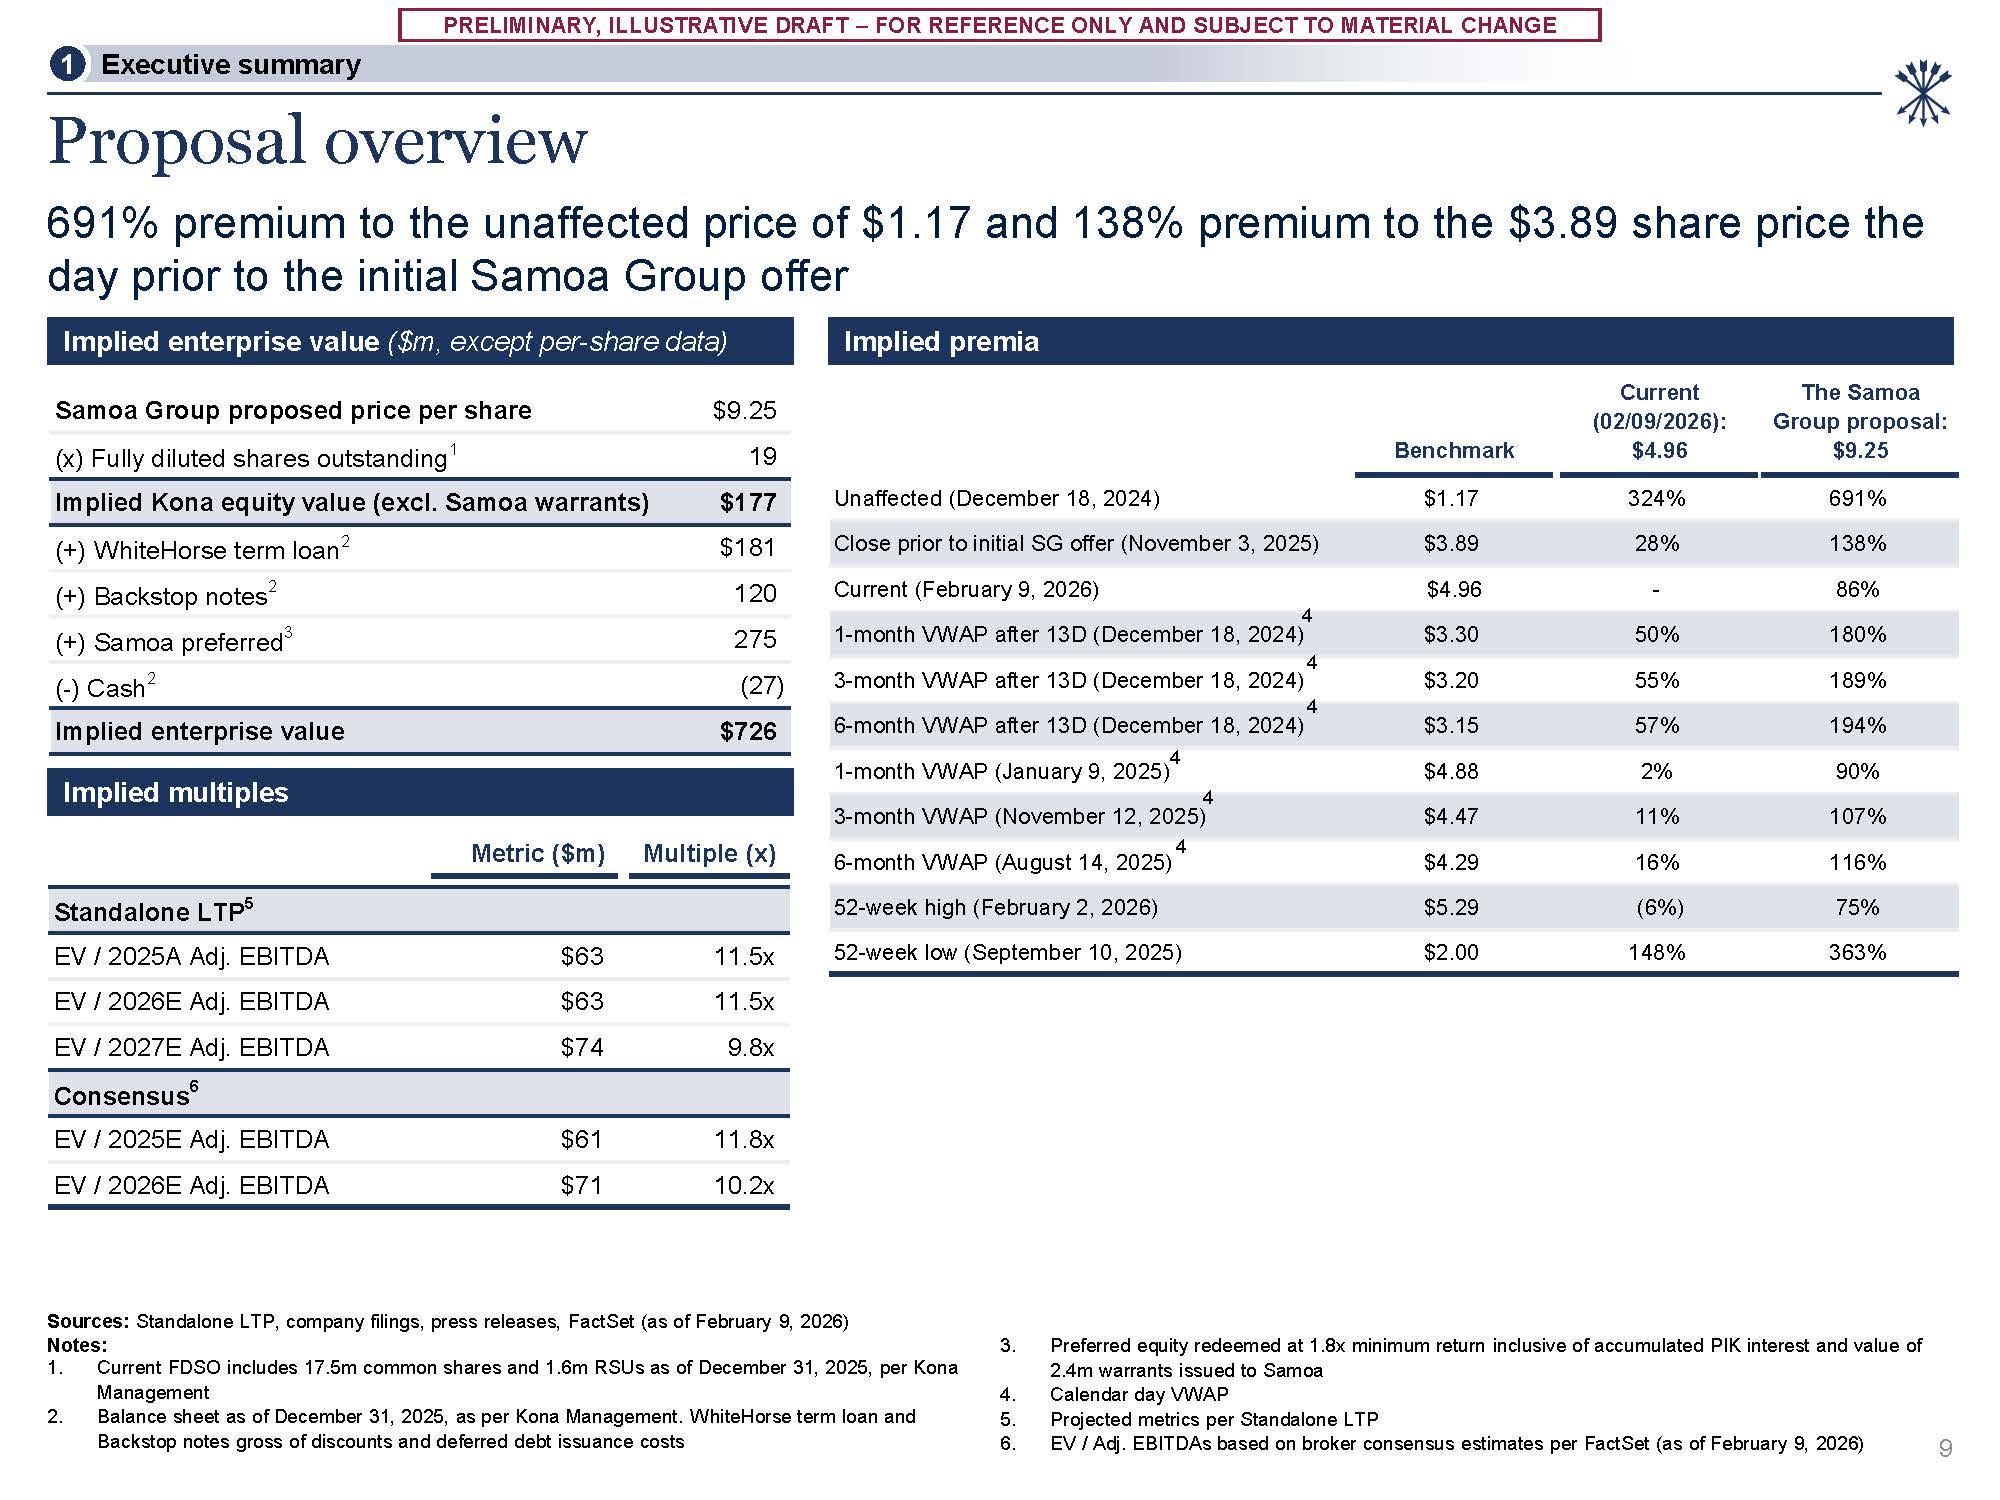
CHANGE Current The Samoa $4.88 2% 90% $4.47 11% 107% 1-month VWAP (January 9, 2025)4 4 3-month VWAP (November 12, 2025) Samoa Group proposed price per share $9.25 (02/09/2026): Group proposal: (x) Fully diluted shares outstanding1
19 Benchmark $4.96 $9.25 Implied Kona equity value (excl. Samoa warrants) $177 Unaffected (December 18, 2024) $1.17 324% 691% (+) WhiteHorse term loan2 $181 Close prior to initial SG offer (November 3, 2025) $3.89 28% 138% (+)
Backstop notes2 120 Current (February 9, 2026) $4.96 - 86% (+) Samoa preferred3 275 4 1-month VWAP after 13D (December 18, 2024) $3.30 50% 180% (-) Cash2 (27) 4 3-month VWAP after 13D (December 18,
2024) 4 $3.20 55% 189% Implied enterprise value $726 6-month VWAP after 13D (December 18, 2024) $3.15 57% 194% Metric ($m) Multiple (x) 4 6-month VWAP (August 14, 2025) $4.29 16% 116% Standalone LTP5 52-week high (February 2,
2026) $5.29 (6%) 75% EV / 2025A Adj. EBITDA $63 11.5x 52-week low (September 10, 2025) $2.00 148% 363% EV / 2026E Adj. EBITDA $63 11.5x EV / 2027E Adj. EBITDA $74 9.8x Consensus6 EV / 2025E Adj. EBITDA $61 11.8x EV / 2026E
Adj. EBITDA $71 10.2x Sources: Standalone LTP, company filings, press releases, FactSet (as of February 9, 2026) Notes: Current FDSO includes 17.5m common shares and 1.6m RSUs as of December 31, 2025, per Kona Management Balance sheet as
of December 31, 2025, as per Kona Management. WhiteHorse term loan and Backstop notes gross of discounts and deferred debt issuance costs 3. Preferred equity redeemed at 1.8x minimum return inclusive of accumulated PIK interest and value
of 2.4m warrants issued to Samoa Calendar day VWAP Projected metrics per Standalone LTP EV / Adj. EBITDAs based on broker consensus estimates per FactSet (as of February 9, 2026) Implied enterprise value ($m, except per-share
data) Implied premia 9 1 Executive summary Proposal overview 691% premium to the unaffected price of $1.17 and 138% premium to the $3.89 share price the day prior to the initial Samoa Group offer Implied multiples
PRELIMINARY, ILLUSTRATIVE DRAFT – FOR REFERENCE ONLY AND SUBJECT TO MATERIAL
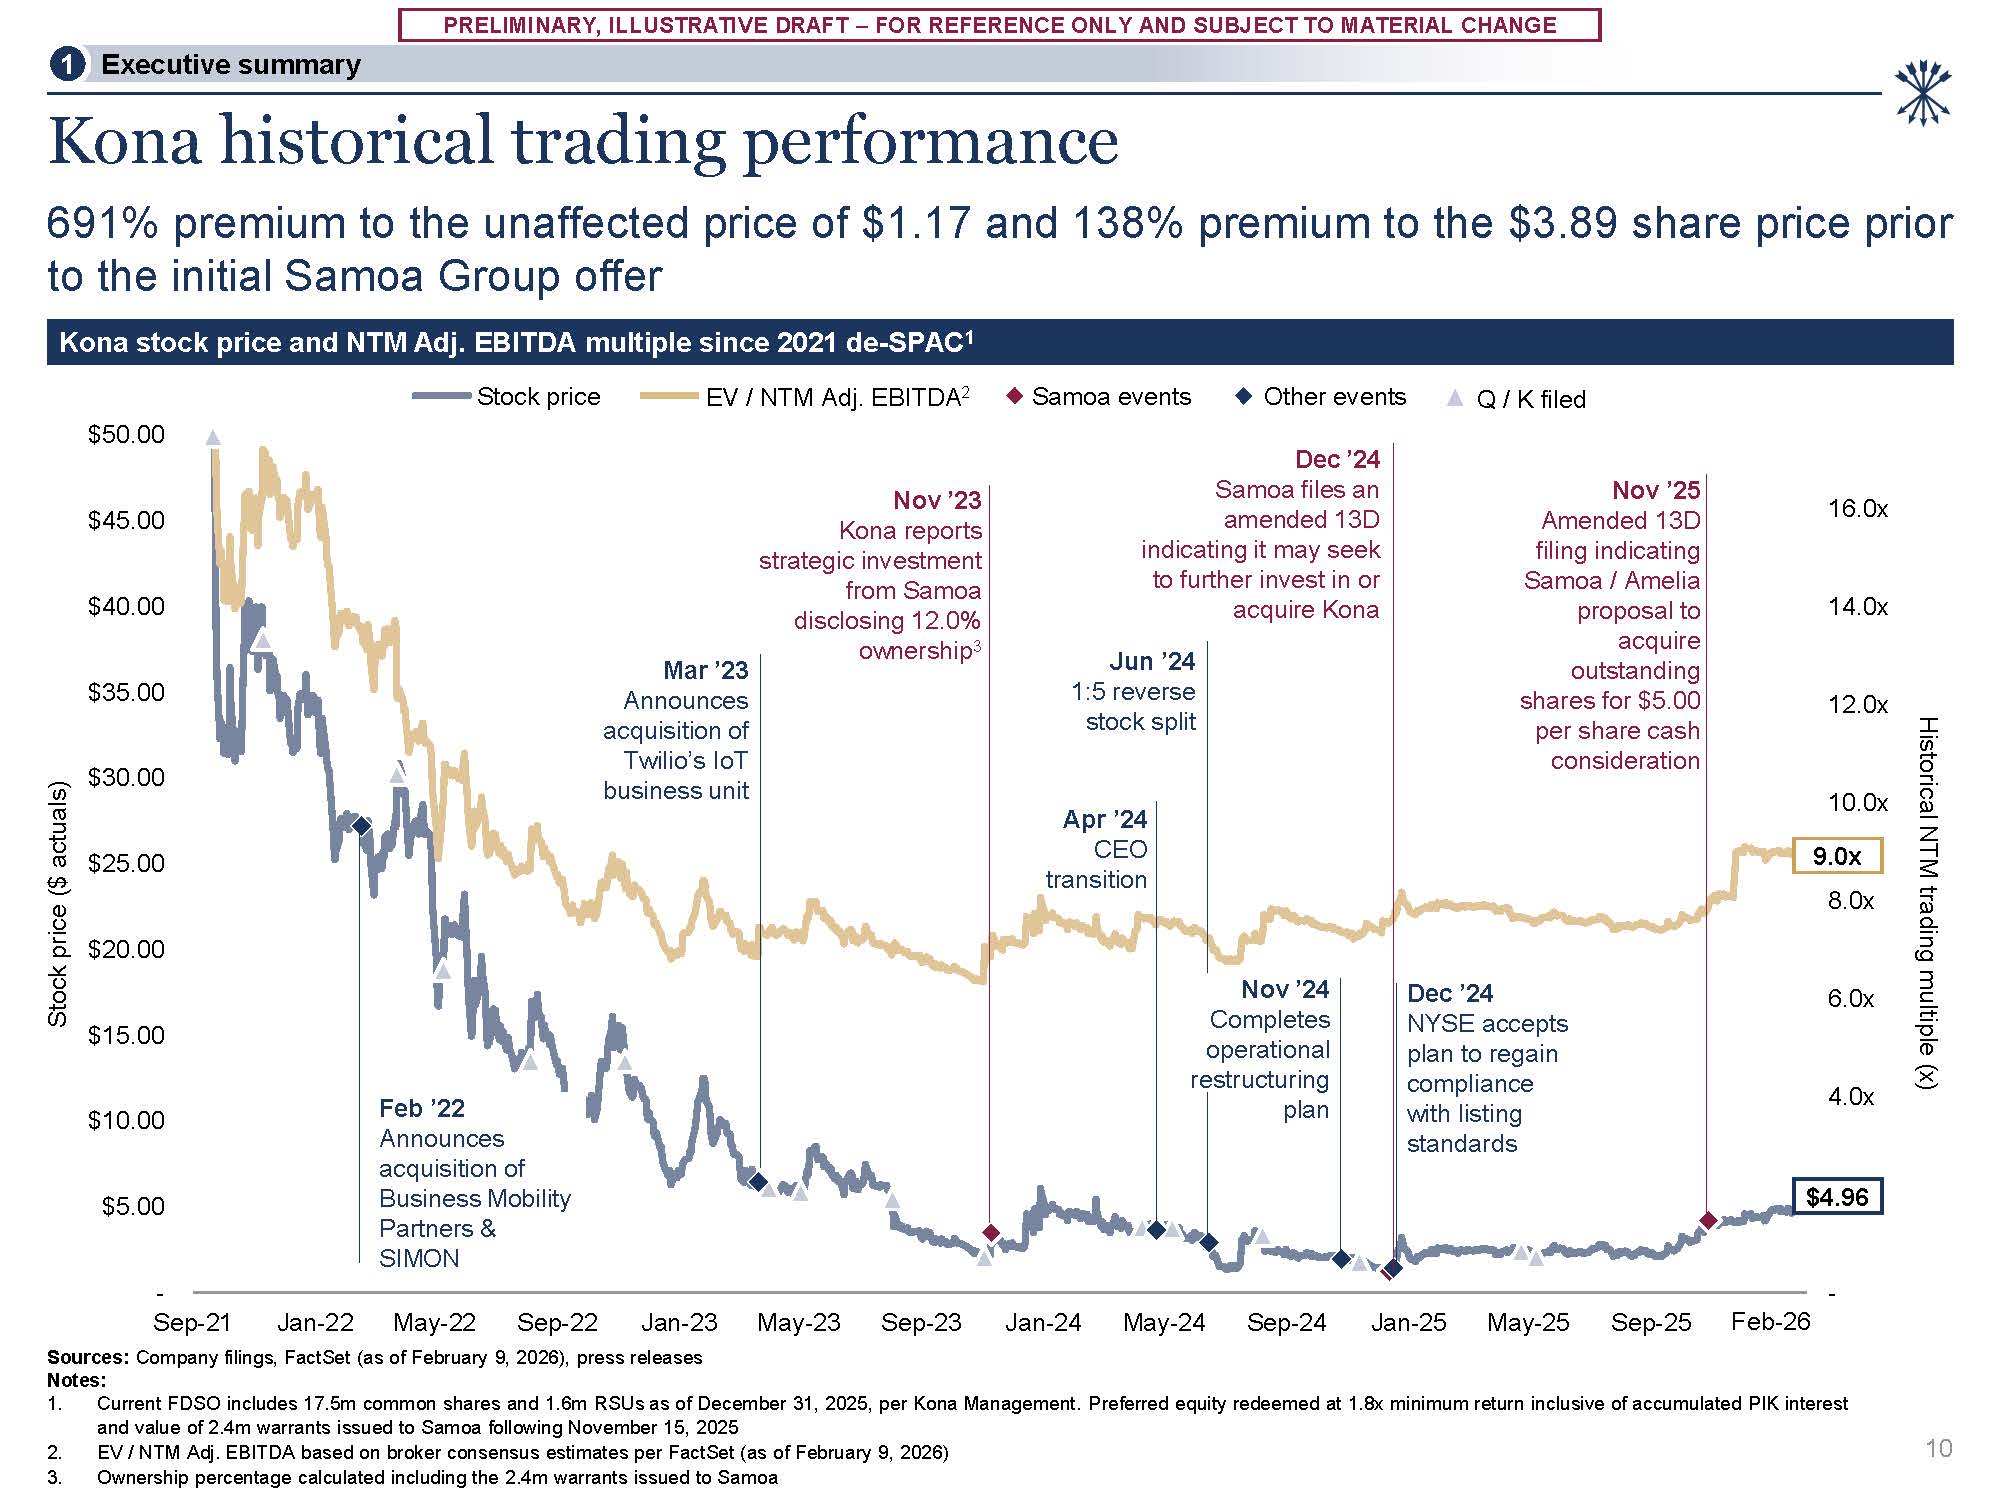
CHANGE - 2.0x 4.0x 6.0x 8.0x 10.0x 12.0x 14.0x 16.0x - Sep-21 Jan-22 May-22 Sep-22 Jan-23 May-23 Sep-23 Jan-24 May-24 Sep-24 Jan-25 May-25
Sep-25 $5.00 $10.00 $15.00 $20.00 $25.00 $30.00 $35.00 $40.00 $45.00 $50.00 Jan-26 1 Executive summary Dec ’24 Samoa files an amended 13D indicating it may seek to further invest in or acquire Kona Mar ’23 Announces acquisition
of Twilio’s IoT business unit Jun ’24 1:5 reverse stock split Nov ’24 Completes operational restructuring plan Nov ’23 Kona reports strategic investment from Samoa disclosing 12.0% ownership3 Apr ’24 CEO transition Feb ’22
Announces acquisition of Business Mobility Partners & SIMON Kona historical trading performance 691% premium to the unaffected price of $1.17 and 138% premium to the $3.89 share price prior to the initial Samoa Group offer Sources:
Company filings, FactSet (as of February 9, 2026), press releases Notes: Current FDSO includes 17.5m common shares and 1.6m RSUs as of December 31, 2025, per Kona Management. Preferred equity redeemed at 1.8x minimum return inclusive of
accumulated PIK interest and value of 2.4m warrants issued to Samoa following November 15, 2025 EV / NTM Adj. EBITDA based on broker consensus estimates per FactSet (as of February 9, 2026) Ownership percentage calculated including the 2.4m
warrants issued to Samoa Kona stock price and NTM Adj. EBITDA multiple since 2021 de-SPAC1 Stock price ($ actuals) Historical NTM trading multiple (x) Stock price EV / NTM Adj. EBITDA2 Samoa events Other events Q / K filed $4.96 9.0x Dec
’24 NYSE accepts plan to regain compliance with listing standards Nov ’25 Amended 13D filing indicating Samoa / Amelia proposal to acquire outstanding shares for $5.00 per share cash consideration 10 Feb-26
PRELIMINARY, ILLUSTRATIVE DRAFT – FOR REFERENCE ONLY AND SUBJECT TO MATERIAL
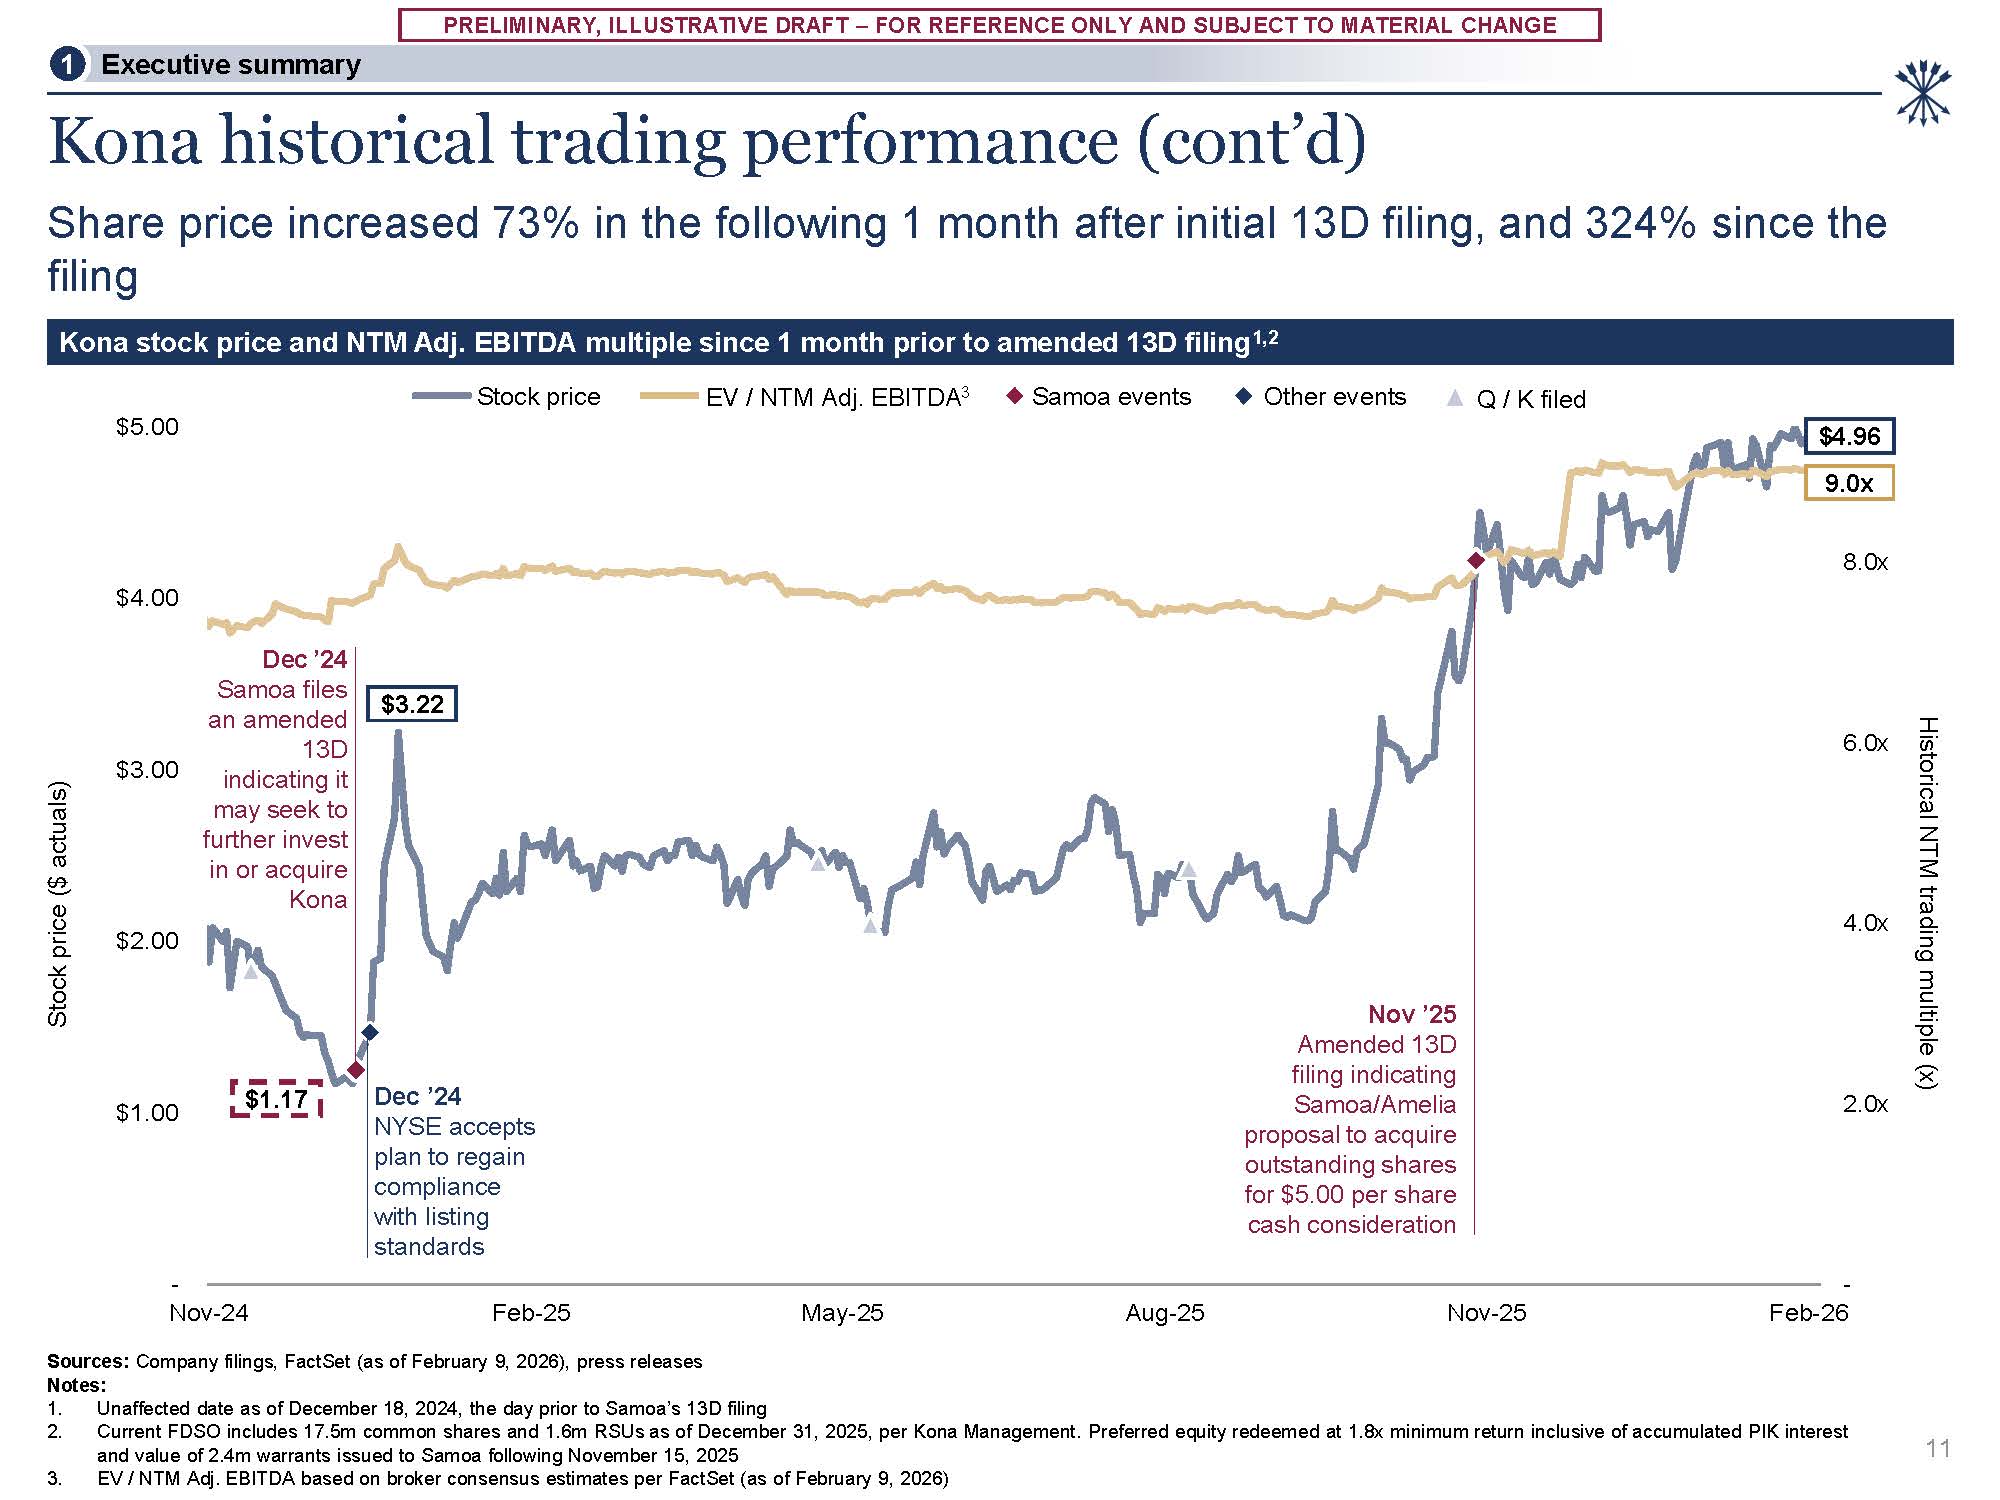
CHANGE - 2.0x 4.0x 6.0x 8.0x - Nov-24 Feb-25 Sources: Company filings, FactSet (as of February 9, 2026), press releases Notes: $1.00 $2.00 $3.00 $4.00 $5.00 May-25 Aug-25 Nov-25 Feb-26 Kona historical trading performance
(cont’d) Share price increased 73% in the following 1 month after initial 13D filing, and 324% since the filing Kona stock price and NTM Adj. EBITDA multiple since 1 month prior to amended 13D filing1,2 9.0x $1.17 $4.96 $3.22 Dec ’24
Samoa files an amended 13D indicating it may seek to further invest in or acquire Kona Historical NTM trading multiple (x) Dec ’24 NYSE accepts plan to regain compliance with listing standards Unaffected date as of December 18, 2024, the
day prior to Samoa’s 13D filing Current FDSO includes 17.5m common shares and 1.6m RSUs as of December 31, 2025, per Kona Management. Preferred equity redeemed at 1.8x minimum return inclusive of accumulated PIK interest and value of 2.4m
warrants issued to Samoa following November 15, 2025 EV / NTM Adj. EBITDA based on broker consensus estimates per FactSet (as of February 9, 2026) Nov ’25 Amended 13D filing indicating Samoa/Amelia proposal to acquire outstanding shares for
$5.00 per share cash consideration 11 1 Executive summary Stock price ($ actuals) Stock price EV / NTM Adj. EBITDA3 Samoa events Other events Q / K filed
2 Overview of Standalone LTP
PRELIMINARY, ILLUSTRATIVE DRAFT – FOR REFERENCE ONLY AND SUBJECT TO MATERIAL
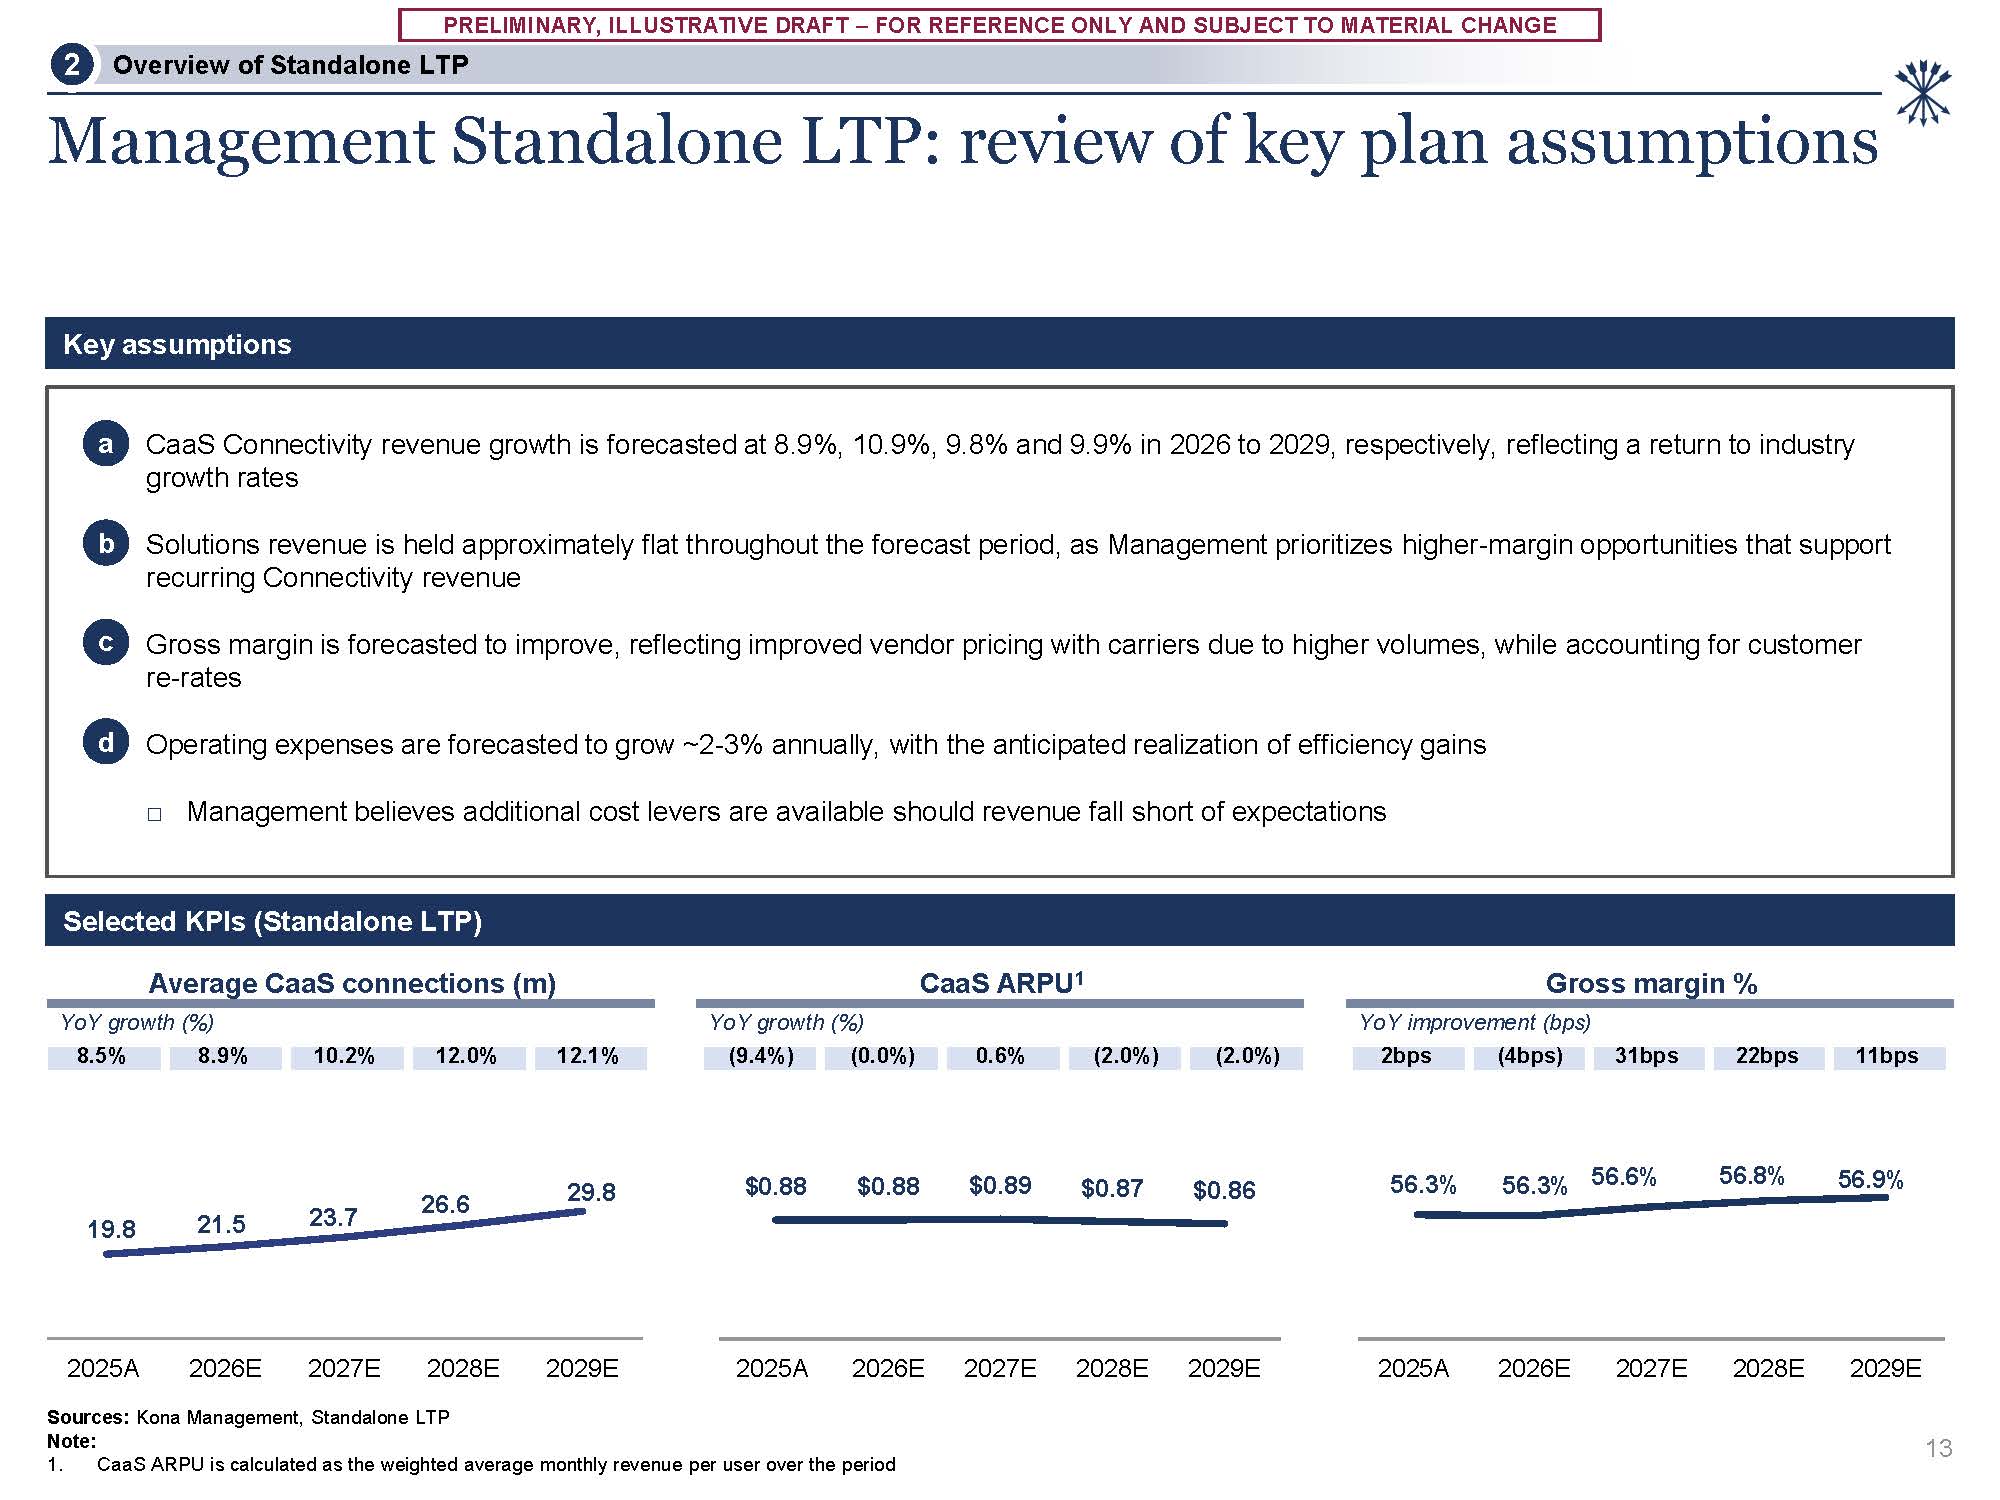
CHANGE 8.5% 8.9% 10.2% 12.0% 12.1% 19.8 21.5 23.7 26.6 29.8 2025A 2026E 2027E 2028E Sources: Kona Management, Standalone LTP Note: 2029E 2bps (4bps) 31bps 22bps 11bps 56.3% 56.3%
56.6% 56.8% 56.9% 2025A 2026E 2027E 2028E 2029E (9.4%) (0.0%) 0.6% (2.0%) (2.0%) $0.88 $0.88 $0.89 $0.87 $0.86 2025A 2026E 2027E 2028E 2029E Management Standalone LTP: review of key plan assumptions 1. CaaS ARPU is
calculated as the weighted average monthly revenue per user over the period Selected KPIs (Standalone LTP) Key assumptions a CaaS Connectivity revenue growth is forecasted at 8.9%, 10.9%, 9.8% and 9.9% in 2026 to 2029, respectively,
reflecting a return to industry growth rates b Solutions revenue is held approximately flat throughout the forecast period, as Management prioritizes higher-margin opportunities that support recurring Connectivity revenue c Gross margin is
forecasted to improve, reflecting improved vendor pricing with carriers due to higher volumes, while accounting for customer re-rates d Operating expenses are forecasted to grow ~2-3% annually, with the anticipated realization of efficiency
gains Management believes additional cost levers are available should revenue fall short of expectations Average CaaS connections (m) CaaS ARPU1 Gross margin % YoY growth (%) YoY growth (%) YoY improvement (bps) Overview of Standalone
LTP 2 13
PRELIMINARY, ILLUSTRATIVE DRAFT – FOR REFERENCE ONLY AND SUBJECT TO MATERIAL
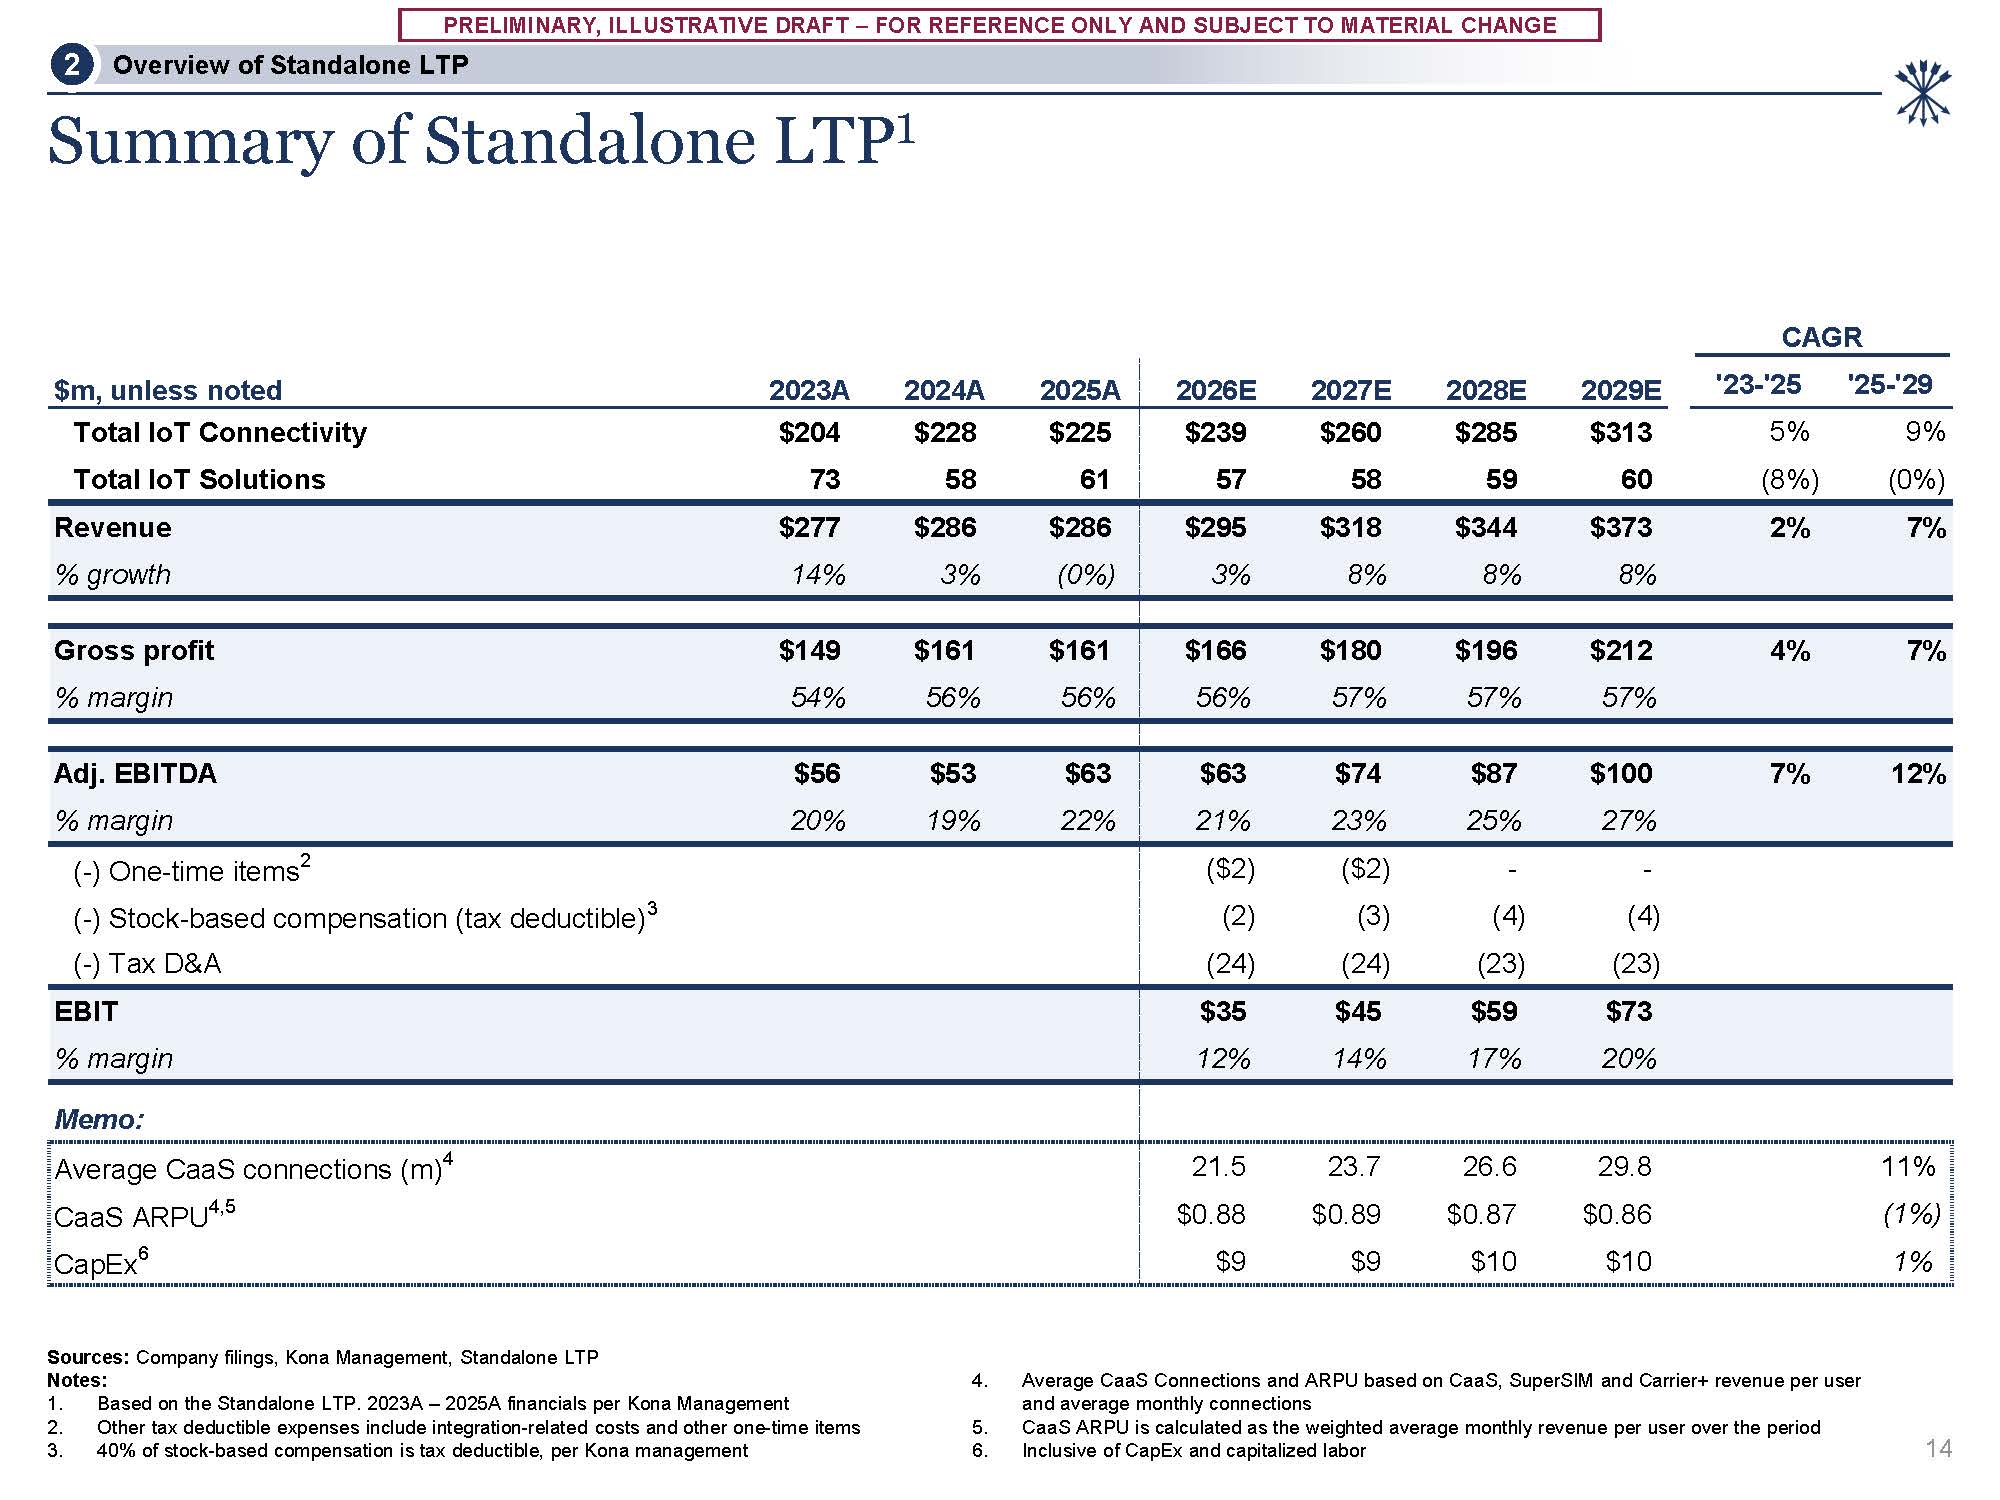
CHANGE Summary of Standalone LTP1 Sources: Company filings, Kona Management, Standalone LTP Notes: Based on the Standalone LTP. 2023A – 2025A financials per Kona Management Other tax deductible expenses include integration-related costs
and other one-time items 40% of stock-based compensation is tax deductible, per Kona management Average CaaS Connections and ARPU based on CaaS, SuperSIM and Carrier+ revenue per user and average monthly connections CaaS ARPU is calculated
as the weighted average monthly revenue per user over the period Inclusive of CapEx and capitalized labor 14 Overview of Standalone LTP 2 CAGR $m, unless noted 2023A 2024A 2025A 2026E 2027E 2028E 2029E '23-'25 '25-'29 Total IoT
Connectivity $204 $228 $225 Total IoT Solutions 73 58 61 $239 $260 $285 $313 57 58 59 60 5% 9% (8%) (0%) Revenue $277 $286 $286 % growth 14% 3% (0%) $295 $318 $344 $373 2% 7% 3% 8% 8% 8% Gross profit $149 $161 $161 % margin 54% 56%
56% $166 $180 $196 $212 4% 7% 56% 57% 57% 57% Adj. EBITDA $56 $53 $63 % margin 20% 19% 22% $63 $74 $87 $100 7% 12% 21% 23% 25% 27% (-) One-time items2 (-) Stock-based compensation (tax deductible)3 (-) Tax D&A ($2) ($2) - - (2)
(3) (4) (4) (24) (24) (23) (23) EBIT % margin $35 $45 $59 $73 12% 14% 17% 20% Memo: Average CaaS connections (m)4 CaaS ARPU4,5 CapEx6 21.5 23.7 26.6 29.8 11% $0.88 $0.89 $0.87 $0.86 (1%) $9 $9 $10 $10 1%
3 Preliminary valuation perspectives
PRELIMINARY, ILLUSTRATIVE DRAFT – FOR REFERENCE ONLY AND SUBJECT TO MATERIAL
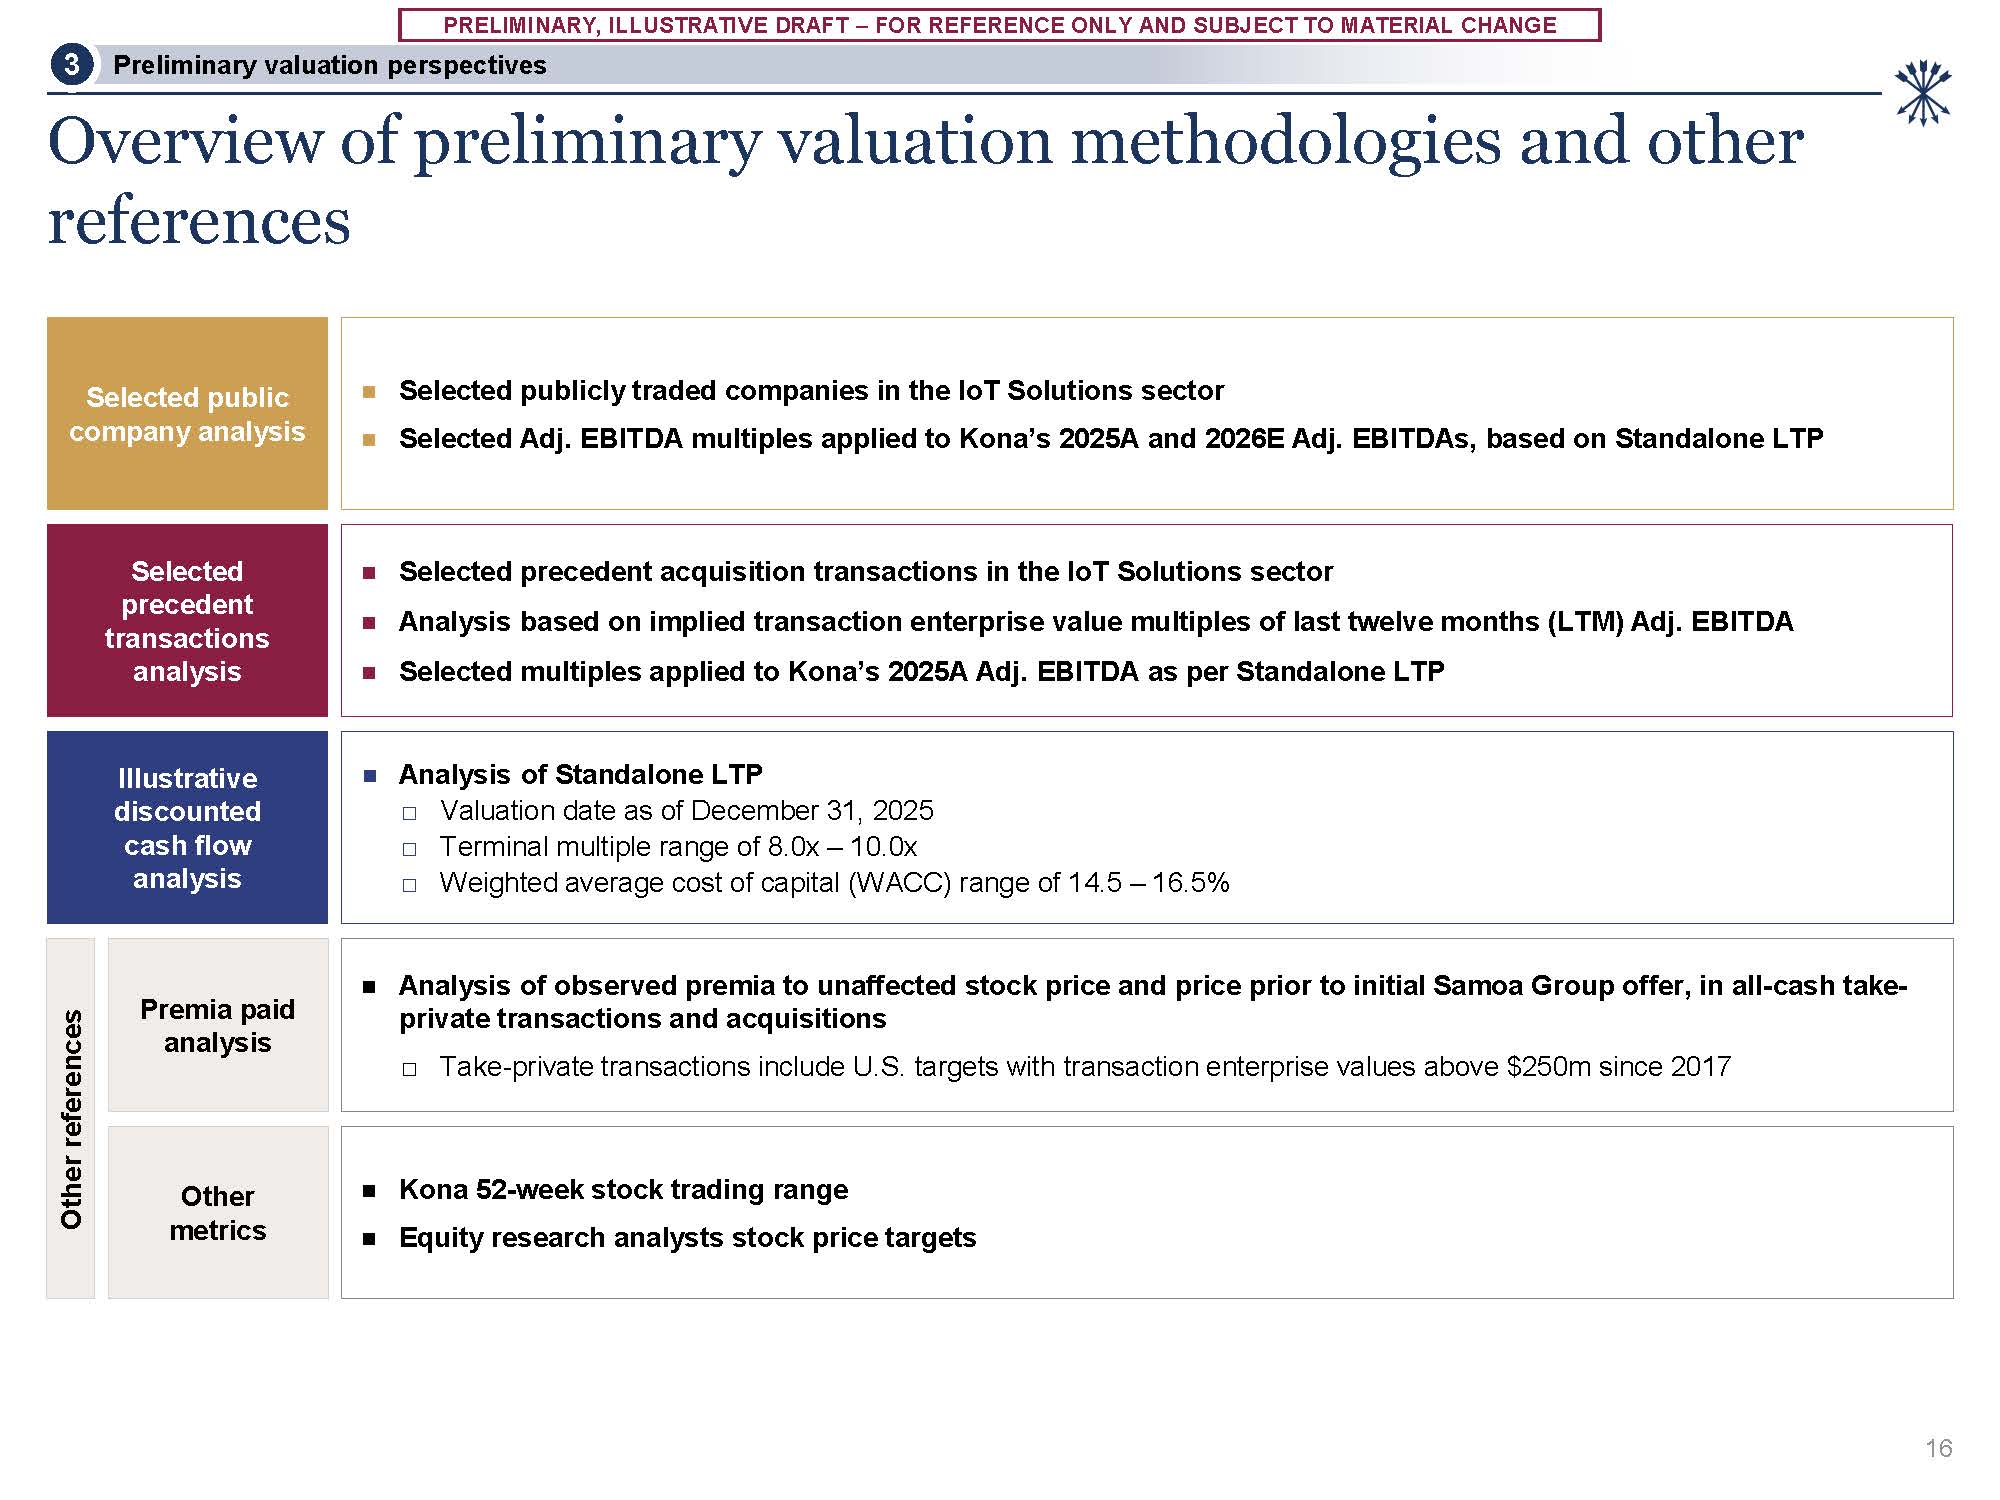
CHANGE Overview of preliminary valuation methodologies and other references Selected public company analysis Selected publicly traded companies in the IoT Solutions sector Selected Adj. EBITDA multiples applied to Kona’s 2025A and 2026E
Adj. EBITDAs, based on Standalone LTP Selected precedent acquisition transactions in the IoT Solutions sector Analysis based on implied transaction enterprise value multiples of last twelve months (LTM) Adj. EBITDA Selected multiples applied
to Kona’s 2025A Adj. EBITDA as per Standalone LTP Selected precedent transactions analysis Analysis of Standalone LTP Valuation date as of December 31, 2025 Terminal multiple range of 8.0x – 10.0x Weighted average cost of capital (WACC)
range of 14.5 – 16.5% Illustrative discounted cash flow analysis Other references Premia paid analysis Analysis of observed premia to unaffected stock price and price prior to initial Samoa Group offer, in all-cash take- private
transactions and acquisitions □ Take-private transactions include U.S. targets with transaction enterprise values above $250m since 2017 Other metrics Kona 52-week stock trading range Equity research analysts stock price
targets 16 Preliminary valuation perspectives 3
PRELIMINARY, ILLUSTRATIVE DRAFT – FOR REFERENCE ONLY AND SUBJECT TO MATERIAL
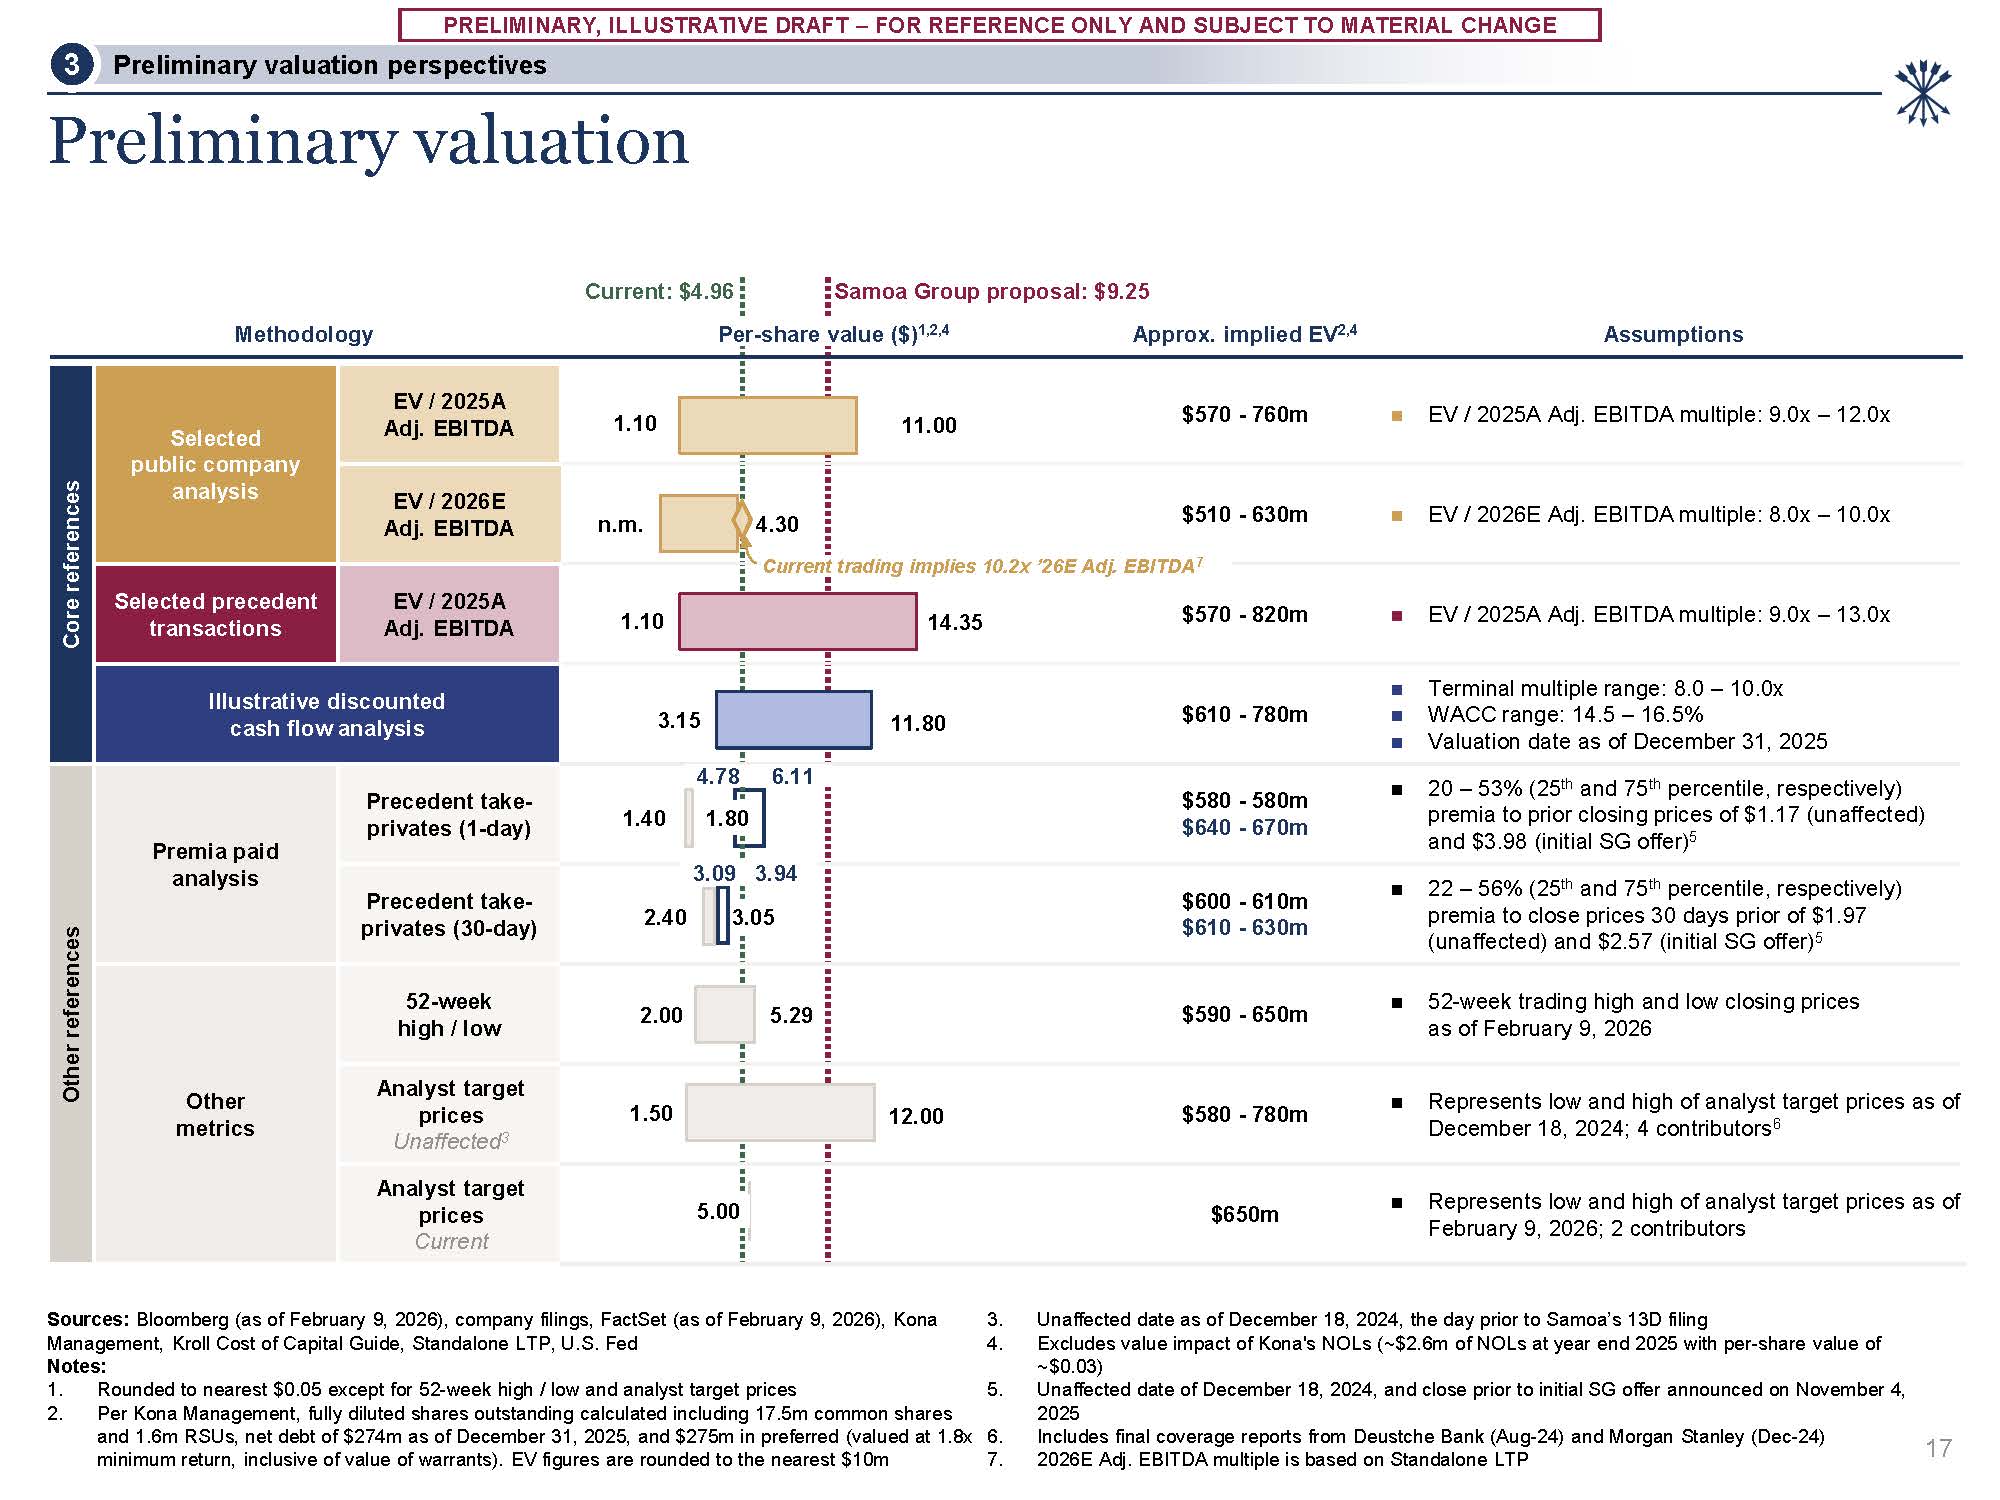
CHANGE Methodology Current: $4.96 Samoa Group proposal: $9.25 Per-share value ($)1,2,4 Approx. implied EV2,4 Assumptions Core references Selected public company analysis EV / 2025A Adj. EBITDA $570 - 760m EV / 2025A Adj. EBITDA
multiple: 9.0x – 12.0x EV / 2026E Adj. EBITDA $510 - 630m EV / 2026E Adj. EBITDA multiple: 8.0x – 10.0x Selected precedent transactions EV / 2025A Adj. EBITDA $570 - 820m EV / 2025A Adj. EBITDA multiple: 9.0x – 13.0x Illustrative
discounted cash flow analysis $610 - 780m Terminal multiple range: 8.0 – 10.0x WACC range: 14.5 – 16.5% Valuation date as of December 31, 2025 Other references Premia paid analysis Precedent take- privates (1-day) $580 - 580m $640 -
670m 20 – 53% (25th and 75th percentile, respectively) premia to prior closing prices of $1.17 (unaffected) and $3.98 (initial SG offer)5 Precedent take-privates (30-day) $600 - 610m $610 - 630m 22 – 56% (25th and 75th percentile,
respectively) premia to close prices 30 days prior of $1.97 (unaffected) and $2.57 (initial SG offer)5 Other metrics 52-week high / low $590 - 650m 52-week trading high and low closing prices as of February 9, 2026 Analyst target prices
Unaffected3 $580 - 780m Represents low and high of analyst target prices as of December 18, 2024; 4 contributors6 Analyst target prices Current $650m Represents low and high of analyst target prices as of February 9, 2026; 2
contributors 1.10 n.m. 1.10 3.15 2.00 1.50 5.00 11.00 4.30 14.35 11.80 1.40 1.80 2.40 3.05 5.29 12.00 Preliminary valuation Preliminary valuation perspectives 3 Sources: Bloomberg (as of February 9, 2026), company filings,
FactSet (as of February 9, 2026), Kona Management, Kroll Cost of Capital Guide, Standalone LTP, U.S. Fed Notes: Rounded to nearest $0.05 except for 52-week high / low and analyst target prices 5. Per Kona Management, fully diluted shares
outstanding calculated including 17.5m common shares and 1.6m RSUs, net debt of $274m as of December 31, 2025, and $275m in preferred (valued at 1.8x 6. minimum return, inclusive of value of warrants). EV figures are rounded to the nearest
$10m 7. Unaffected date as of December 18, 2024, the day prior to Samoa’s 13D filing Excludes value impact of Kona's NOLs (~$2.6m of NOLs at year end 2025 with per-share value of ~$0.03) Unaffected date of December 18, 2024, and close prior
to initial SG offer announced on November 4, 2025 Includes final coverage reports from Deustche Bank (Aug-24) and Morgan Stanley (Dec-24) 2026E Adj. EBITDA multiple is based on Standalone LTP 17 4.78 6.11 3.09 3.94 Current trading implies
10.2x ’26E Adj. EBITDA7
PRELIMINARY, ILLUSTRATIVE DRAFT – FOR REFERENCE ONLY AND SUBJECT TO MATERIAL
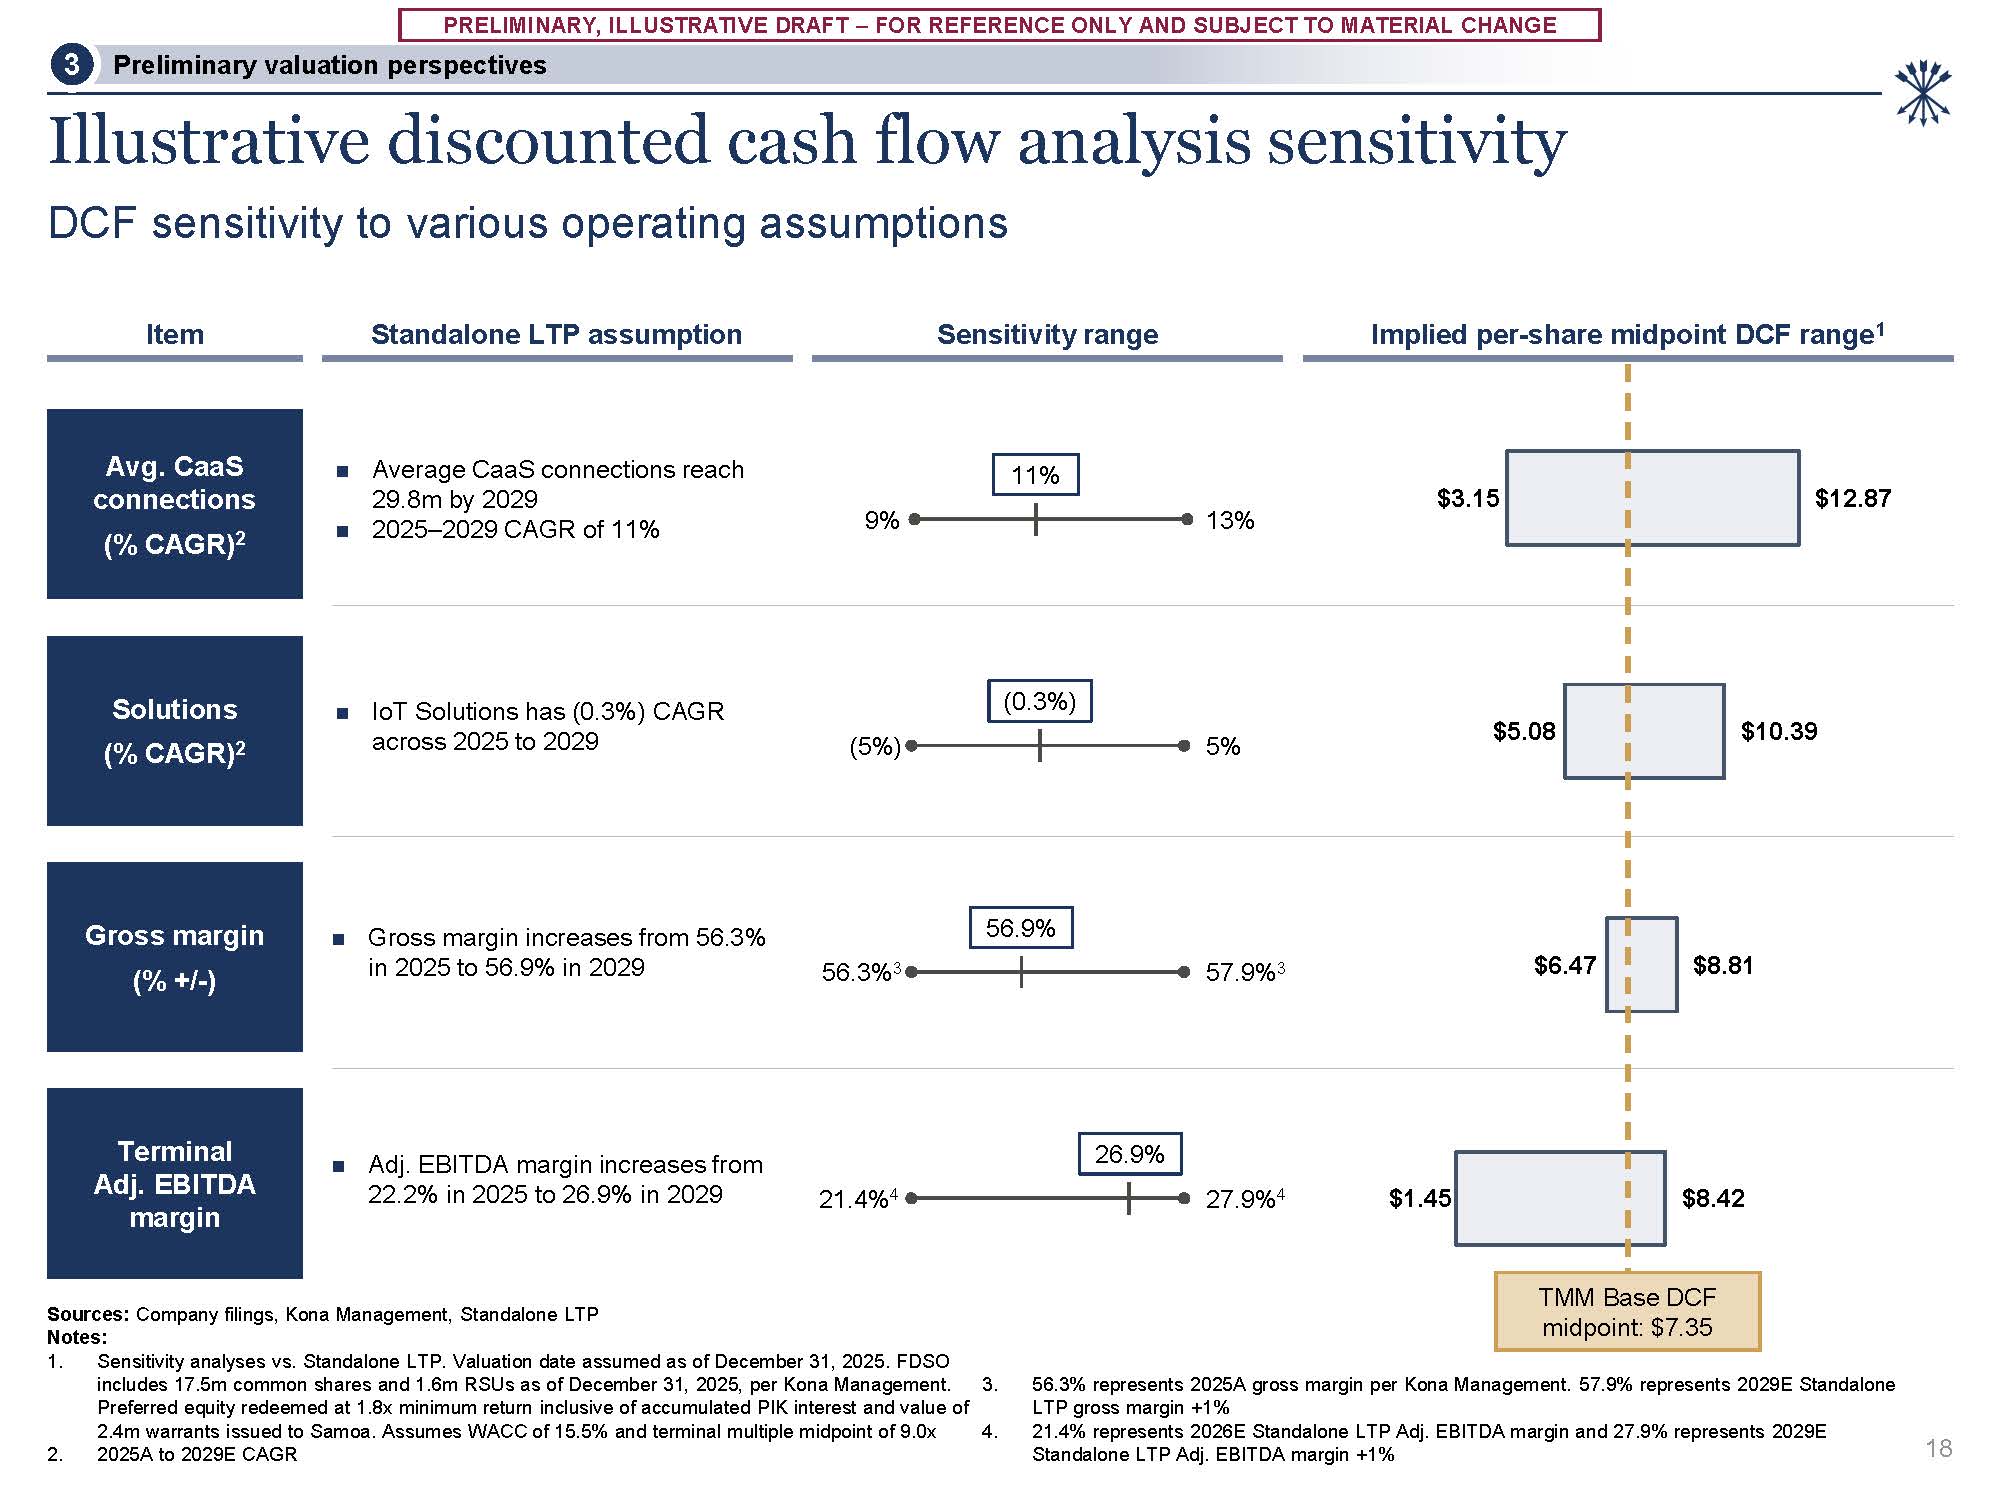
CHANGE Illustrative discounted cash flow analysis sensitivity DCF sensitivity to various operating assumptions Implied per-share midpoint DCF range1 Standalone LTP assumption Item Sources: Company filings, Kona Management, Standalone
LTP Notes: 1. Sensitivity analyses vs. Standalone LTP. Valuation date assumed as of December 31, 2025. FDSO includes 17.5m common shares and 1.6m RSUs as of December 31, 2025, per Kona Management. Preferred equity redeemed at 1.8x minimum
return inclusive of accumulated PIK interest and value of 2.4m warrants issued to Samoa. Assumes WACC of 15.5% and terminal multiple midpoint of 9.0x 2. 2025A to 2029E CAGR 56.3% represents 2025A gross margin per Kona Management. 57.9%
represents 2029E Standalone LTP gross margin +1% 21.4% represents 2026E Standalone LTP Adj. EBITDA margin and 27.9% represents 2029E Standalone LTP Adj. EBITDA margin +1% Sensitivity range Avg. CaaS connections (% CAGR)2 Average CaaS
connections reach 29.8m by 2029 2025–2029 CAGR of 11% 9% 13% 11% Solutions (% CAGR)2 IoT Solutions has (0.3%) CAGR across 2025 to 2029 (5%) 5% (0.3%) Gross margin (% +/-) Gross margin increases from 56.3% in 2025 to 56.9% in
2029 56.3%3 57.9%3 56.9% Adj. EBITDA margin increases from 22.2% in 2025 to 26.9% in 2029 Terminal Adj. EBITDA margin 21.4%4 27.9%4 26.9% 18 Preliminary valuation
perspectives 3 $3.15 $5.08 $6.47 $1.45 $12.87 $10.39 $8.81 $8.42 TMM Base DCF midpoint: $7.35
4 Appendix – Valuation supplement
PRELIMINARY, ILLUSTRATIVE DRAFT – FOR REFERENCE ONLY AND SUBJECT TO MATERIAL
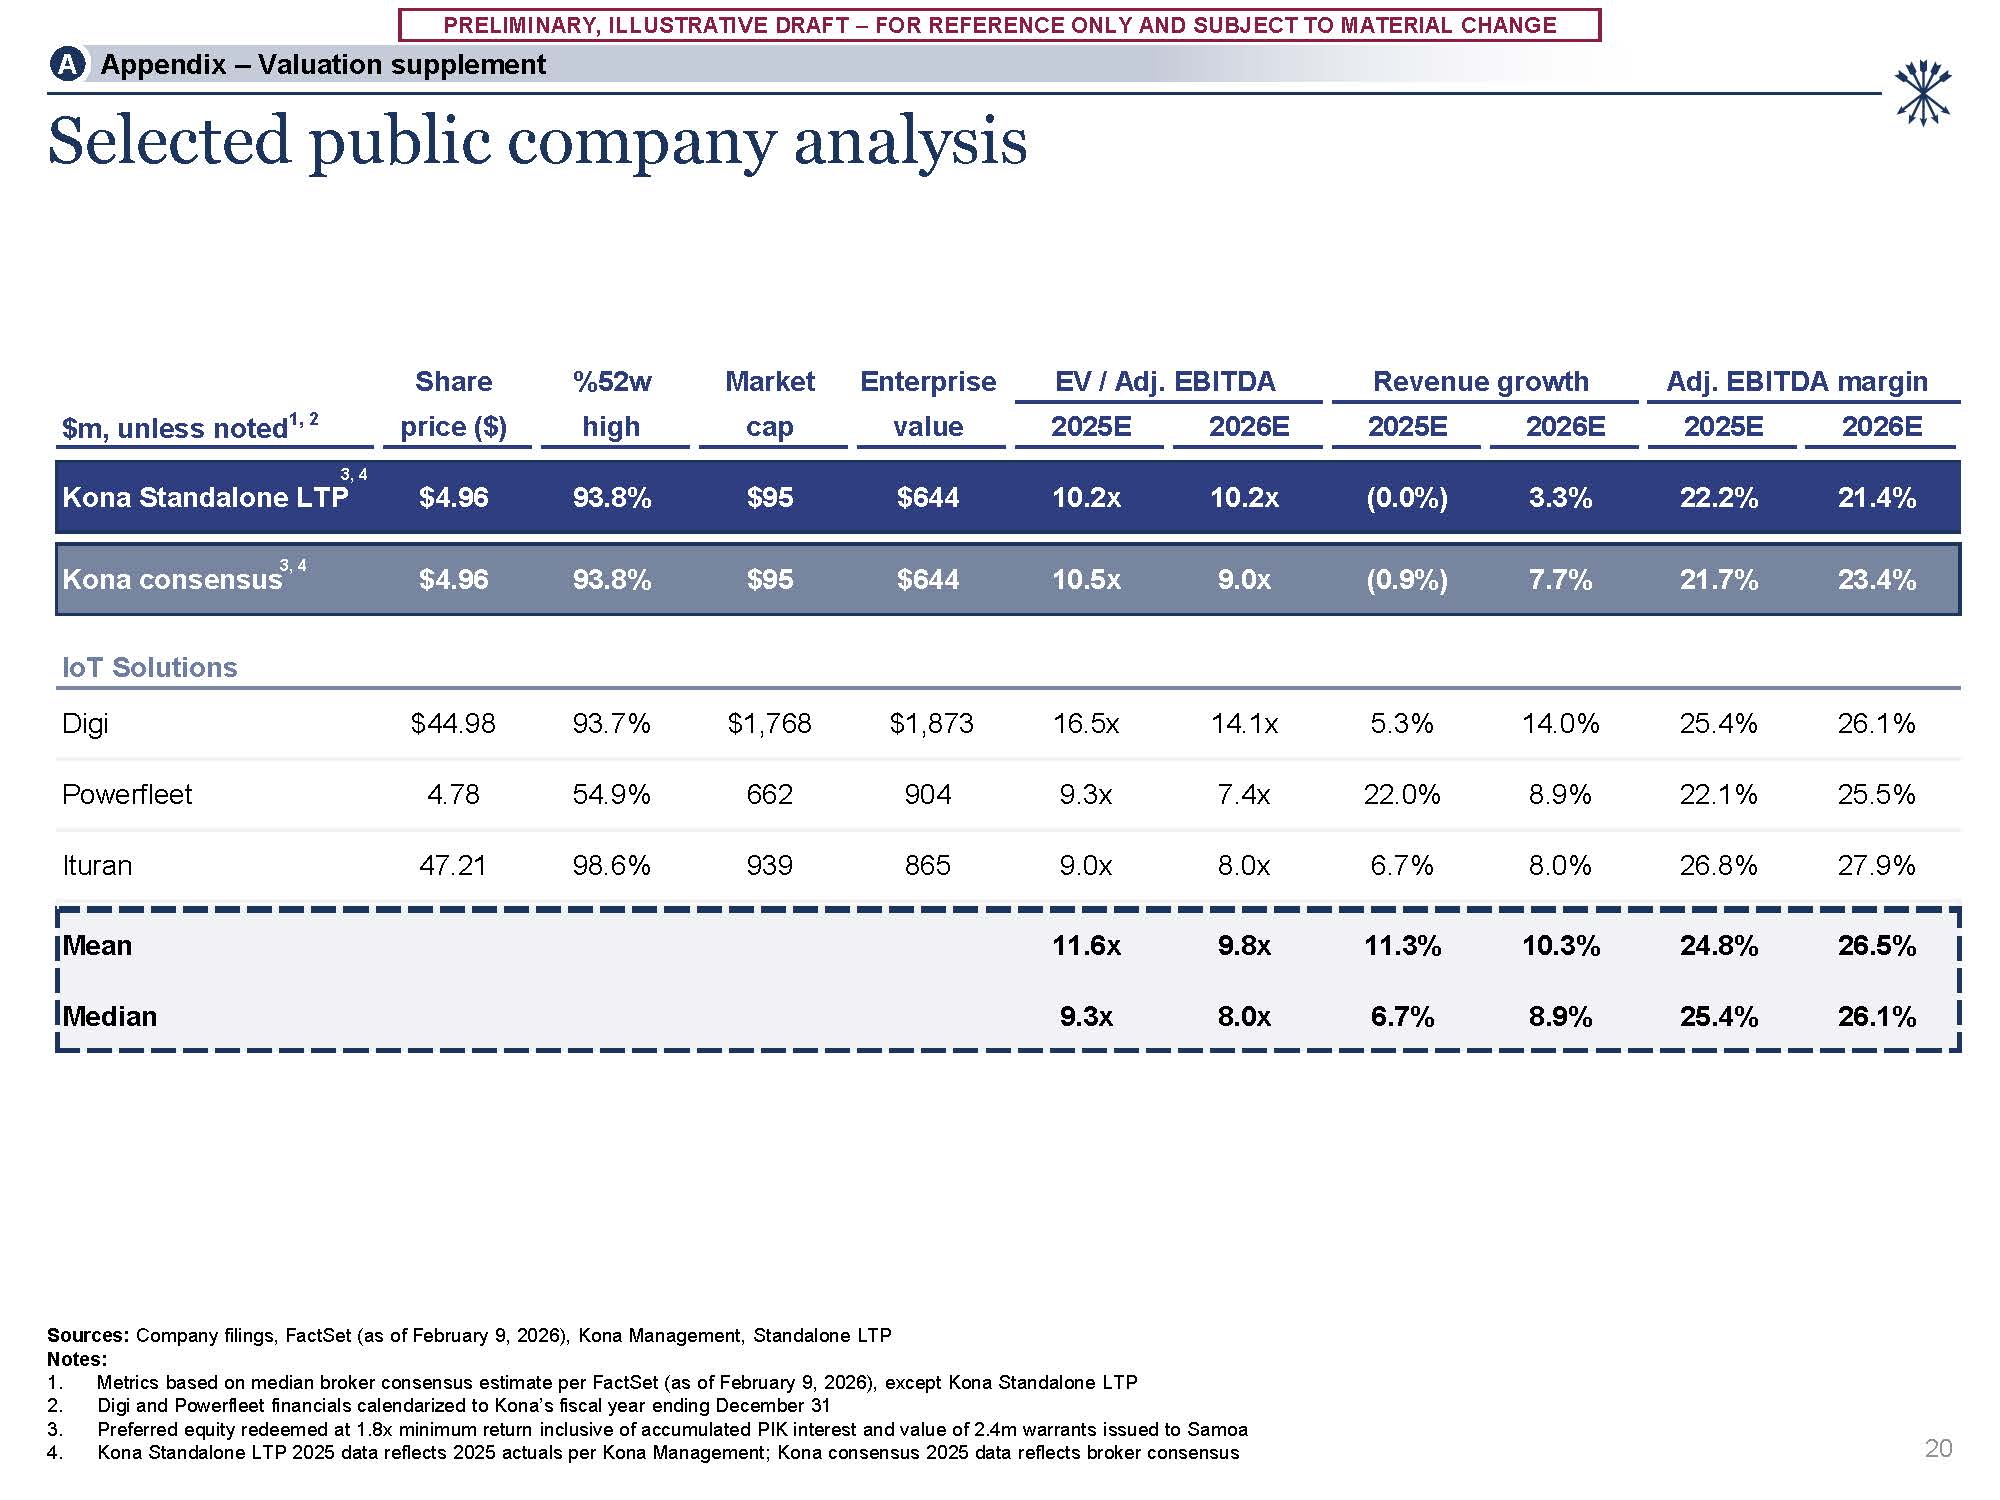
CHANGE 3, 4 Kona Standalone LTP $4.96 93.8% $95 $644 10.2x 10.2x (0.0%) 3.3% 22.2% 21.4% 3, 4 Kona consensus $4.96 93.8% $95 $644 10.5x 9.0x (0.9%) 7.7% 21.7% 23.4% IoT
Solutions Digi $44.98 93.7% $1,768 $1,873 16.5x 14.1x 5.3% 14.0% 25.4% 26.1% Powerfleet 4.78 54.9% 662 904 9.3x 7.4x 22.0% 8.9% 22.1% 25.5% Ituran 47.21 98.6% 939 865 9.0x 8.0x 6.7% 8.0% 26.8% 27.9% Mean 11.6x 9.8x 11.3% 10.3% 24.8% 26.5% Median 9.3x 8.0x 6.7% 8.9% 25.4% 26.1% Share %52w Market Enterprise EV
/ Adj. EBITDA Revenue growth Adj. EBITDA margin $m, unless noted1, 2 price ($) high cap value 2025E 2026E 2025E 2026E 2025E 2026E Selected public company analysis Sources: Company filings, FactSet (as of February 9, 2026), Kona
Management, Standalone LTP Notes: Metrics based on median broker consensus estimate per FactSet (as of February 9, 2026), except Kona Standalone LTP Digi and Powerfleet financials calendarized to Kona’s fiscal year ending December
31 Preferred equity redeemed at 1.8x minimum return inclusive of accumulated PIK interest and value of 2.4m warrants issued to Samoa Kona Standalone LTP 2025 data reflects 2025 actuals per Kona Management; Kona consensus 2025 data reflects
broker consensus 20 A Appendix – Valuation supplement
PRELIMINARY, ILLUSTRATIVE DRAFT – FOR REFERENCE ONLY AND SUBJECT TO MATERIAL
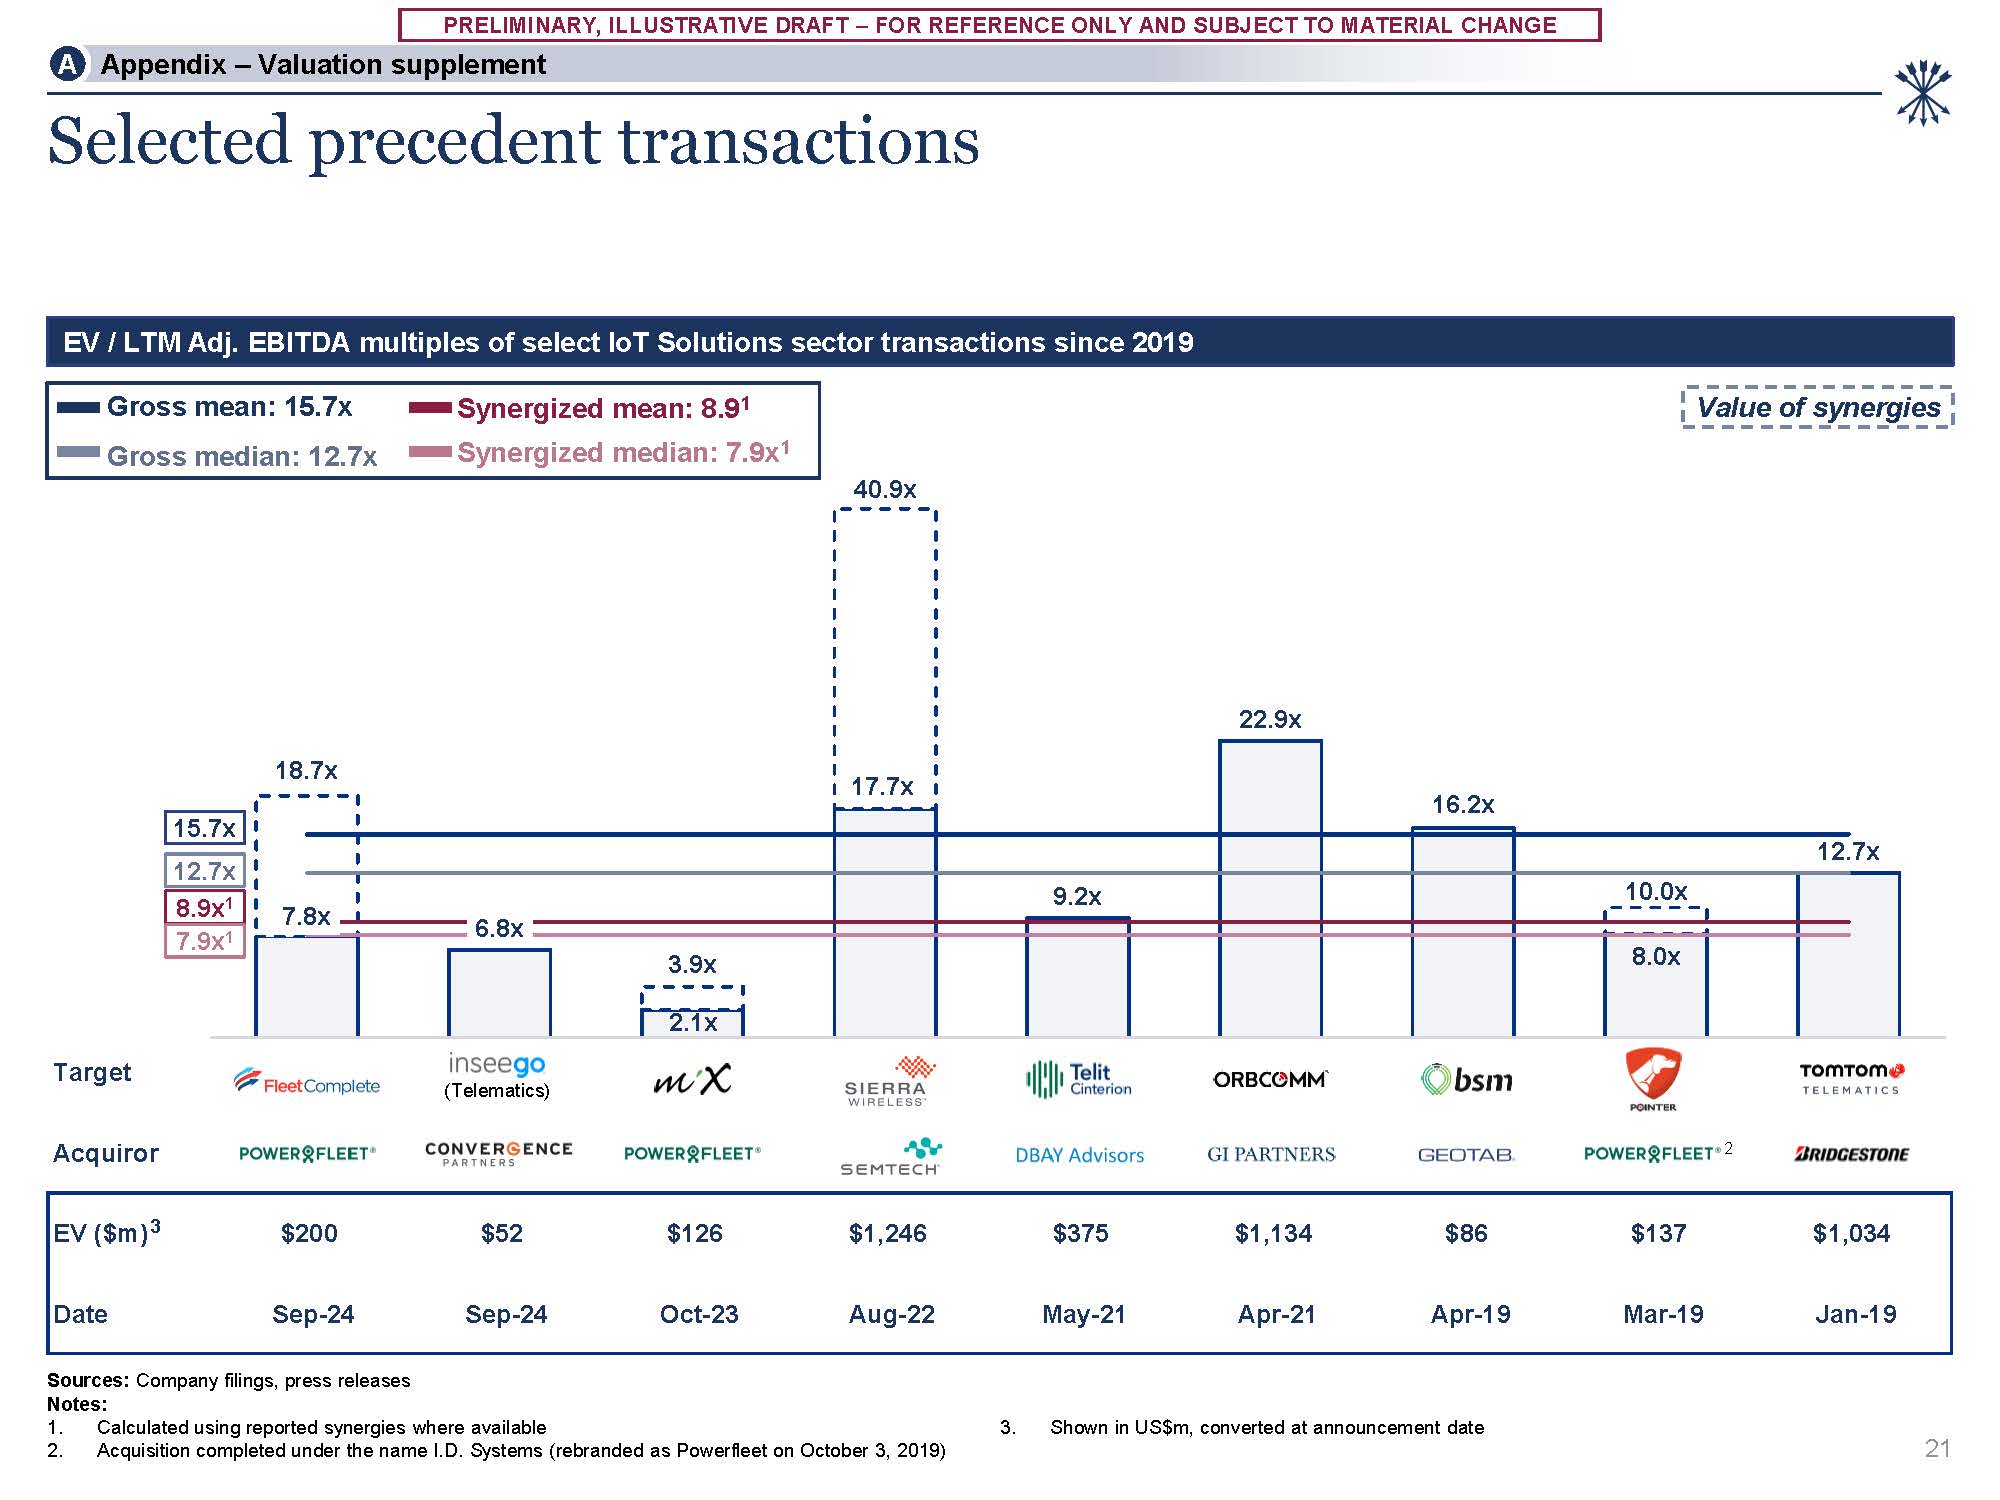
CHANGE A Appendix – Valuation supplement Target Acquiror EV
($m)3 $200 $52 $126 $1,246 $375 $1,134 $86 $137 $1,034 Date Sep-24 Sep-24 Oct-23 Aug-22 May-21 Apr-21 Apr-19 Mar-19 Jan-19 7.8x 2.1x 17.7x 8.0x 18.7x 6.8x 3.9x 40.9x 9.2x 22.9x 16.2x 10.0x 12.7x Selected
precedent transactions Sources: Company filings, press releases Notes: Calculated using reported synergies where available Acquisition completed under the name I.D. Systems (rebranded as Powerfleet on October 3, 2019) 3. Shown in US$m,
converted at announcement date EV / LTM Adj. EBITDA multiples of select IoT Solutions sector transactions since 2019 (Telematics) 2 Value of synergies 15.7x 12.7x 8.9x1 7.9x1 Gross mean: 15.7x Gross median: 12.7x Synergized mean: 8.91
Synergized median: 7.9x1 21
PRELIMINARY, ILLUSTRATIVE DRAFT – FOR REFERENCE ONLY AND SUBJECT TO MATERIAL
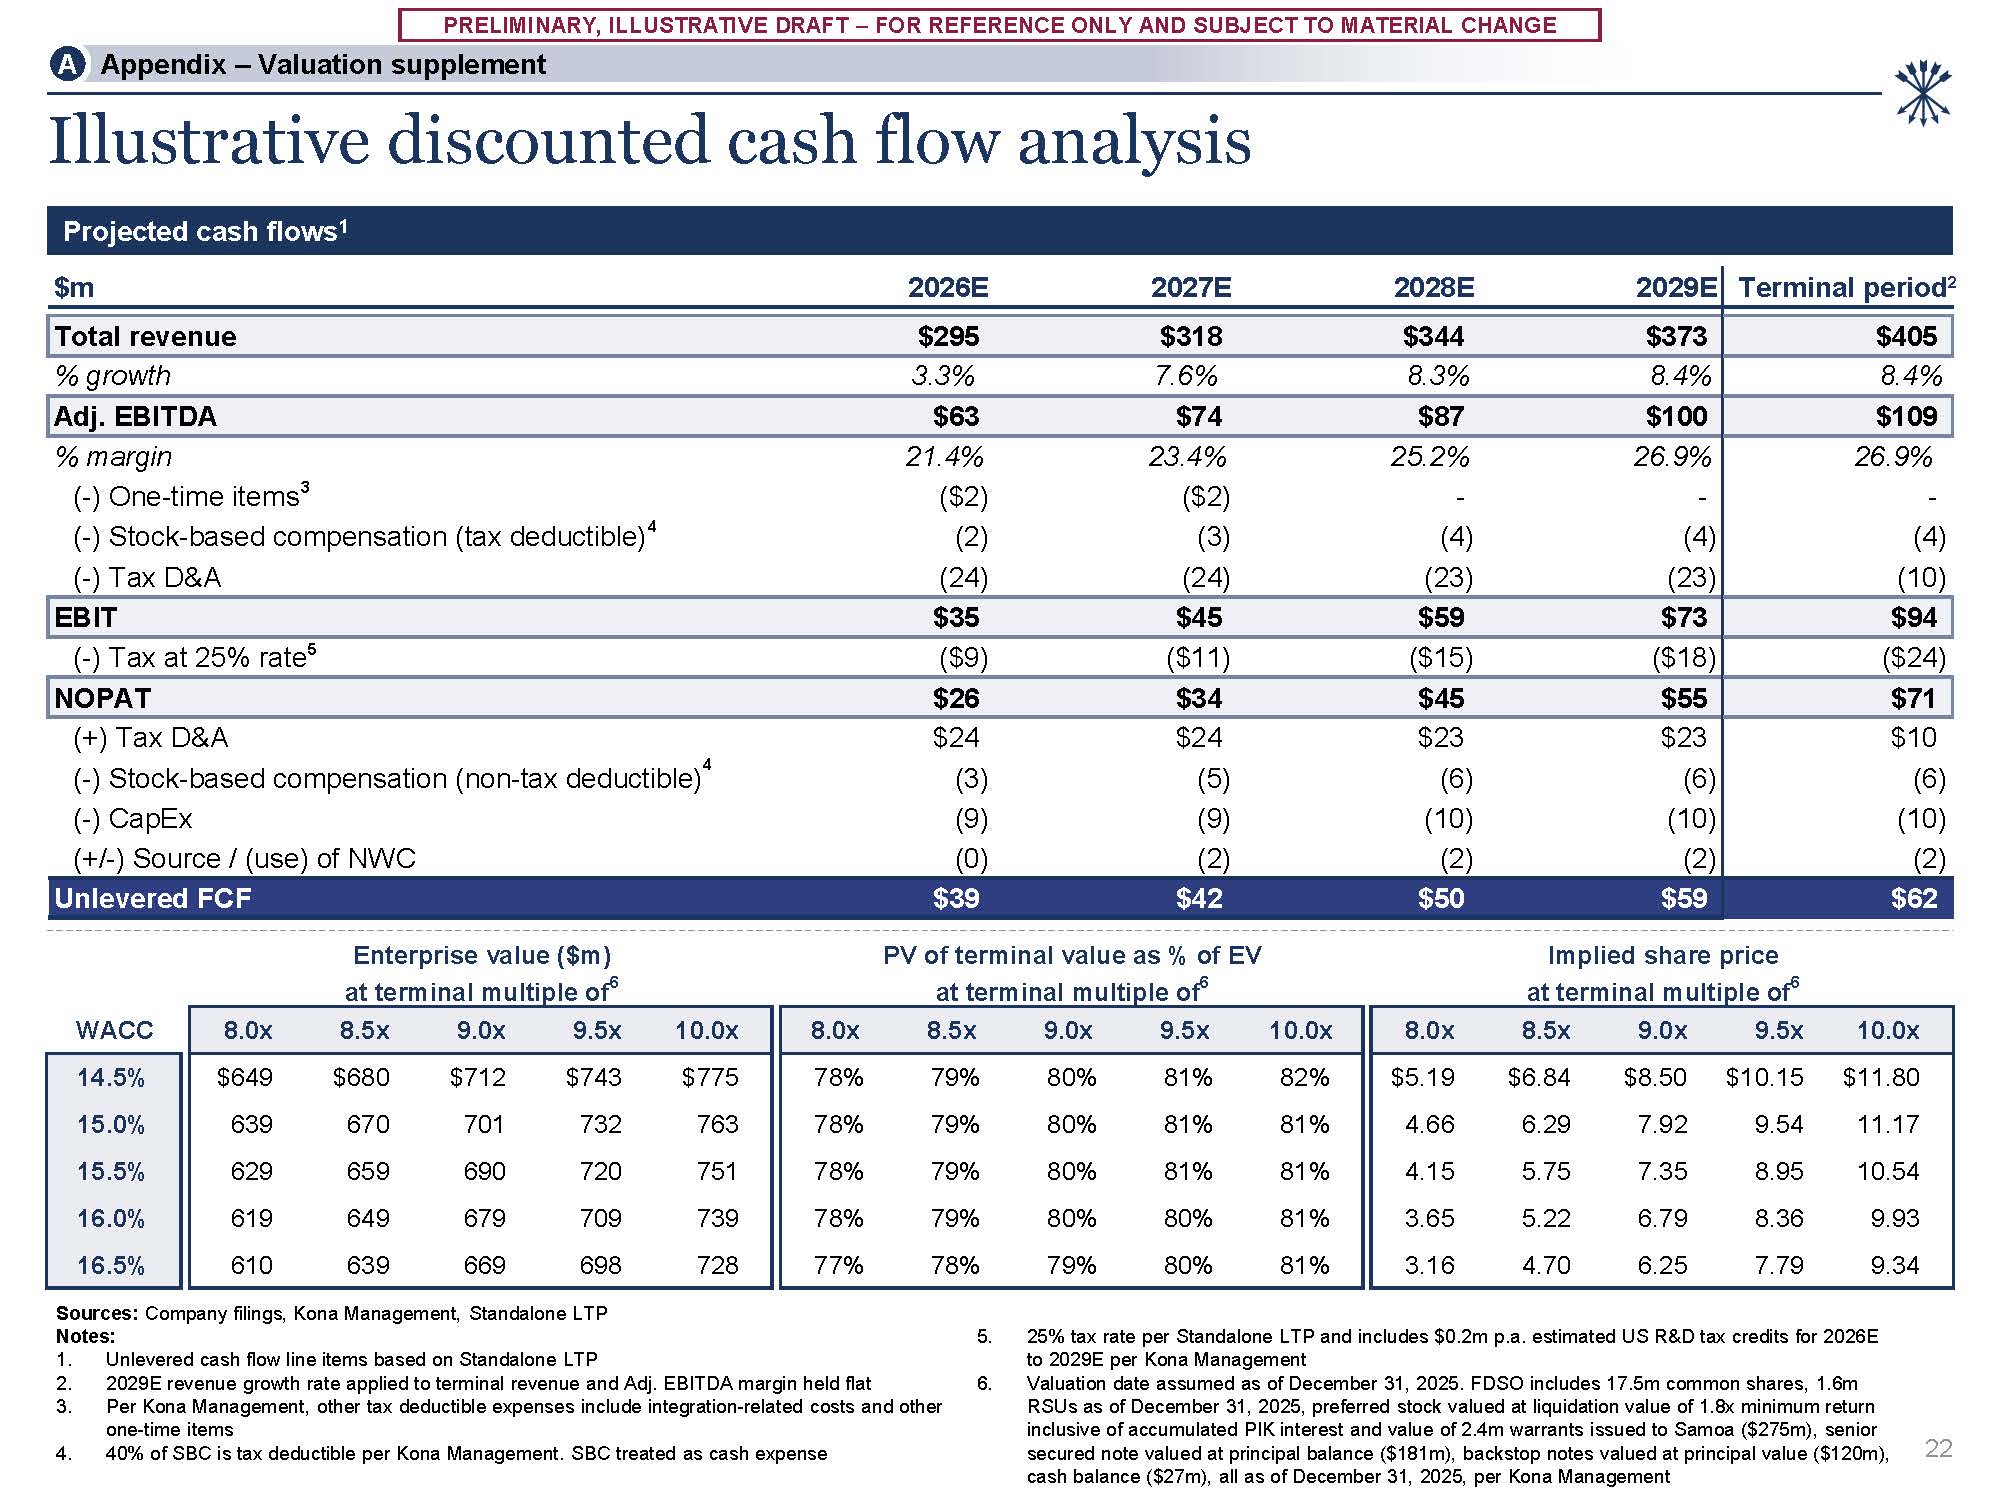
CHANGE A Appendix – Valuation supplement Illustrative discounted cash flow analysis Projected cash flows1 $m 2026E 2027E 2028E 2029E Terminal period2 Total revenue $295 $318 $344 $373 $405 %
growth 3.3% 7.6% 8.3% 8.4% 8.4% Adj. EBITDA $63 $74 $87 $100 $109 % margin 21.4% 23.4% 25.2% 26.9% 26.9% (-) One-time items3 ($2) ($2) - - - (-) Stock-based compensation (tax deductible)4 (2) (3) (4) (4) (4) (-)
Tax D&A (24) (24) (23) (23) (10) EBIT $35 $45 $59 $73 $94 (-) Tax at 25% rate5 ($9) ($11) ($15) ($18) ($24) NOPAT $26 $34 $45 $55 $71 (+) Tax D&A $24 $24 $23 $23 $10 (-) Stock-based compensation (non-tax
deductible)4 (3) (5) (6) (6) (6) (-) CapEx (9) (9) (10) (10) (10) (+/-) Source / (use) of NWC (0) (2) (2) (2) (2) Unlevered FCF $39 $42 $50 $59 $62 Sources: Company filings, Kona Management, Standalone
LTP Notes: Unlevered cash flow line items based on Standalone LTP 2029E revenue growth rate applied to terminal revenue and Adj. EBITDA margin held flat Per Kona Management, other tax deductible expenses include integration-related costs
and other one-time items 40% of SBC is tax deductible per Kona Management. SBC treated as cash expense 25% tax rate per Standalone LTP and includes $0.2m p.a. estimated US R&D tax credits for 2026E to 2029E per Kona Management Valuation
date assumed as of December 31, 2025. FDSO includes 17.5m common shares, 1.6m RSUs as of December 31, 2025, preferred stock valued at liquidation value of 1.8x minimum return inclusive of accumulated PIK interest and value of 2.4m warrants
issued to Samoa ($275m), senior secured note valued at principal balance ($181m), backstop notes valued at principal value ($120m), cash balance ($27m), all as of December 31, 2025, per Kona Management Enterprise value ($m) PV of terminal
value as % of EV Implied share price at terminal multiple of6 at terminal multiple of6 at terminal multiple
of6 22 WACC 8.0x 8.5x 9.0x 9.5x 10.0x 8.0x 8.5x 9.0x 9.5x 10.0x 8.0x 8.5x 9.0x 9.5x 10.0x 14.5% $649 $680 $712 $743 $775 78% 79% 80% 81% 82% $5.19 $6.84 $8.50 $10.15 $11.80 15.0% 639 670 701 732 763 78% 79% 80% 81% 81% 4.66 6.29 7.92 9.54 11.17 15.5% 629 659 690 720 751 78% 79% 80% 81% 81% 4.15 5.75 7.35 8.95 10.54 16.0% 619 649 679 709 739 78% 79% 80% 80% 81% 3.65 5.22 6.79 8.36 9.93 16.5% 610 639 669 698 728 77% 78% 79% 80% 81% 3.16 4.70 6.25 7.79 9.34
PRELIMINARY, ILLUSTRATIVE DRAFT – FOR REFERENCE ONLY AND SUBJECT TO MATERIAL
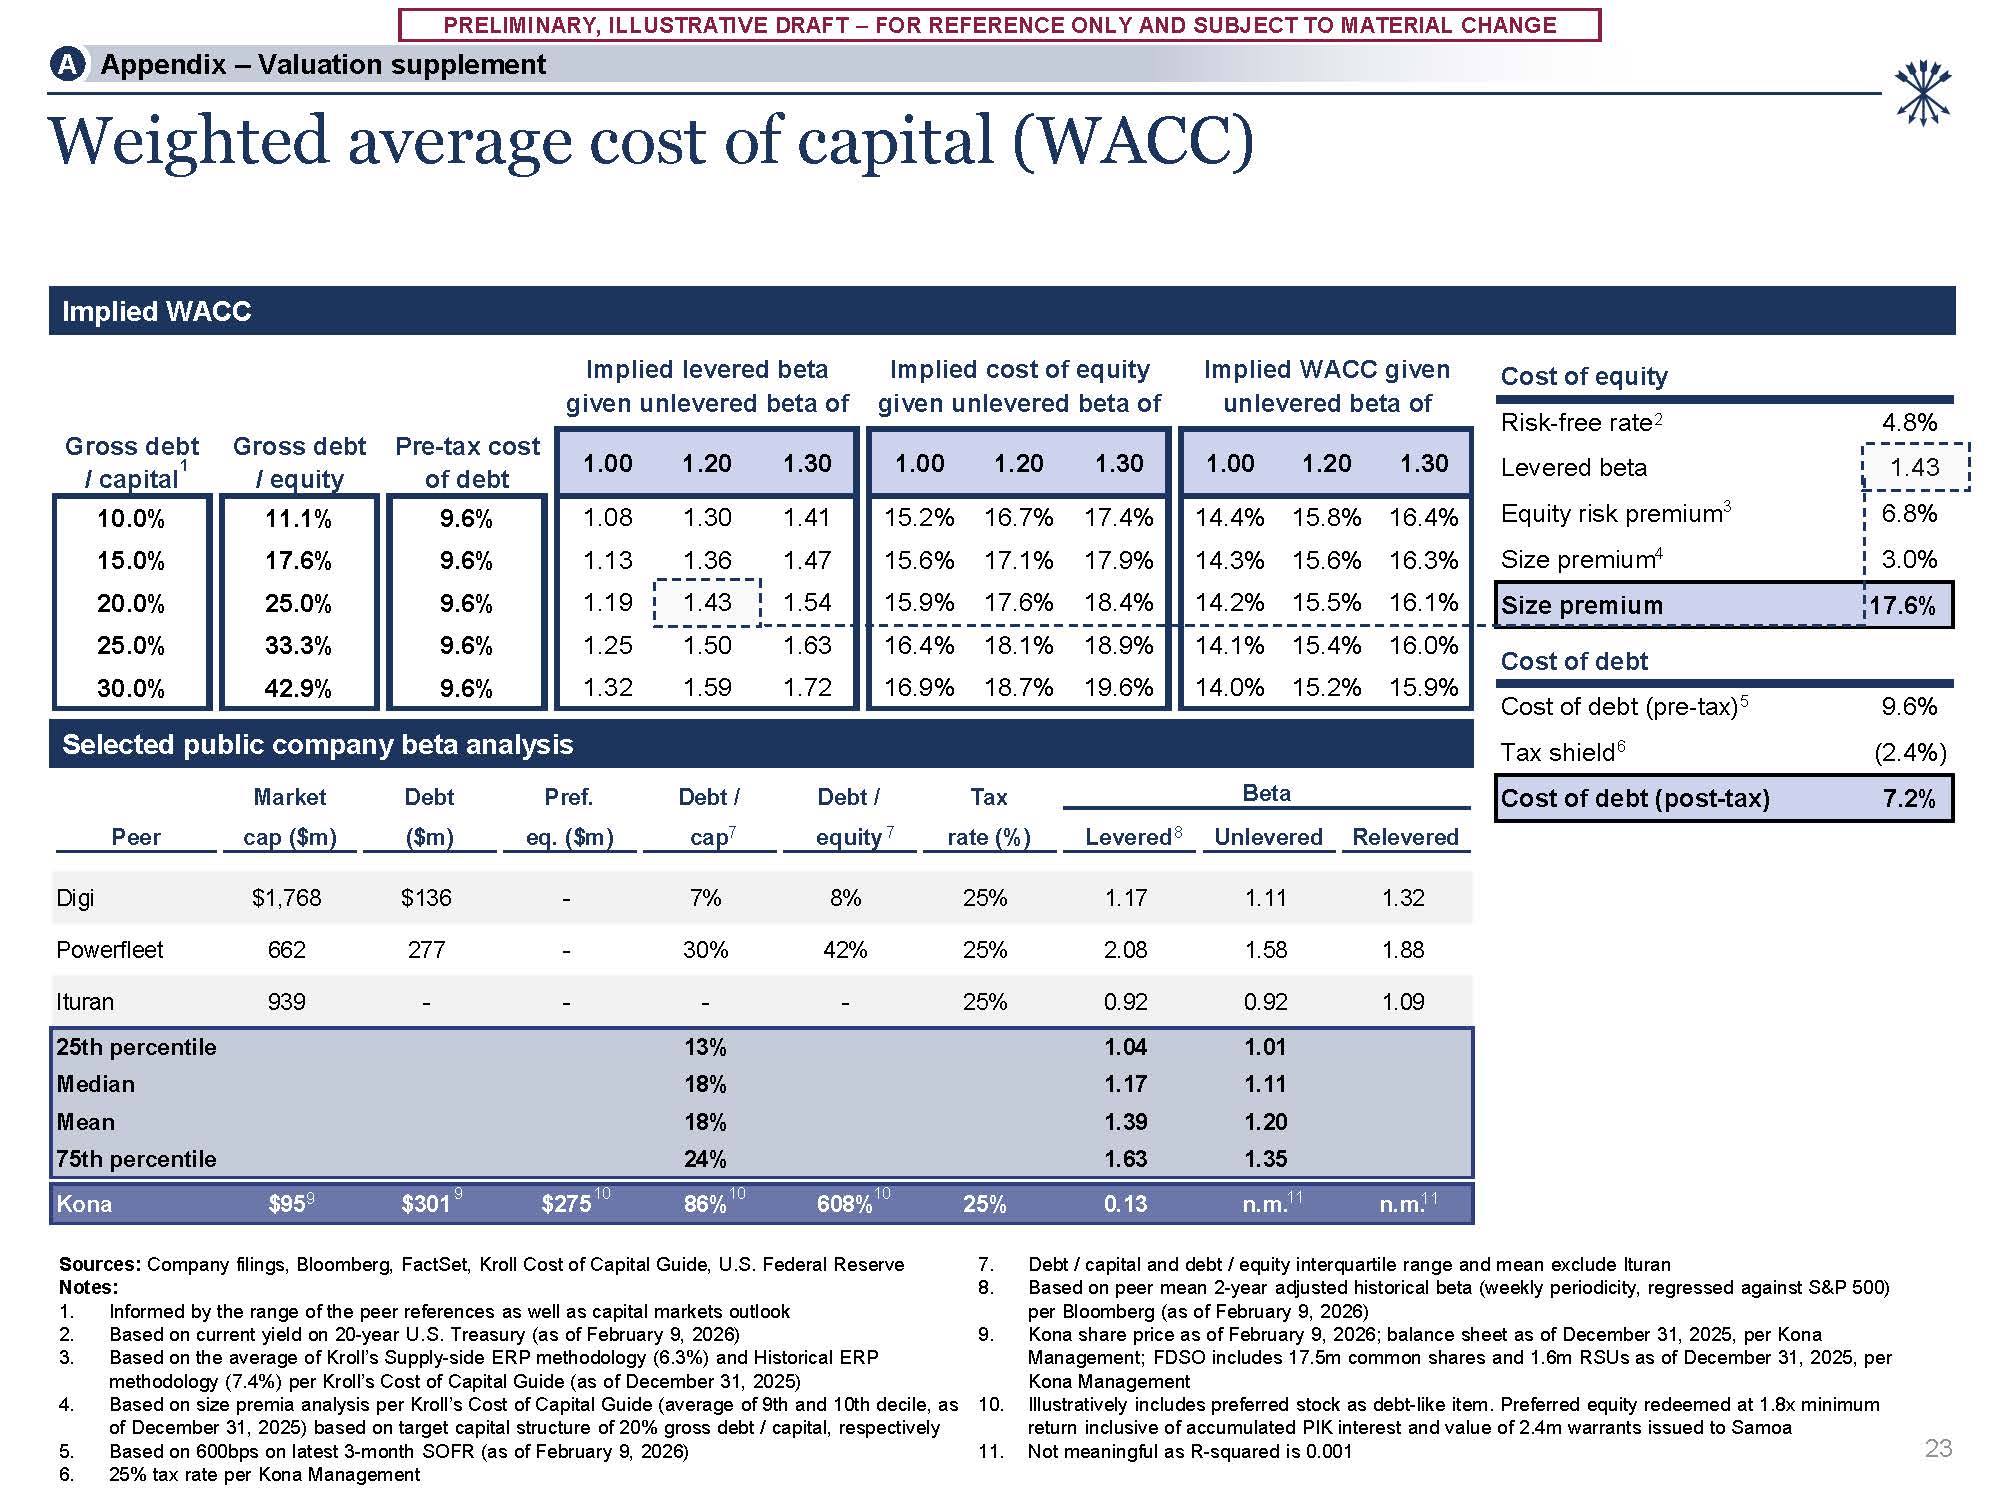
CHANGE Risk-free rate2 4.8% Levered beta 1.43 Equity risk premium3 6.8% Size premium4 3.0% Size premium 17.6% Cost of debt Cost of debt (pre-tax)5 9.6% Tax shield6 (2.4%) Cost of
equity Ituran 939 - - - - 25% 0.92 0.92 1.09 25th percentile 13% 1.04 1.01 Median 18% 1.17 1.11 Mean 18% 1.39 1.20 75th percentile 24% 1.63 1.35 Kona $959 $301
9 $27510 86%10 608%10 25% 0.13 n.m.11 n.m.11 23 Weighted average cost of capital (WACC) Sources: Company filings, Bloomberg, FactSet, Kroll Cost of Capital Guide, U.S. Federal Reserve Notes: Informed by the range of the peer
references as well as capital markets outlook Based on current yield on 20-year U.S. Treasury (as of February 9, 2026) Based on the average of Kroll’s Supply-side ERP methodology (6.3%) and Historical ERP methodology (7.4%) per Kroll’s Cost
of Capital Guide (as of December 31, 2025) Based on size premia analysis per Kroll’s Cost of Capital Guide (average of 9th and 10th decile, as of December 31, 2025) based on target capital structure of 20% gross debt / capital,
respectively Based on 600bps on latest 3-month SOFR (as of February 9, 2026) 25% tax rate per Kona Management Debt / capital and debt / equity interquartile range and mean exclude Ituran Based on peer mean 2-year adjusted historical beta
(weekly periodicity, regressed against S&P 500) per Bloomberg (as of February 9, 2026) Kona share price as of February 9, 2026; balance sheet as of December 31, 2025, per Kona Management; FDSO includes 17.5m common shares and 1.6m RSUs as
of December 31, 2025, per Kona Management Illustratively includes preferred stock as debt-like item. Preferred equity redeemed at 1.8x minimum return inclusive of accumulated PIK interest and value of 2.4m warrants issued to Samoa Not
meaningful as R-squared is 0.001 Implied WACC Selected public company beta analysis Gross debt / capital1 Gross debt / equity Pre-tax cost of
debt 1.00 1.20 1.30 1.00 1.20 1.30 1.00 1.20 1.30 10.0% 11.1% 9.6% 1.08 1.30 1.41 15.2% 16.7% 17.4% 14.4% 15.8% 16.4% 15.0% 17.6% 9.6% 1.13 1.36 1.47 15.6% 17.1% 17.9% 14.3% 15.6% 16.3% 20.0% 25.0% 9.6% 1.19 1.43 1.54 15.9% 17.6% 18.4% 14.2% 15.5% 16.1% 25.0% 33.3% 9.6% 1.25 1.50 1.63 16.4% 18.1% 18.9% 14.1% 15.4% 16.0% 30.0% 42.9% 9.6% 1.32 1.59 1.72 16.9% 18.7% 19.6% 14.0% 15.2% 15.9% Market Debt Pref. Debt
/ Debt / Tax Beta Cost of debt (post-tax) 7.2% Peer cap ($m) ($m) eq. ($m) cap7 equity 7 rate (%) Levered8 Unlevered Relevered Digi $1,768 $136 - 7% 8% 25% 1.17 1.11 1.32 Powerfleet 662 277 - 30% 42% 25% 2.08 1.58
1.88 A Appendix – Valuation supplement Implied levered beta given unlevered beta of Implied cost of equity given unlevered beta of Implied WACC given unlevered beta of
PRELIMINARY, ILLUSTRATIVE DRAFT – FOR REFERENCE ONLY AND SUBJECT TO MATERIAL
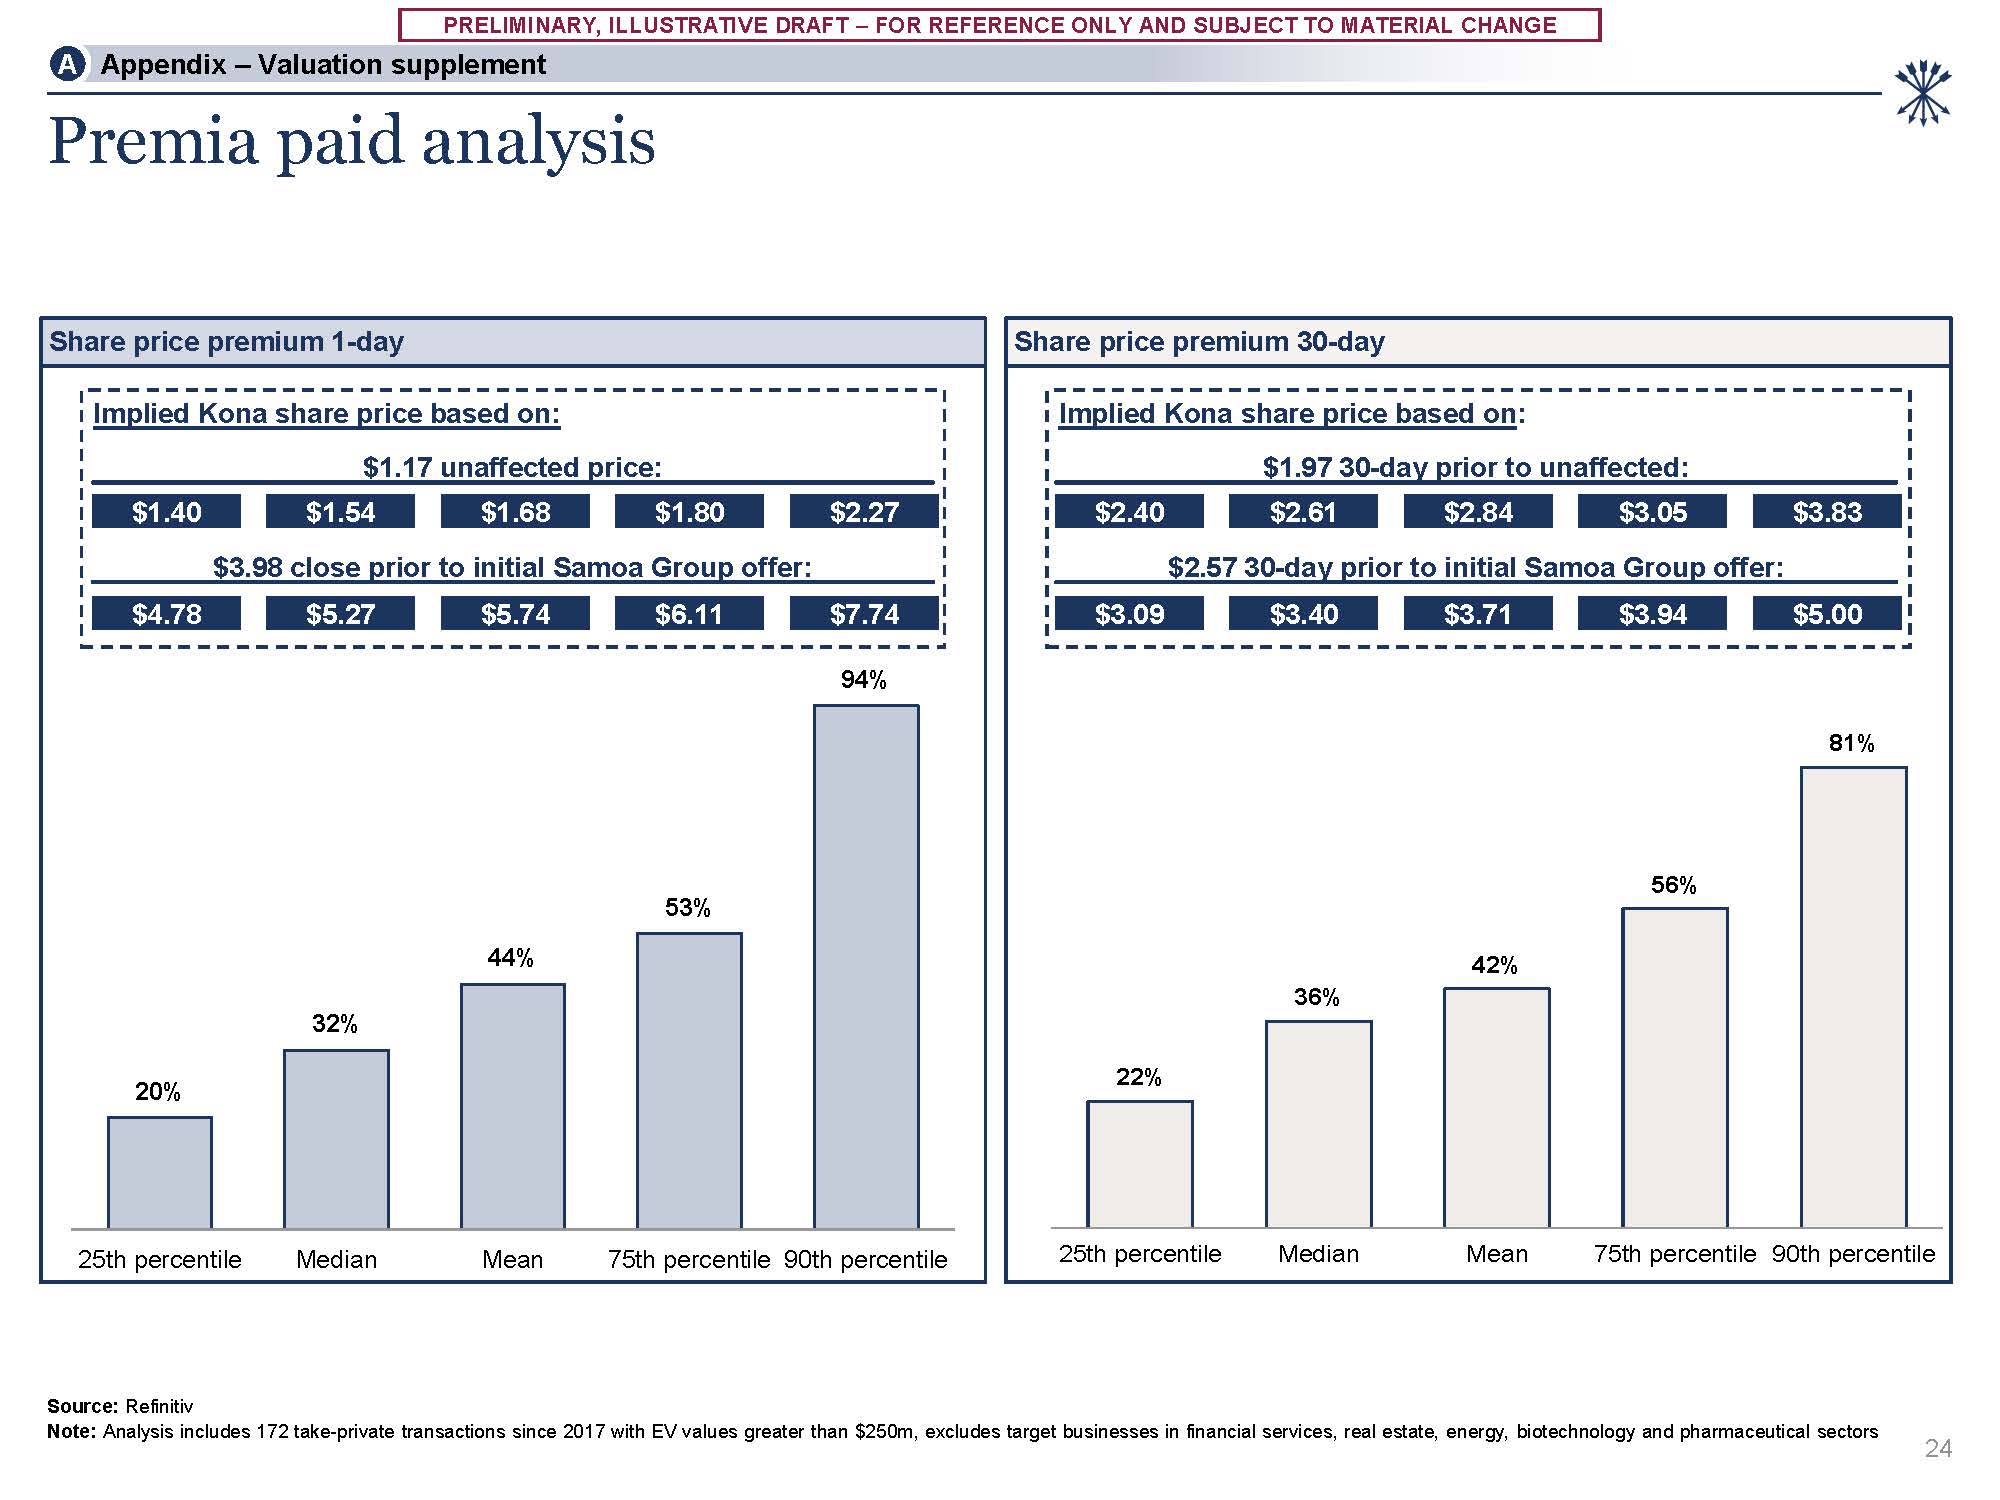
CHANGE 20% 32% 44% 53% 94% 25th percentile Median Mean 75th percentile 90th percentile 22% 36% 42% 56% 81% 25th percentile Median Mean 75th percentile 90th percentile Premia paid analysis Share price premium 30-day Source:
Refinitiv Note: Analysis includes 172 take-private transactions since 2017 with EV values greater than $250m, excludes target businesses in financial services, real estate, energy, biotechnology and pharmaceutical sectors 24 A Appendix –
Valuation supplement $2.84 $2.61 $3.05 $3.71 $3.40 $3.94 Implied Kona share price based on: $1.97 30-day prior to unaffected: $2.40 $3.83 $2.57 30-day prior to initial Samoa Group offer: $3.09
$5.00 $1.40 $1.68 $1.54 $1.80 $2.27 $4.78 $5.74 $5.27 $6.11 $7.74 Implied Kona share price based on: $1.17 unaffected price: $3.98 close prior to initial Samoa Group offer: Share price premium 1-day
PRELIMINARY, ILLUSTRATIVE DRAFT – FOR REFERENCE ONLY AND SUBJECT TO MATERIAL
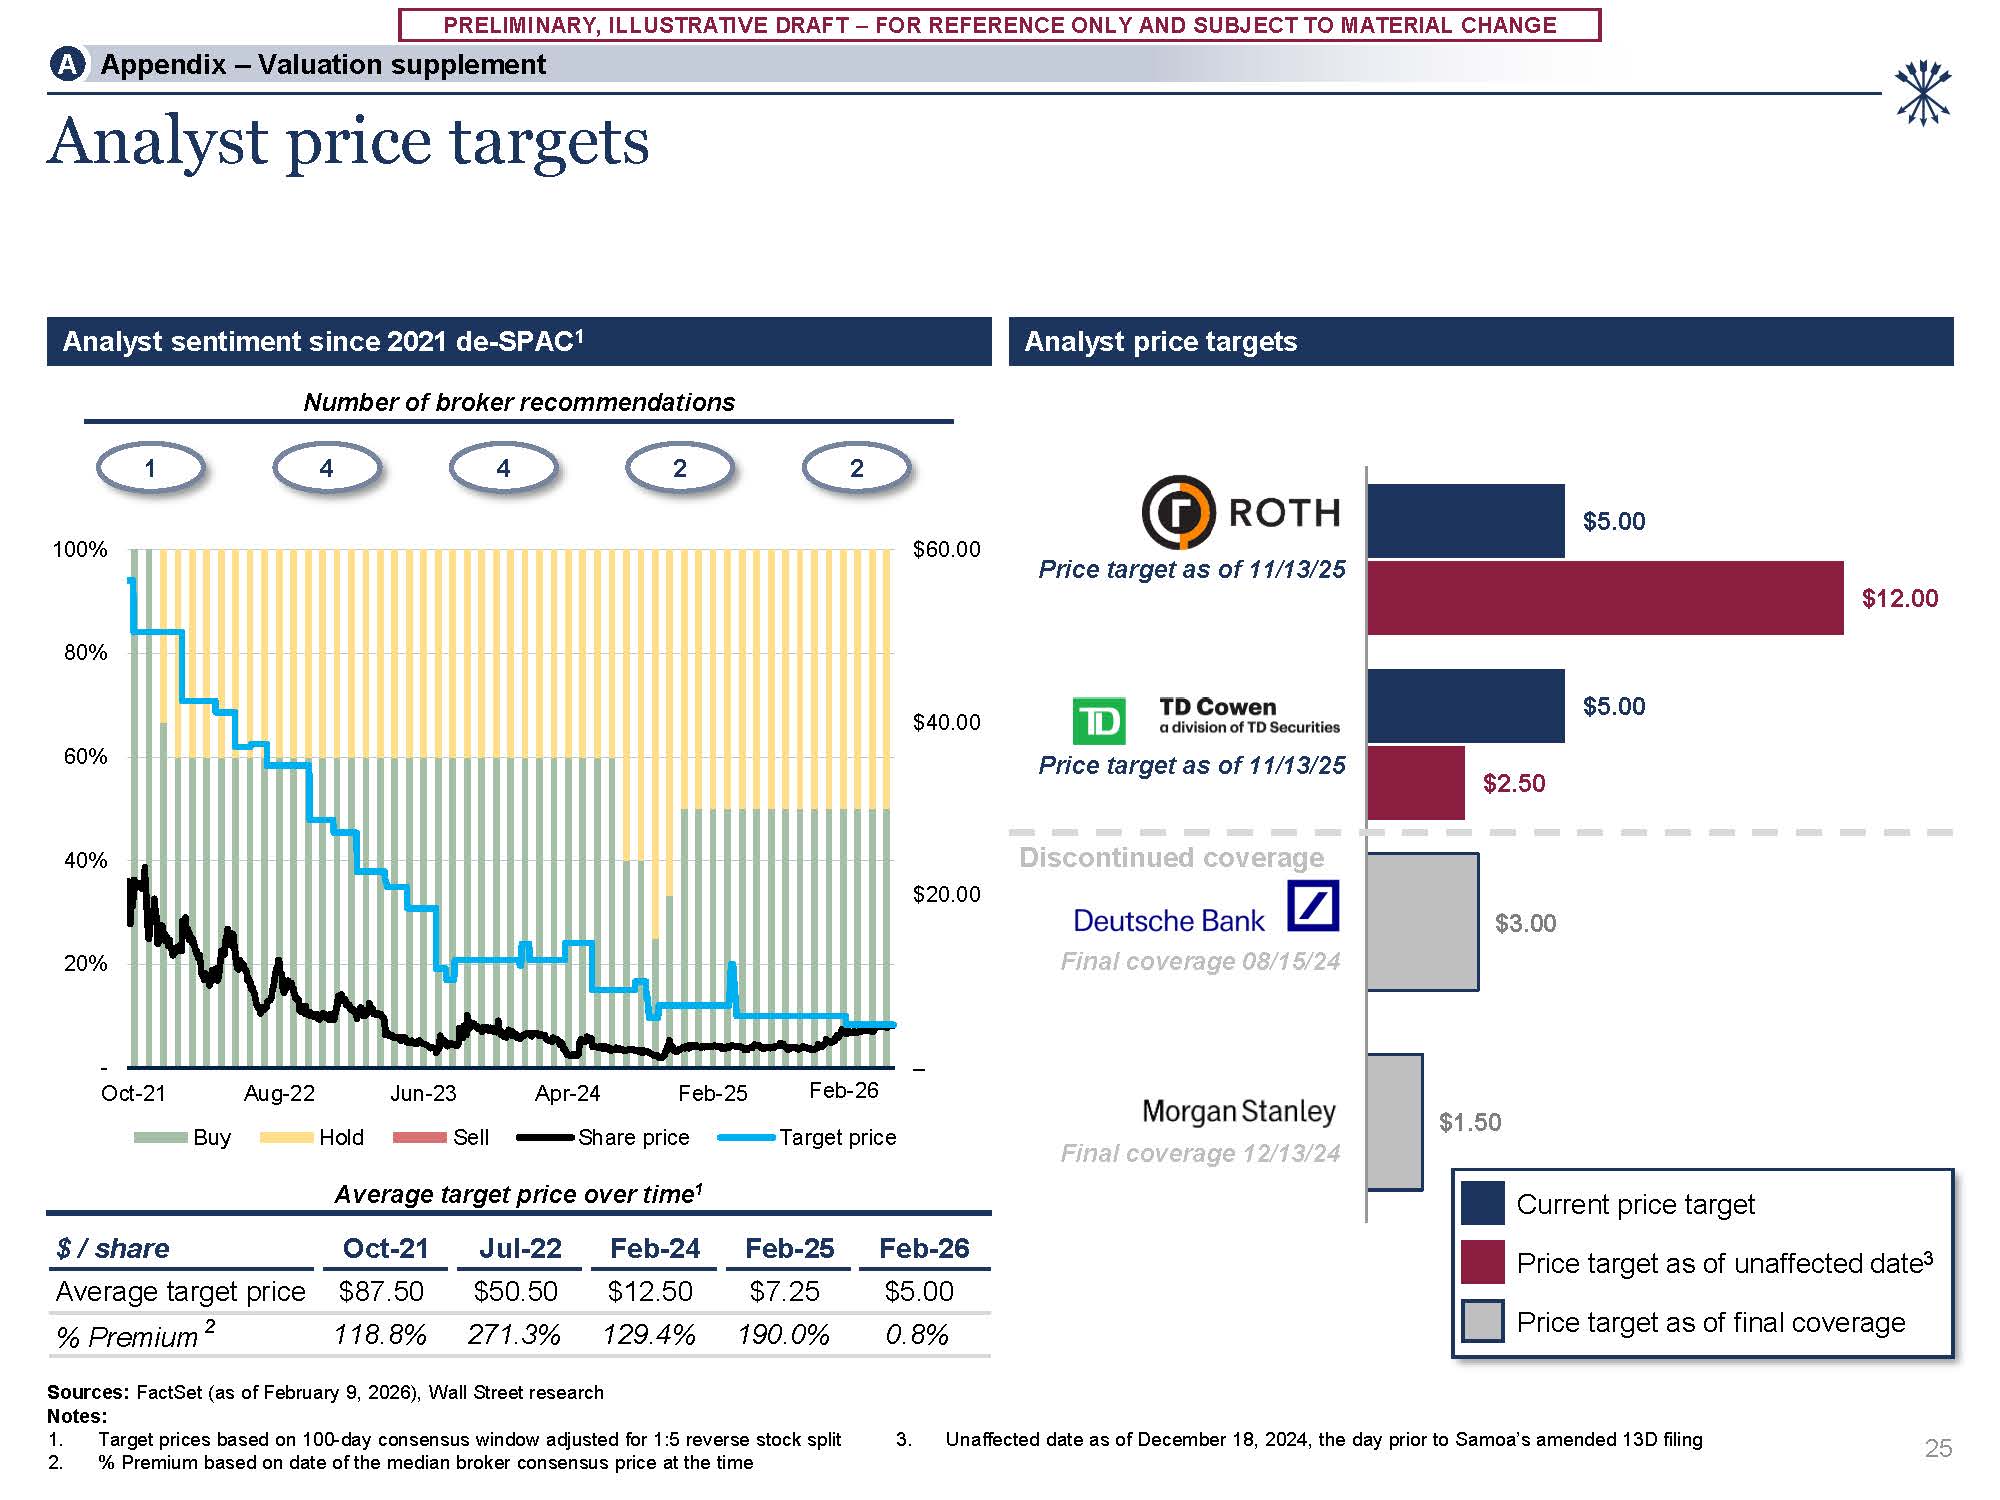
CHANGE – $20.00 $40.00 $60.00 - 20% 40% 60% 80% 100% Oct-21 Aug-22 Dec-25 Buy Hold Jun-23 Apr-24 Feb-25 Sell Share price Target price $5.00 $5.00 $12.00 $2.50 $3.00 $1.50 Discontinued coverage Analyst price
targets Analyst sentiment since 2021 de-SPAC1 Analyst price targets 1 2 Number of broker recommendations 4 4 2 $ / share Oct-21 Jul-22 Feb-24 Feb-25 Feb-26 Average target price $87.50 $50.50 $12.50 $7.25 $5.00 % Premium
2 118.8% 271.3% 129.4% 190.0% 0.8% Average target price over time1 Sources: FactSet (as of February 9, 2026), Wall Street research Notes: Target prices based on 100-day consensus window adjusted for 1:5 reverse stock split % Premium
based on date of the median broker consensus price at the time 3. Unaffected date as of December 18, 2024, the day prior to Samoa’s amended 13D filing Price target as of 11/13/25 Price target as of 11/13/25 Final coverage 12/13/24 Final
coverage 08/15/24 Current price target Price target as of unaffected date3 Price target as of final coverage 25 A Appendix – Valuation supplement Feb-26