Project Kona Updated valuation materials January 1, 2026 DRAFT All numbers and
references herein are highly preliminary and subject to material refinement Exhibit (c)(ix)
PRELIMINARY, ILLUSTRATIVE DRAFT – FOR REFERENCE ONLY AND SUBJECT TO MATERIAL
CHANGE Disclaimer 1. Section name This presentation was prepared by Rothschild & Co US Inc. (“Rothschild & Co”) on a confidential basis for the benefit and internal use of the Special Committee (the “Special Committee”) of the Board
of Directors of KORE Group Holdings, Inc. (the “Company” or “Kona”) in the context of the Special Committee’s consideration of the matters described herein. In creating this presentation, Rothschild & Co has relied upon information that is
publicly available or which was provided to Rothschild & Co by or on behalf of the Company’s management, including, without limitation, management operating and financial forecasts or projections. Such information involves numerous
significant assumptions and subjective determinations that may or may not be correct. Rothschild & Co has not assumed any responsibility for independent verification of any of such information contained herein, including, but not limited
to, any forecasts or projections set forth herein, and Rothschild & Co has relied on such information being complete and accurate in all material respects. Accordingly, no representation or warranty, express or implied, can be made or is
made by Rothschild & Co as to the accuracy or completeness of any such information or the achievability of any such forecasts or projections. Except where otherwise indicated, this presentation speaks as of the date hereof and is
necessarily based upon the information available to Rothschild & Co and financial, stock market and other conditions and circumstances existing and disclosed to Rothschild & Co as of the date hereof, all of which are subject to change.
Rothschild & Co does not have any obligation to update, bring-down, review or reaffirm this presentation. Under no circumstances should the delivery of this presentation imply that any information or analyses included in this presentation
would be the same if made as of any other date. Nothing contained in this presentation is, or shall be relied upon as, a promise or representation as to the past, present or future. Nothing contained herein shall be deemed to be a
recommendation from Rothschild & Co to any party, including without limitation, any security holder of the Company, to enter into any transaction or to take any course of action. By accepting these materials, the Special Committee
acknowledges that Rothschild & Co is not in the business of providing (and the Special Committee is not relying on Rothschild & Co for) legal, tax or accounting advice, and the Special Committee should receive (and rely on) separate and
qualified legal, tax and accounting advice. These materials do not constitute an offer or solicitation to sell or purchase any securities. Rothschild & Co is not acting in any capacity as a fiduciary or agent of the Special Committee, the
Board of Directors of the Company, the Company or the Company’s security holders. In the ordinary course of their asset management, merchant banking and other business activities, affiliates of Rothschild & Co may at any time hold long or
short positions, and may trade or otherwise effect transactions, for their own accounts or the accounts of their clients in equity, debt or other securities (or related derivative securities) or financial instruments of the Company or any of
its affiliates or any other company that may be involved in any transaction. This presentation is confidential and was not prepared with a view to public disclosure or filing thereof under state or federal securities laws or otherwise. This
presentation may not be copied by, or disclosed or made available to, any person without the prior written consent of Rothschild & Co. This presentation was not prepared for use by readers not as familiar with the business and affairs of
the Company as the Special Committee, and accordingly, Rothschild & Co does not take any responsibility for the accuracy or completeness of any material if used by persons other than the Special Committee. Rothschild & Co shall not
have any liability, whether direct or indirect, in contract or tort or otherwise, to any person in connection with this presentation. 2
PRELIMINARY, ILLUSTRATIVE DRAFT – FOR REFERENCE ONLY AND SUBJECT TO MATERIAL
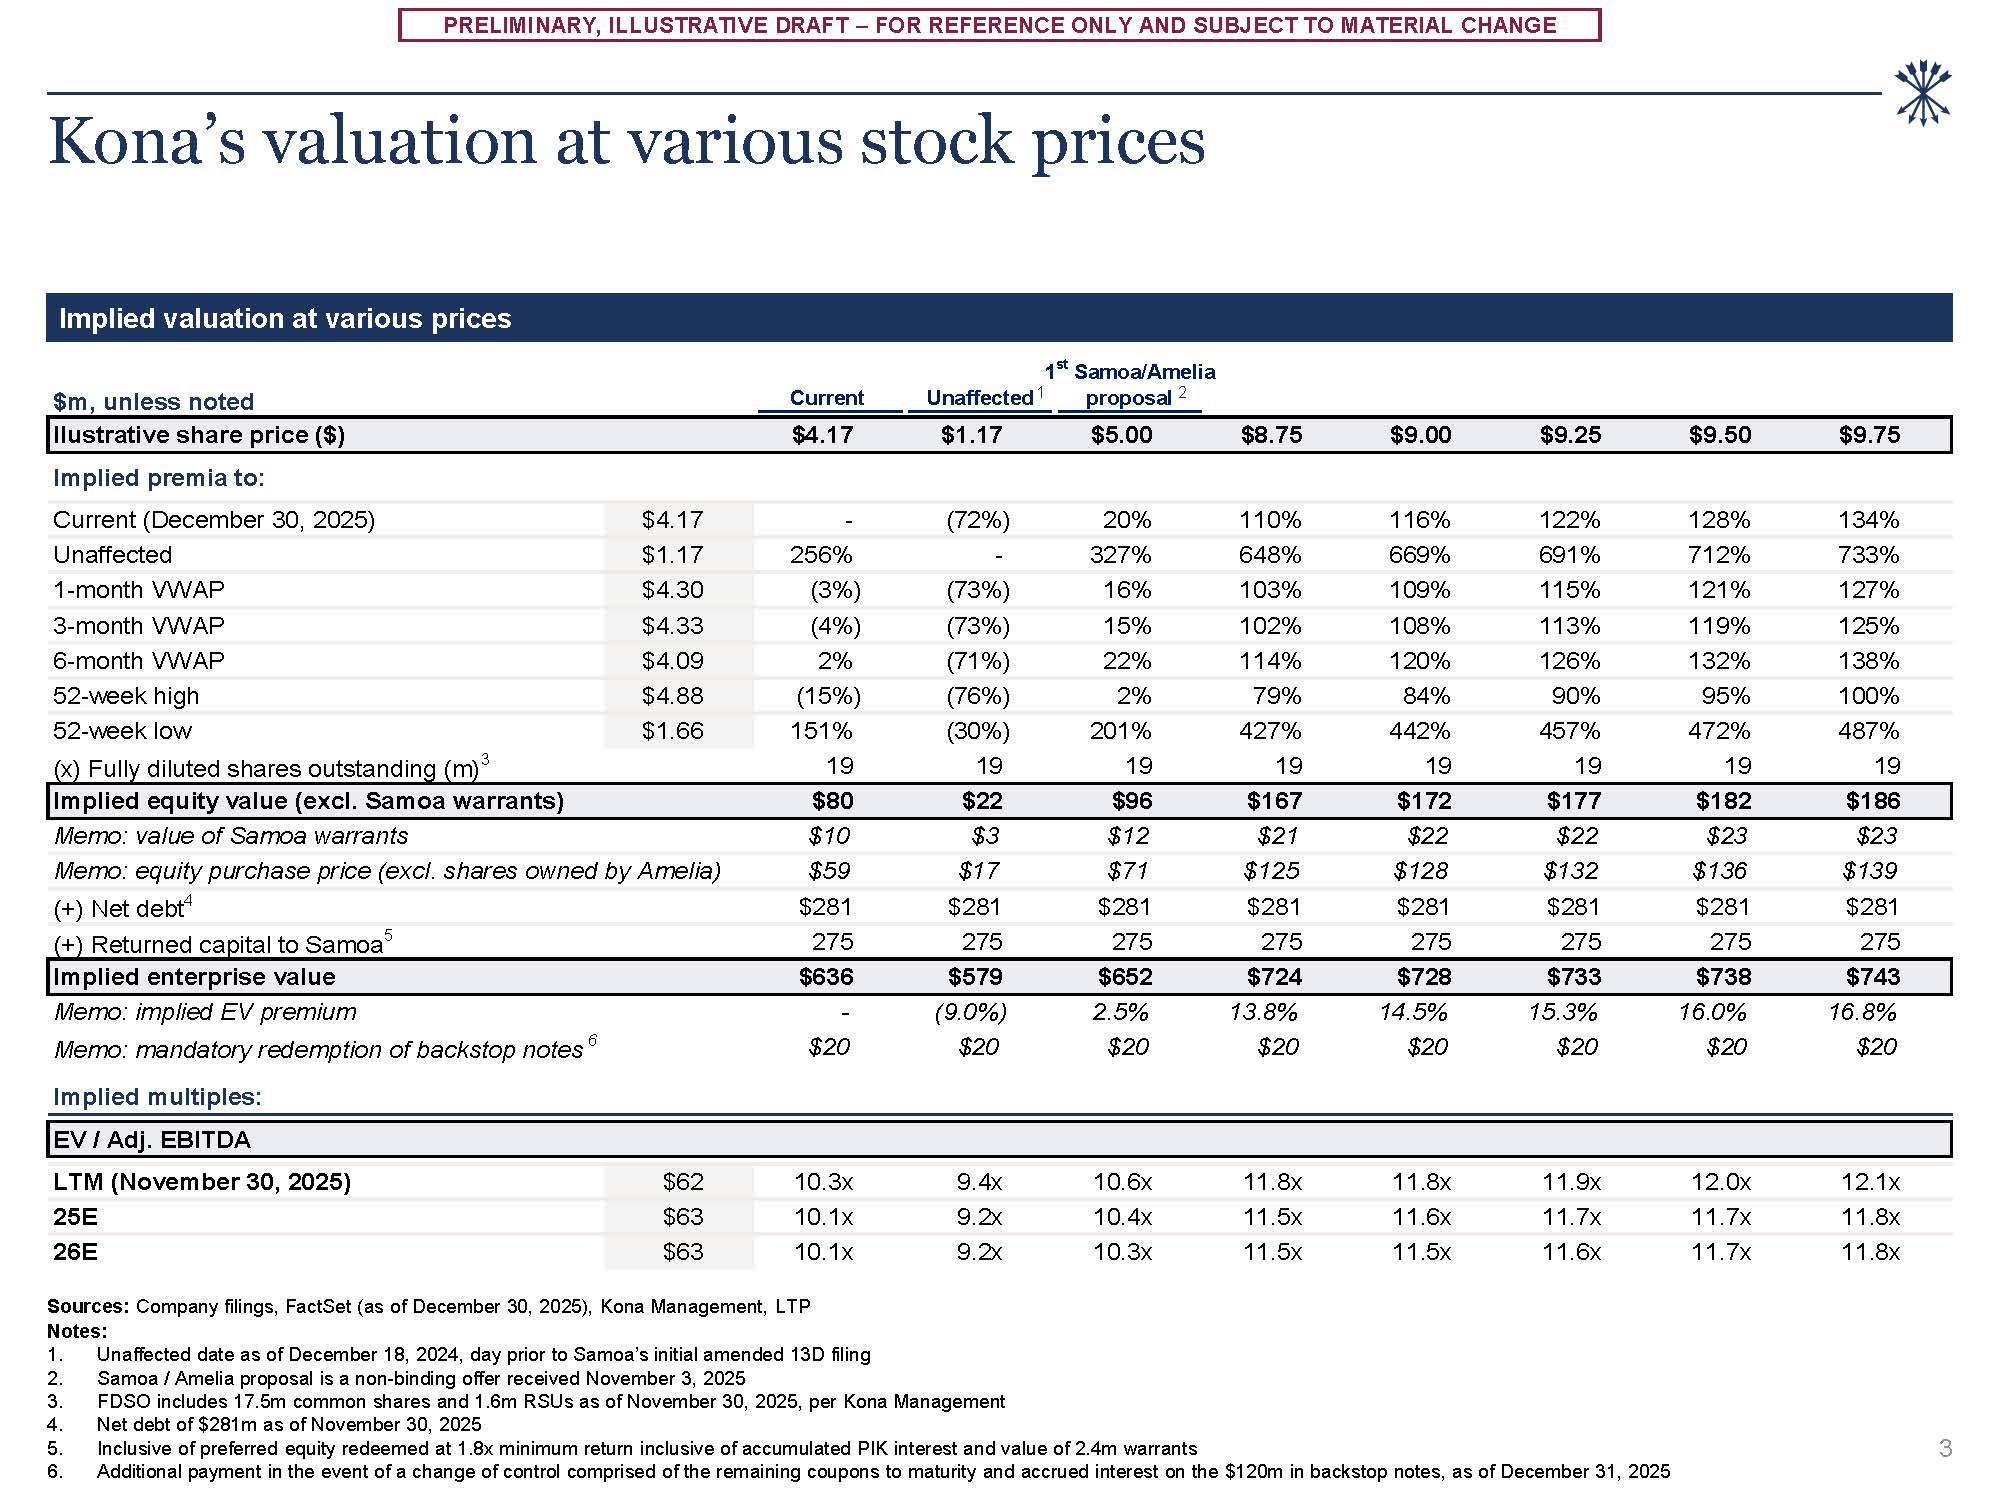
CHANGE Implied valuation at various prices $m, unless noted Current Unaffected 1st Samoa/Amelia 1 proposal 2 Ilustrative share price ($) $4.17 $1.17 $5.00 $8.75 $9.00 $9.25 $9.50 $9.75 Implied premia to: Current (December 30,
2025) $4.17 - (72%) 20% 110% 116% 122% 128% 134% Unaffected $1.17 256% - 327% 648% 669% 691% 712% 733% 1-month VWAP $4.30 (3%) (73%) 16% 103% 109% 115% 121% 127% 3-month
VWAP $4.33 (4%) (73%) 15% 102% 108% 113% 119% 125% 6-month VWAP $4.09 2% (71%) 22% 114% 120% 126% 132% 138% 52-week high $4.88 (15%) (76%) 2% 79% 84% 90% 95% 100% 52-week
low $1.66 151% (30%) 201% 427% 442% 457% 472% 487% (x) Fully diluted shares outstanding (m)3 19 19 19 19 19 19 19 19 Implied equity value (excl. Samoa warrants) $80 $22 $96 $167 $172 $177 $182 $186 Memo: value of
Samoa warrants $10 $3 $12 $21 $22 $22 $23 $23 Memo: equity purchase price (excl. shares owned by Amelia) $59 $17 $71 $125 $128 $132 $136 $139 (+) Net debt4 $281 $281 $281 $281 $281 $281 $281 $281 (+) Returned capital
to Samoa5 275 275 275 275 275 275 275 275 Implied enterprise value $636 $579 $652 $724 $728 $733 $738 $743 Memo: implied EV premium - (9.0%) 2.5% 13.8% 14.5% 15.3% 16.0% 16.8% Memo: mandatory redemption of backstop
notes 6 $20 $20 $20 $20 $20 $20 $20 $20 Implied multiples: EV / Adj. EBITDA LTM (November 30,
2025) $62 10.3x 9.4x 10.6x 11.8x 11.8x 11.9x 12.0x 12.1x 25E $63 10.1x 9.2x 10.4x 11.5x 11.6x 11.7x 11.7x 11.8x 26E $63 10.1x 9.2x 10.3x 11.5x 11.5x 11.6x 11.7x 11.8x Kona’s valuation at various stock
prices Sources: Company filings, FactSet (as of December 30, 2025), Kona Management, LTP Notes: Unaffected date as of December 18, 2024, day prior to Samoa’s initial amended 13D filing Samoa / Amelia proposal is a non-binding offer received
November 3, 2025 FDSO includes 17.5m common shares and 1.6m RSUs as of November 30, 2025, per Kona Management Net debt of $281m as of November 30, 2025 Inclusive of preferred equity redeemed at 1.8x minimum return inclusive of accumulated
PIK interest and value of 2.4m warrants Additional payment in the event of a change of control comprised of the remaining coupons to maturity and accrued interest on the $120m in backstop notes, as of December 31, 2025 3
PRELIMINARY, ILLUSTRATIVE DRAFT – FOR REFERENCE ONLY AND SUBJECT TO MATERIAL
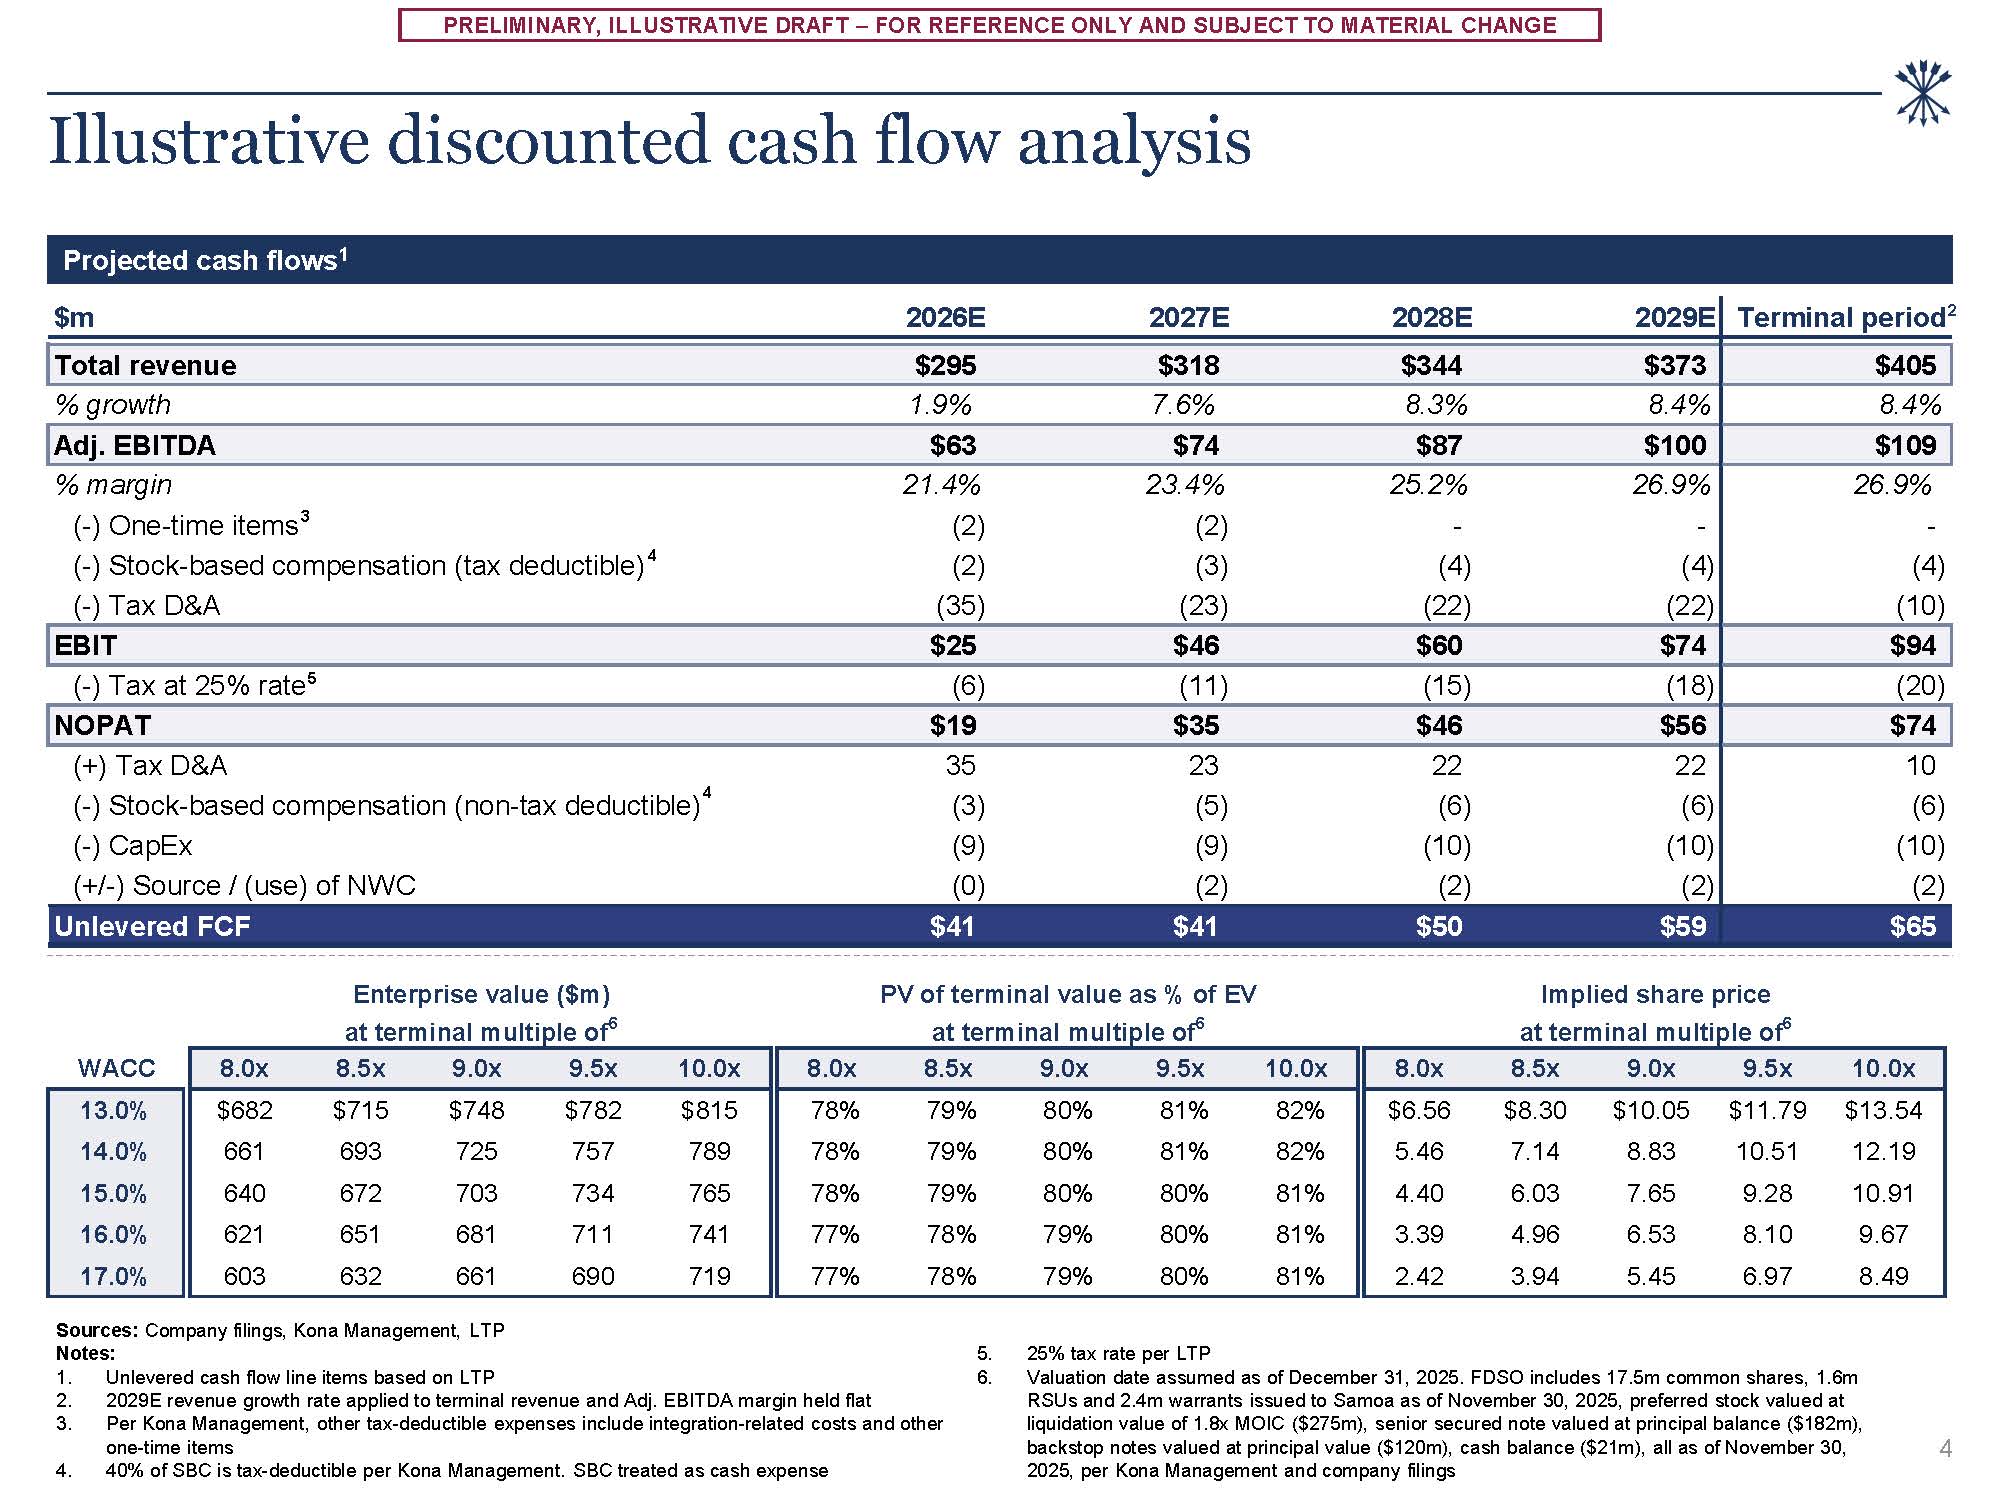
CHANGE Illustrative discounted cash flow analysis Projected cash flows1 Sources: Company filings, Kona Management, LTP Notes: Unlevered cash flow line items based on LTP 2029E revenue growth rate applied to terminal revenue and Adj.
EBITDA margin held flat Per Kona Management, other tax-deductible expenses include integration-related costs and other one-time items 40% of SBC is tax-deductible per Kona Management. SBC treated as cash expense 25% tax rate per
LTP Valuation date assumed as of December 31, 2025. FDSO includes 17.5m common shares, 1.6m RSUs and 2.4m warrants issued to Samoa as of November 30, 2025, preferred stock valued at liquidation value of 1.8x MOIC ($275m), senior secured note
valued at principal balance ($182m), backstop notes valued at principal value ($120m), cash balance ($21m), all as of November 30, 2025, per Kona Management and company filings Enterprise value ($m) at terminal multiple of6 PV of terminal
value as % of EV at terminal multiple of6 Implied share price at terminal multiple of6 4 $m 2026E 2027E 2028E 2029E Terminal period2 Total revenue $295 $318 $344 $373 $405 % growth 1.9% 7.6% 8.3% 8.4% 8.4% Adj. EBITDA $63 $74 $87 $100
$109 25.2% 26.9% 26.9% - - - % margin (-) One-time items3 (-) Stock-based compensation (tax deductible) 4 (-) Tax D&A 21.4% (2) (2) (35) 23.4% (2) (3) (23) (4) (22) (4) (22) (4) (10) EBIT $25 $46 $60 $74 $94 (-)
Tax at 25% rate5 (6) (11) (15) (18) (20) NOPAT $19 $35 $46 $56 $74 (+) Tax D&A (-) Stock-based compensation (non-tax deductible)4 (-) CapEx (+/-) Source / (use) of
NWC 35 (3) (9) (0) 23 (5) (9) (2) 22 (6) (10) (2) 22 (6) (10) (2) 10 (6) (10) (2) Unlevered
FCF $41 $41 $50 $59 $65 WACC 8.0x 8.5x 9.0x 9.5x 10.0x 8.0x 8.5x 9.0x 9.5x 10.0x 8.0x 8.5x 9.0x 9.5x 10.0x 13.0% $682 $715 $748 $782 $815 78% 79% 80% 81% 82% $6.56 $8.30 $10.05 $11.79 $13.54 14.0% 661 693 725 757 789 78% 79% 80% 81% 82% 5.46 7.14 8.83 10.51 12.19 15.0% 640 672 703 734 765 78% 79% 80% 80% 81% 4.40 6.03 7.65 9.28 10.91 16.0% 621 651 681 711 741 77% 78% 79% 80% 81% 3.39 4.96 6.53 8.10 9.67 17.0% 603 632 661 690 719 77% 78% 79% 80% 81% 2.42 3.94 5.45 6.97 8.49
PRELIMINARY, ILLUSTRATIVE DRAFT – FOR REFERENCE ONLY AND SUBJECT TO MATERIAL
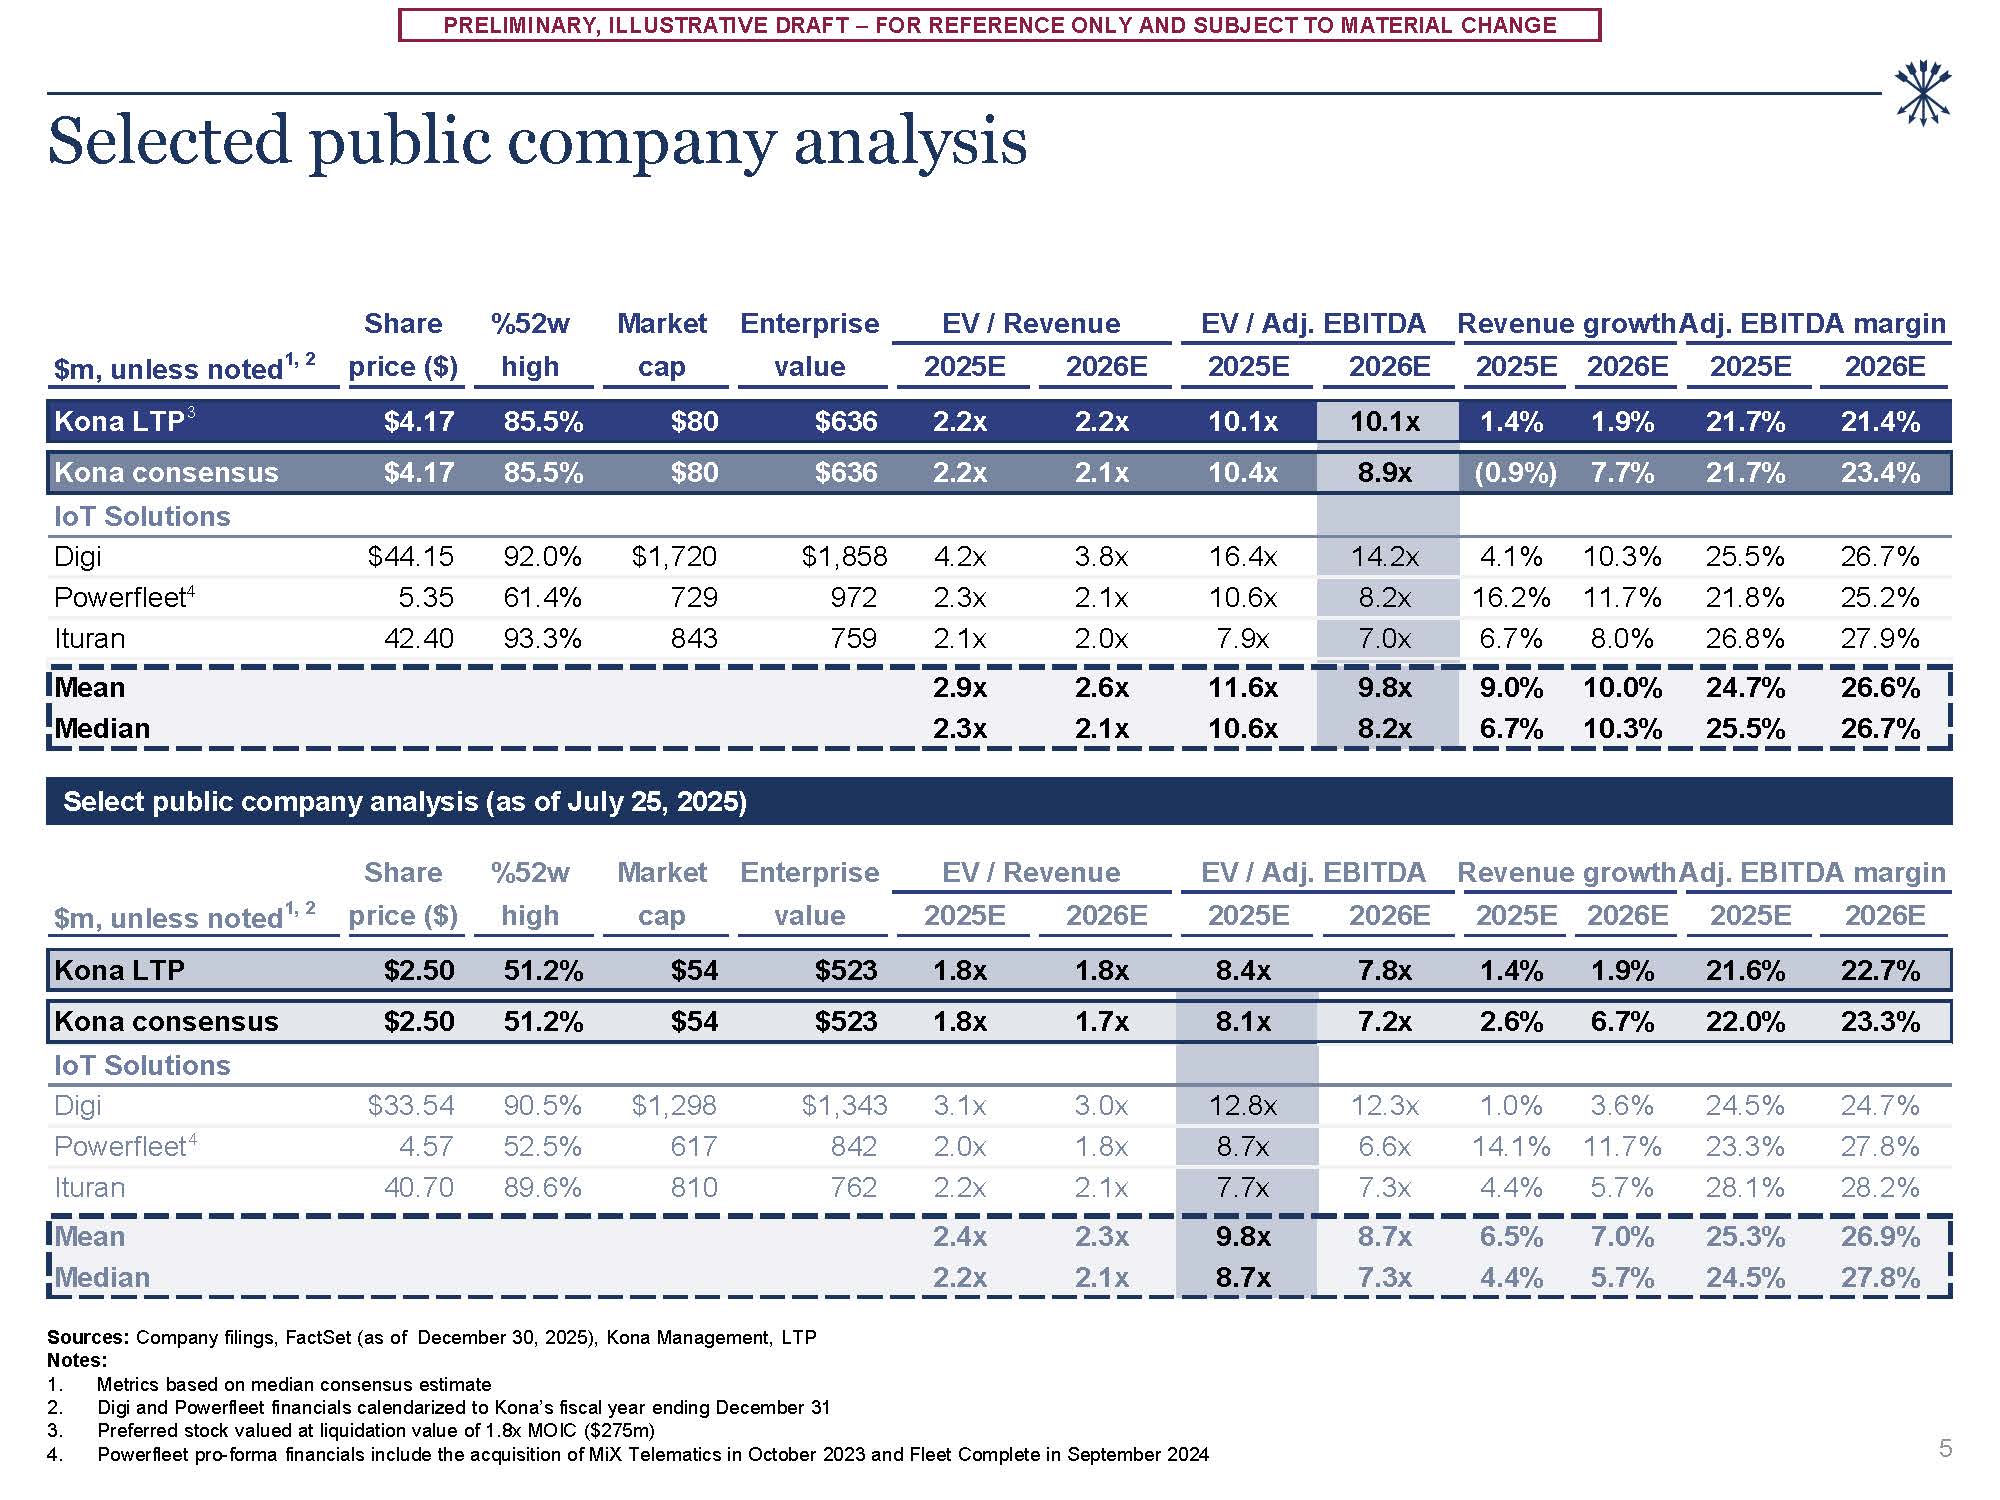
CHANGE Kona LTP $2.50 51.2% $54 $523 1.8x 1.8x 8.4x 7.8x 1.4% 1.9% 21.6% 22.7% Kona consensus $2.50 51.2% $54 $523 1.8x 1.7x 8.1x 7.2x 2.6% 6.7% 22.0% 23.3% IoT
Solutions Digi $33.54 90.5% $1,298 $1,343 3.1x 3.0x 12.8x 12.3x 1.0% 3.6% 24.5% 24.7% Powerfleet4 4.57 52.5% 617 842 2.0x 1.8x 8.7x 6.6x 14.1% 11.7% 23.3% 27.8% Ituran 40.70 89.6% 810 762 2.2x 2.1x 7.7x 7.3x 4.4% 5.7% 28.1% 28.2% Mean 2.4x 2.3x 9.8x 8.7x 6.5% 7.0% 25.3% 26.9% Median 2.2x 2.1x 8.7x 7.3x 4.4% 5.7% 24.5% 27.8% Share
price ($) %52w high Market cap Enterprise EV / Revenue EV / Adj. EBITDA Revenue growthAdj. EBITDA margin value 2025E 2026E 2025E 2026E 2025E 2026E 2025E 2026E $m, unless noted1, 2 Kona
LTP3 $4.17 85.5% $80 $636 2.2x 2.2x 10.1x 10.1x 1.4% 1.9% 21.7% 21.4% Kona consensus $4.17 85.5% $80 $636 2.2x 2.1x 10.4x 8.9x (0.9%) 7.7% 21.7% 23.4% IoT
Solutions Digi $44.15 92.0% $1,720 $1,858 4.2x 3.8x 16.4x 14.2x 4.1% 10.3% 25.5% 26.7% Powerfleet4 5.35 61.4% 729 972 2.3x 2.1x 10.6x 8.2x 16.2% 11.7% 21.8% 25.2% Ituran 42.40 93.3% 843 759 2.1x 2.0x 7.9x 7.0x 6.7% 8.0% 26.8% 27.9% Mean 2.9x 2.6x 11.6x 9.8x 9.0% 10.0% 24.7% 26.6% Median 2.3x 2.1x 10.6x 8.2x 6.7% 10.3% 25.5% 26.7% Share
price ($) %52w high Market cap Enterprise value EV / Revenue 2025E 2026E EV / Adj. EBITDA 2025E 2026E Revenue growthAdj. EBITDA margin 2025E 2026E 2025E 2026E $m, unless noted1, 2 Select public company analysis (as of July 25,
2025) Selected public company analysis Sources: Company filings, FactSet (as of December 30, 2025), Kona Management, LTP Notes: Metrics based on median consensus estimate Digi and Powerfleet financials calendarized to Kona’s fiscal year
ending December 31 Preferred stock valued at liquidation value of 1.8x MOIC ($275m) Powerfleet pro-forma financials include the acquisition of MiX Telematics in October 2023 and Fleet Complete in September 2024 5
PRELIMINARY, ILLUSTRATIVE DRAFT – FOR REFERENCE ONLY AND SUBJECT TO MATERIAL
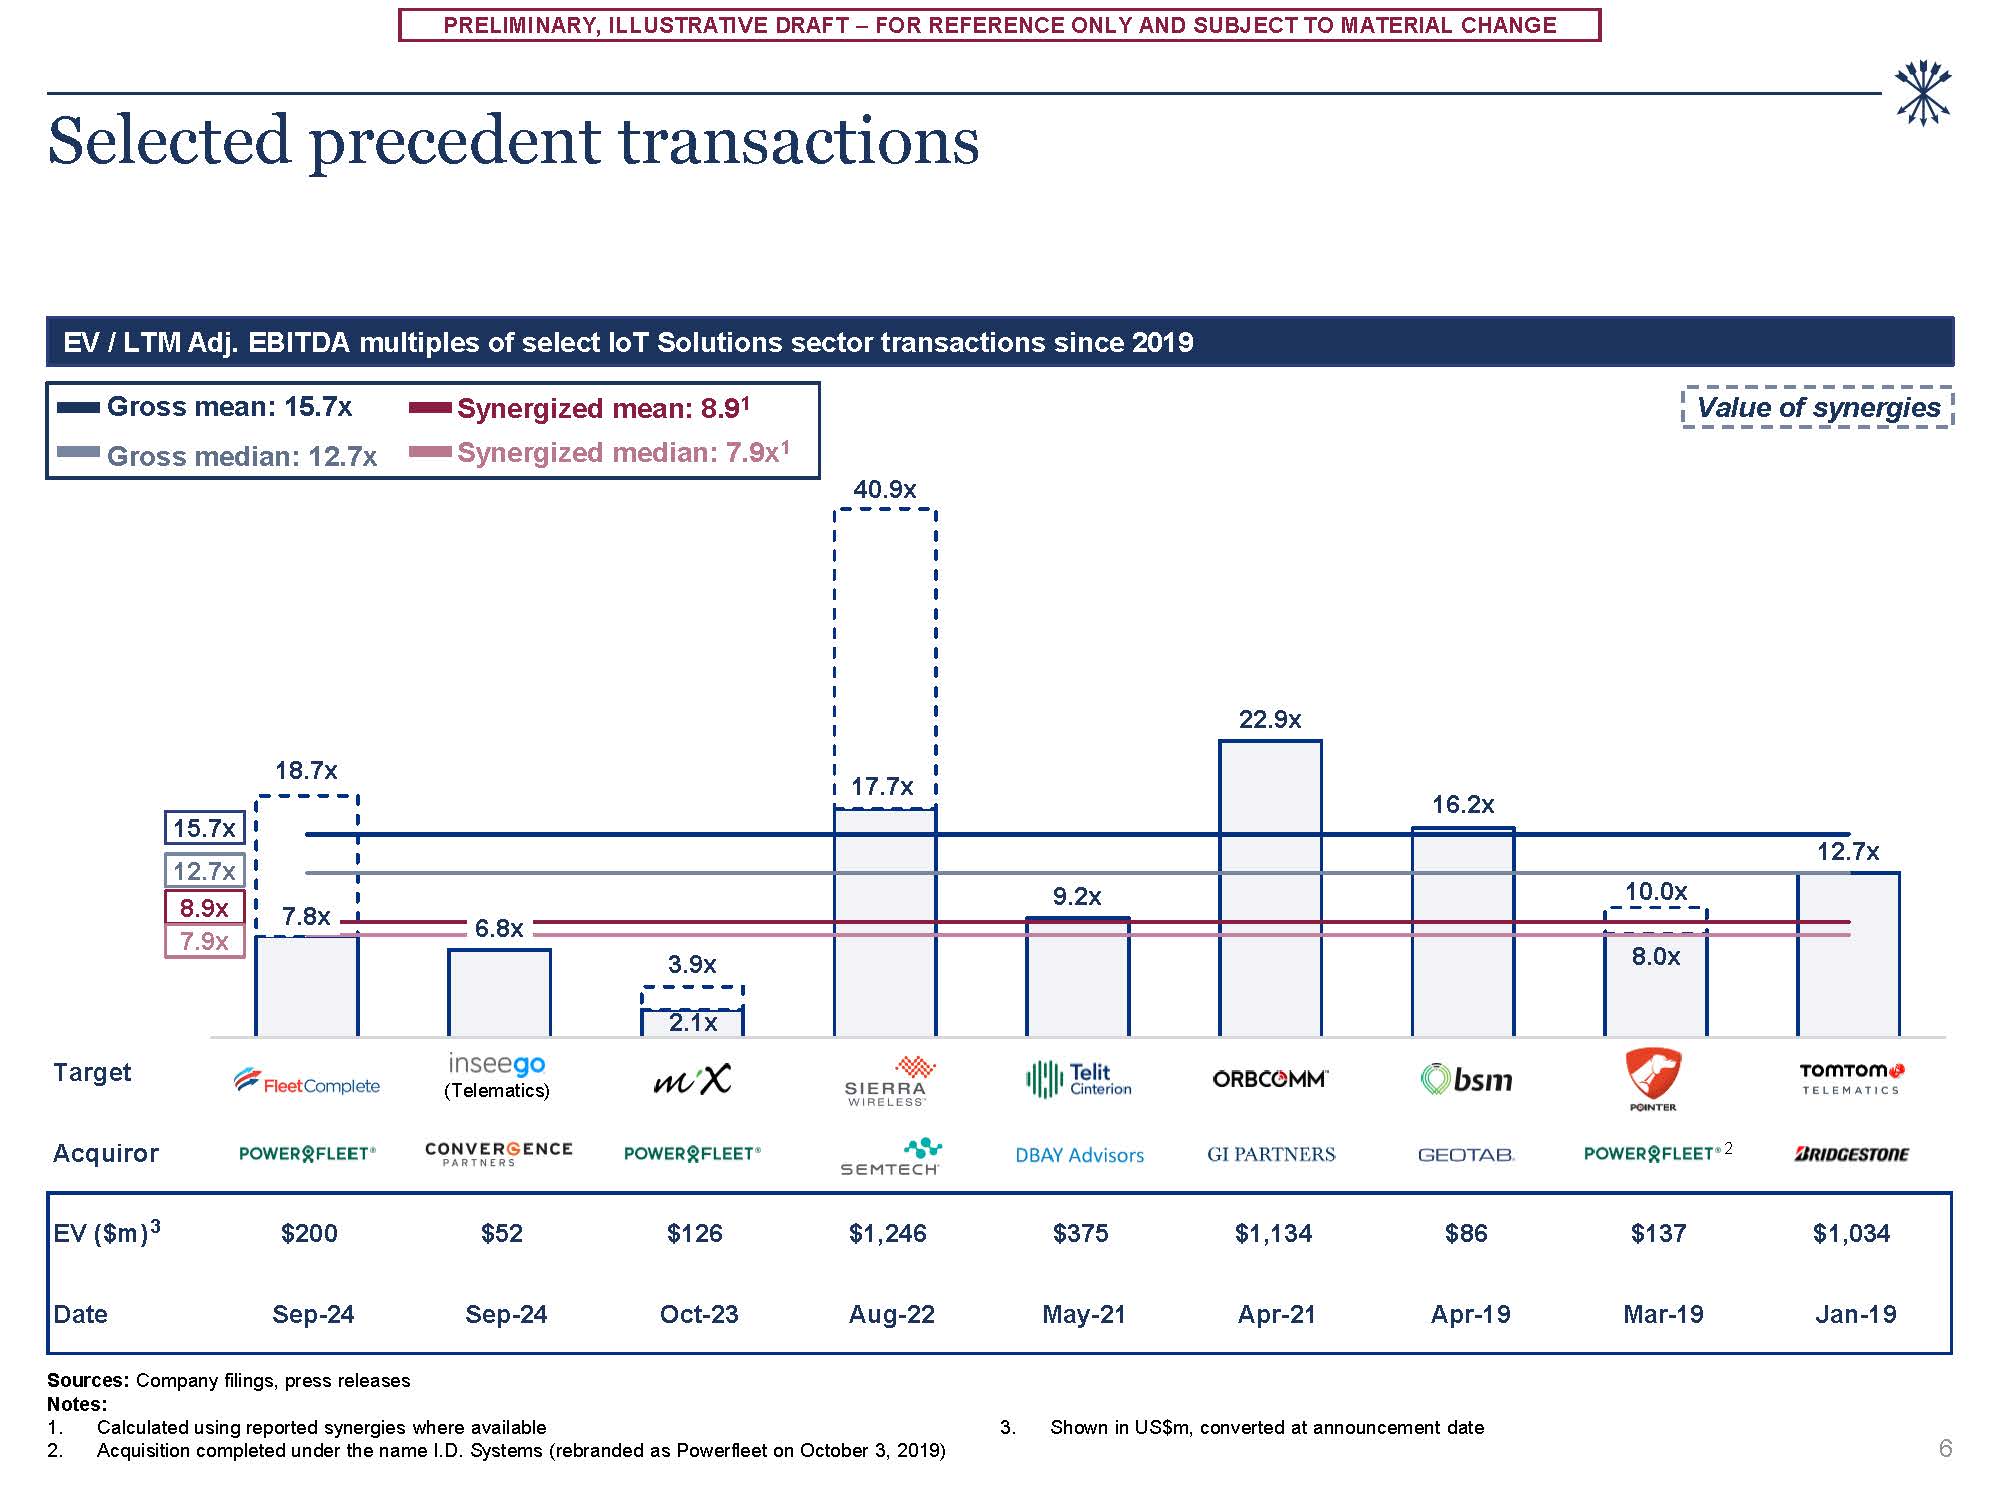
CHANGE Target Acquiror EV
($m)3 $200 $52 $126 $1,246 $375 $1,134 $86 $137 $1,034 Date Sep-24 Sep-24 Oct-23 Aug-22 May-21 Apr-21 Apr-19 Mar-19 Jan-19 7.8x 2.1x 17.7x 8.0x 18.7x 6.8x 3.9x 40.9x 9.2x 22.9x 16.2x 10.0x 12.7x Selected
precedent transactions Sources: Company filings, press releases Notes: Calculated using reported synergies where available Acquisition completed under the name I.D. Systems (rebranded as Powerfleet on October 3, 2019) 3. Shown in US$m,
converted at announcement date EV / LTM Adj. EBITDA multiples of select IoT Solutions sector transactions since 2019 (Telematics) 2 Value of synergies 15.7x 12.7x 8.9x 7.9x Gross mean: 15.7x Gross median: 12.7x Synergized mean: 8.91
Synergized median: 7.9x1 6
PRELIMINARY, ILLUSTRATIVE DRAFT – FOR REFERENCE ONLY AND SUBJECT TO MATERIAL
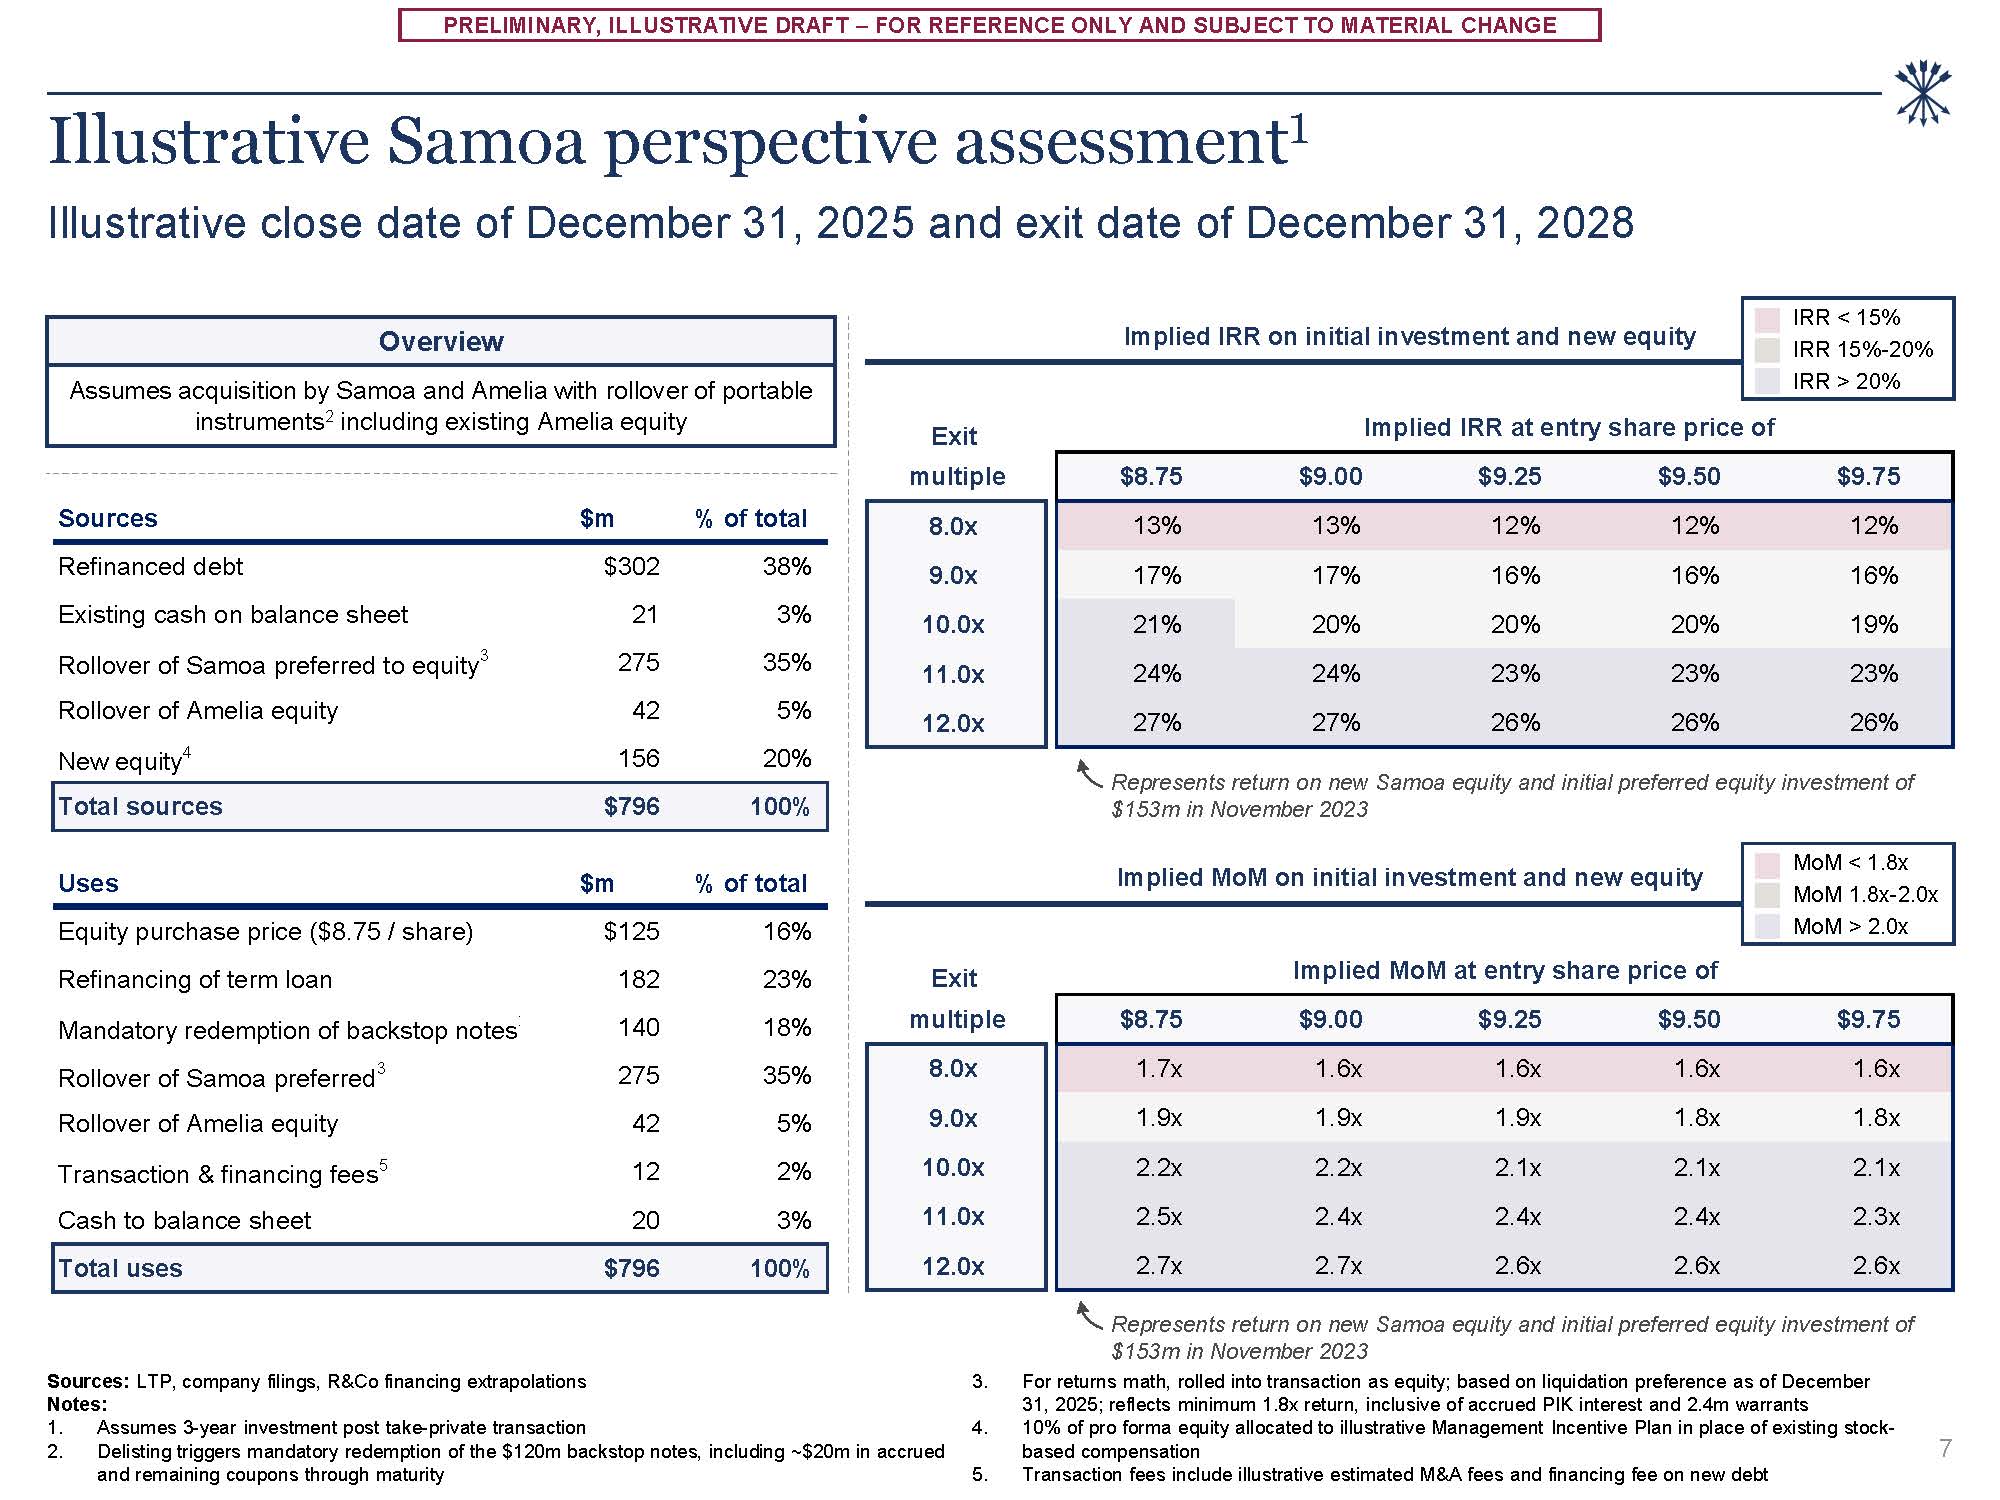
CHANGE Illustrative Samoa perspective assessment1 Illustrative close date of December 31, 2025 and exit date of December 31, 2028 Sources: LTP, company filings, R&Co financing extrapolations Notes: Assumes 3-year investment post
take-private transaction Delisting triggers mandatory redemption of the $120m backstop notes, including ~$20m in accrued and remaining coupons through maturity Assumes acquisition by Samoa and Amelia with rollover of portable instruments2
including existing Amelia equity Overview Implied IRR on initial investment and new equity Implied MoM on initial investment and new equity Represents return on new Samoa equity and initial preferred equity investment of $153m in November
2023 Represents return on new Samoa equity and initial preferred equity investment of $153m in November 2023 For returns math, rolled into transaction as equity; based on liquidation preference as of December 31, 2025; reflects minimum 1.8x
return, inclusive of accrued PIK interest and 2.4m warrants 10% of pro forma equity allocated to illustrative Management Incentive Plan in place of existing stock-based compensation Transaction fees include illustrative estimated M&A fees
and financing fee on new debt 7 Exit Implied IRR at entry share price
of multiple $8.75 $9.00 $9.25 $9.50 $9.75 8.0x 13% 13% 12% 12% 12% 9.0x 17% 17% 16% 16% 16% 10.0x 21% 20% 20% 20% 19% 11.0x 24% 24% 23% 23% 23% 12.0x 27% 27% 26% 26% 26% Exit Implied MoM at entry share
price
of multiple $8.75 $9.00 $9.25 $9.50 $9.75 8.0x 1.7x 1.6x 1.6x 1.6x 1.6x 9.0x 1.9x 1.9x 1.9x 1.8x 1.8x 10.0x 2.2x 2.2x 2.1x 2.1x 2.1x 11.0x 2.5x 2.4x 2.4x 2.4x 2.3x 12.0x 2.7x 2.7x 2.6x 2.6x 2.6x Sources $m %
of total Refinanced debt $302 38% Existing cash on balance sheet 21 3% Rollover of Samoa preferred to equity3 275 35% Rollover of Amelia equity 42 5% New equity4 156 20% Total sources $796 100% Uses $m % of total Equity
purchase price ($8.75 / share) $125 16% Refinancing of term loan 182 23% Mandatory redemption of backstop notes 140 18% Rollover of Samoa preferred3 275 35% Rollover of Amelia equity 42 5% Transaction & financing
fees5 12 2% Cash to balance sheet 20 3% Total uses $796 100% IRR < 15% IRR 15%-20% IRR > 20% MoM < 1.8x MoM 1.8x-2.0x MoM > 2.0x