Project Kona Special Committee materials July 29, 2025 DRAFT All numbers and
references herein are highly preliminary and subject to material refinement Exhibit (c)(iii)
PRELIMINARY, ILLUSTRATIVE DRAFT – FOR REFERENCE ONLY AND SUBJECT TO MATERIAL
CHANGE Disclaimer 1. Section name This presentation was prepared by Rothschild & Co US Inc. (“Rothschild & Co”) on a confidential basis for the benefit and internal use of the Special Committee (the “Special Committee”) of the Board
of Directors of KORE Group Holdings, Inc. (the “Company” or “Kona”) in the context of the Special Committee’s consideration of the matters described herein. In creating this presentation, Rothschild & Co has relied upon information that is
publicly available or which was provided to Rothschild & Co by or on behalf of the Company’s management, including, without limitation, management operating and financial forecasts or projections. Such information involves numerous
significant assumptions and subjective determinations that may or may not be correct. Rothschild & Co has not assumed any responsibility for independent verification of any of such information contained herein, including, but not limited
to, any forecasts or projections set forth herein, and Rothschild & Co has relied on such information being complete and accurate in all material respects. Accordingly, no representation or warranty, express or implied, can be made or is
made by Rothschild & Co as to the accuracy or completeness of any such information or the achievability of any such forecasts or projections. Except where otherwise indicated, this presentation speaks as of the date hereof and is
necessarily based upon the information available to Rothschild & Co and financial, stock market and other conditions and circumstances existing and disclosed to Rothschild & Co as of the date hereof, all of which are subject to change.
Rothschild & Co does not have any obligation to update, bring-down, review or reaffirm this presentation. Under no circumstances should the delivery of this presentation imply that any information or analyses included in this presentation
would be the same if made as of any other date. Nothing contained in this presentation is, or shall be relied upon as, a promise or representation as to the past, present or future. Nothing contained herein shall be deemed to be a
recommendation from Rothschild & Co to any party, including without limitation, any security holder of the Company, to enter into any transaction or to take any course of action. By accepting these materials, the Special Committee
acknowledges that Rothschild & Co is not in the business of providing (and the Special Committee is not relying on Rothschild & Co for) legal, tax or accounting advice, and the Special Committee should receive (and rely on) separate and
qualified legal, tax and accounting advice. These materials do not constitute an offer or solicitation to sell or purchase any securities. Rothschild & Co is not acting in any capacity as a fiduciary or agent of the Special Committee, the
Board of Directors of the Company, the Company or the Company’s security holders. In the ordinary course of their asset management, merchant banking and other business activities, affiliates of Rothschild & Co may at any time hold long or
short positions, and may trade or otherwise effect transactions, for their own accounts or the accounts of their clients in equity, debt or other securities (or related derivative securities) or financial instruments of the Company or any of
its affiliates or any other company that may be involved in any transaction. This presentation is confidential and was not prepared with a view to public disclosure or filing thereof under state or federal securities laws or otherwise. This
presentation may not be copied by, or disclosed or made available to, any person without the prior written consent of Rothschild & Co. This presentation was not prepared for use by readers not as familiar with the business and affairs of
the Company as the Special Committee, and accordingly, Rothschild & Co does not take any responsibility for the accuracy or completeness of any material if used by persons other than the Special Committee. Rothschild & Co shall not
have any liability, whether direct or indirect, in contract or tort or otherwise, to any person in connection with this presentation. 2
PRELIMINARY, ILLUSTRATIVE DRAFT – FOR REFERENCE ONLY AND SUBJECT TO MATERIAL
CHANGE Contents Situation overview Management LTP Preliminary valuation perspectives Appendices 4 9 12 22

1 Situation overview
PRELIMINARY, ILLUSTRATIVE DRAFT – FOR REFERENCE ONLY AND SUBJECT TO MATERIAL
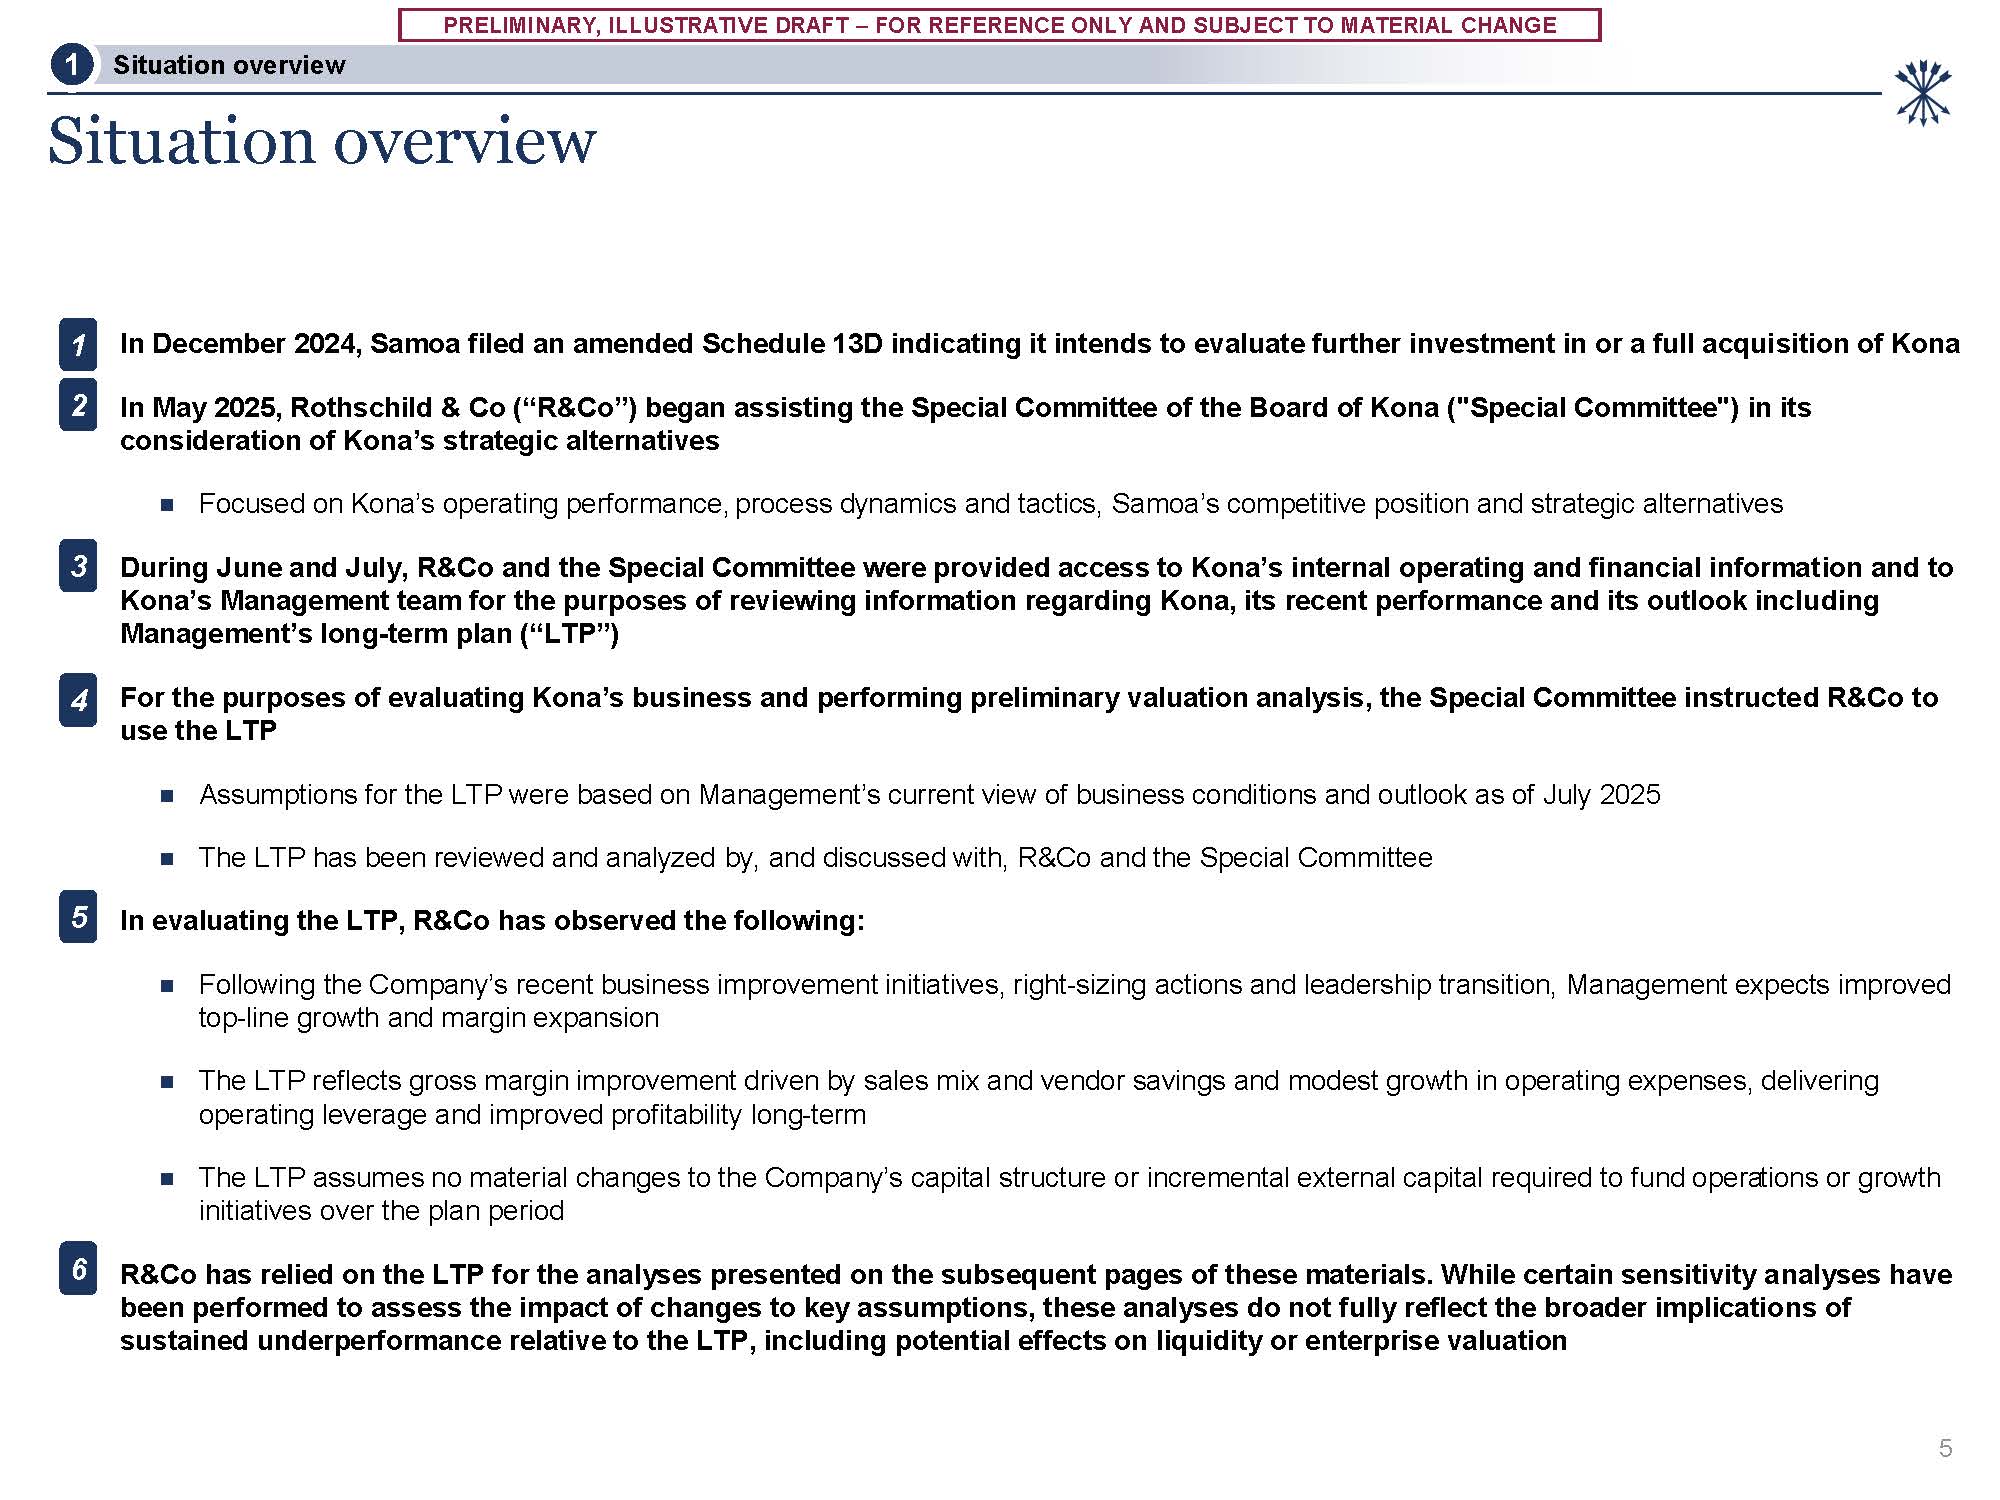
CHANGE Situation overview In December 2024, Samoa filed an amended Schedule 13D indicating it intends to evaluate further investment in or a full acquisition of Kona In May 2025, Rothschild & Co (“R&Co”) began assisting the Special
Committee of the Board of Kona ("Special Committee") in its consideration of Kona’s strategic alternatives For the purposes of evaluating Kona’s business and performing preliminary valuation analysis, the Special Committee instructed R&Co
to use the LTP R&Co has relied on the LTP for the analyses presented on the subsequent pages of these materials. While certain sensitivity analyses have been performed to assess the impact of changes to key assumptions, these analyses do
not fully reflect the broader implications of sustained underperformance relative to the LTP, including potential effects on liquidity or enterprise valuation Focused on Kona’s operating performance, process dynamics and tactics, Samoa’s
competitive position and strategic alternatives 3 During June and July, R&Co and the Special Committee were provided access to Kona’s internal operating and financial information and to Kona’s Management team for the purposes of reviewing
information regarding Kona, its recent performance and its outlook including Management’s long-term plan (“LTP”) 1 2 6 Assumptions for the LTP were based on Management’s current view of business conditions and outlook as of July 2025 The
LTP has been reviewed and analyzed by, and discussed with, R&Co and the Special Committee 5 In evaluating the LTP, R&Co has observed the following: Following the Company’s recent business improvement initiatives, right-sizing actions
and leadership transition, Management expects improved top-line growth and margin expansion The LTP reflects gross margin improvement driven by sales mix and vendor savings and modest growth in operating expenses, delivering operating leverage
and improved profitability long-term The LTP assumes no material changes to the Company’s capital structure or incremental external capital required to fund operations or growth initiatives over the plan period Situation overview 1 4 5
PRELIMINARY, ILLUSTRATIVE DRAFT – FOR REFERENCE ONLY AND SUBJECT TO MATERIAL
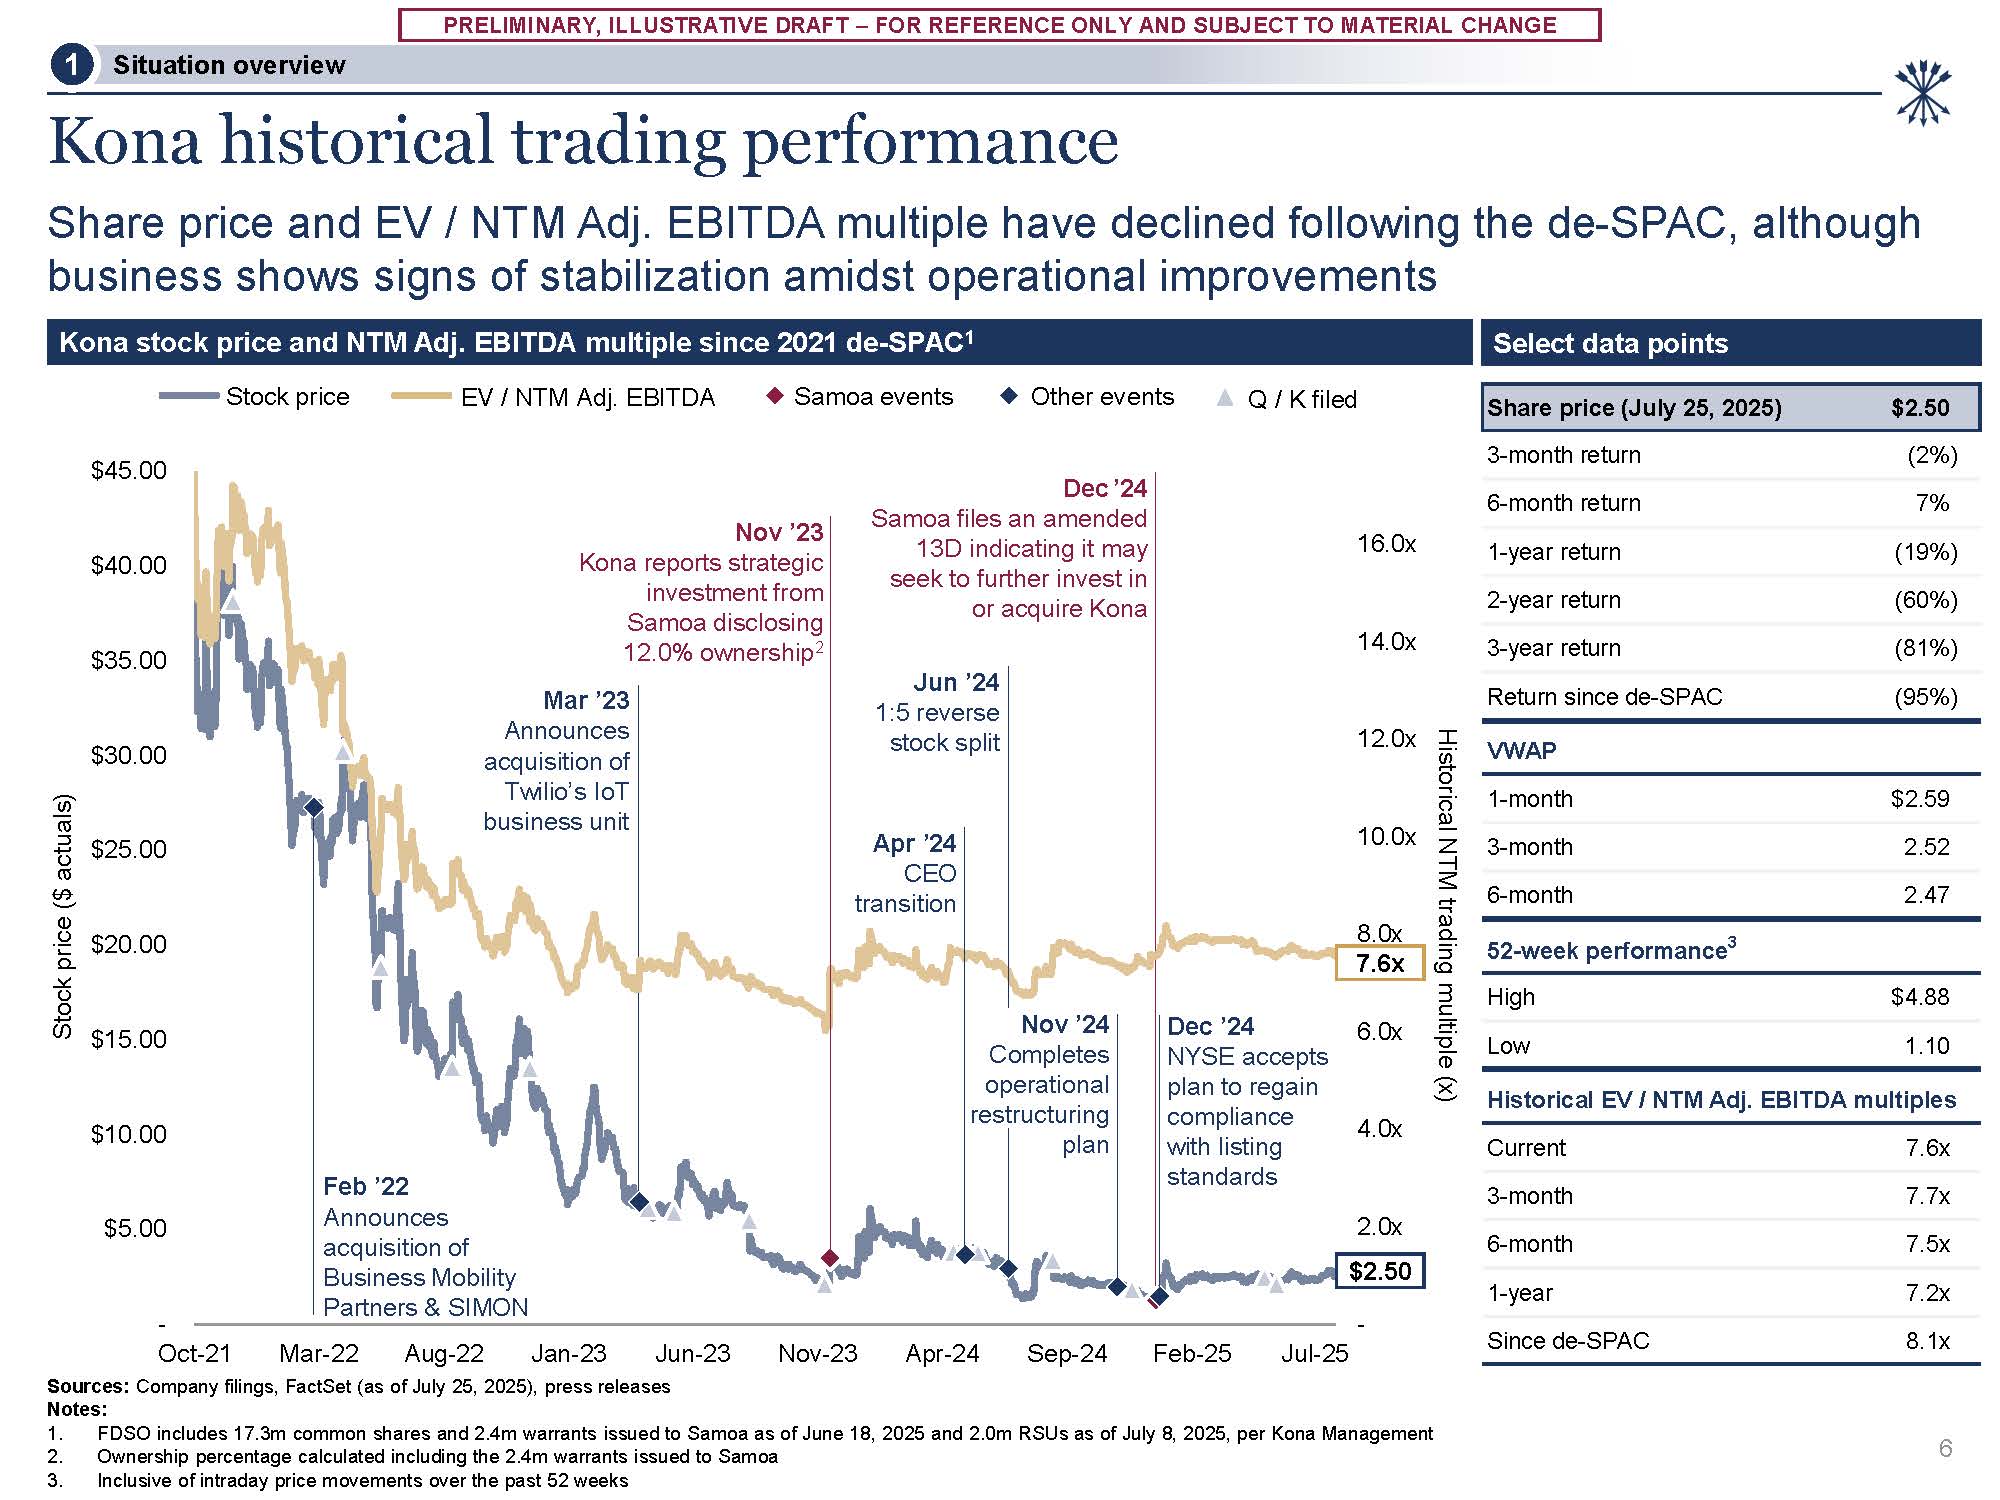
CHANGE Dec ’24 Samoa files an amended 13D indicating it may seek to further invest in or acquire Kona Mar ’23 Announces acquisition of Twilio’s IoT business
unit - 2.0x 4.0x 6.0x 8.0x 10.0x 12.0x - $5.00 $10.00 $15.00 $20.00 $25.00 $30.00 $35.00 $40.00 $45.00 Oct-21 Mar-22 Aug-22 Jan-23 Jun-23 Nov-23 Apr-24 Sep-24 Feb-25 Jul-25 Jun ’24 1:5 reverse stock split Nov ’24 Completes
operational restructuring plan Dec ’24 NYSE accepts plan to regain compliance with listing standards Nov ’23 Kona reports strategic investment from Samoa disclosing 12.0% ownership2 Apr ’24 CEO transition Feb ’22 Announces acquisition
of Business Mobility Partners & SIMON Kona historical trading performance Share price and EV / NTM Adj. EBITDA multiple have declined following the de-SPAC, although business shows signs of stabilization amidst operational
improvements Sources: Company filings, FactSet (as of July 25, 2025), press releases Notes: FDSO includes 17.3m common shares and 2.4m warrants issued to Samoa as of June 18, 2025 and 2.0m RSUs as of July 8, 2025, per Kona
Management Ownership percentage calculated including the 2.4m warrants issued to Samoa Inclusive of intraday price movements over the past 52 weeks Stock price ($ actuals) Historical NTM trading multiple (x) Kona stock price and NTM Adj.
EBITDA multiple since 2021 de-SPAC1 Select data points Stock price EV / NTM Adj. EBITDA Samoa events Other events Q / K file d Share price (July 25, 2025) $2.50 3-month return (2%) 6-month return 7% 16.0x 1-year return (19%) 2-year
return (60%) 14.0x 3-year return (81%) Return since de-SPAC (95%) Situation overview 1 $2.50 6 7.6x VWAP 1-month $2.59 3-month 2.52 6-month 2.47 52-week performance3 High $4.88 Low 1.10 Historical EV / NTM Adj. EBITDA
multiples Current 7.6x 3-month 7.7x 6-month 7.5x 1-year 7.2x Since de-SPAC 8.1x
PRELIMINARY, ILLUSTRATIVE DRAFT – FOR REFERENCE ONLY AND SUBJECT TO MATERIAL
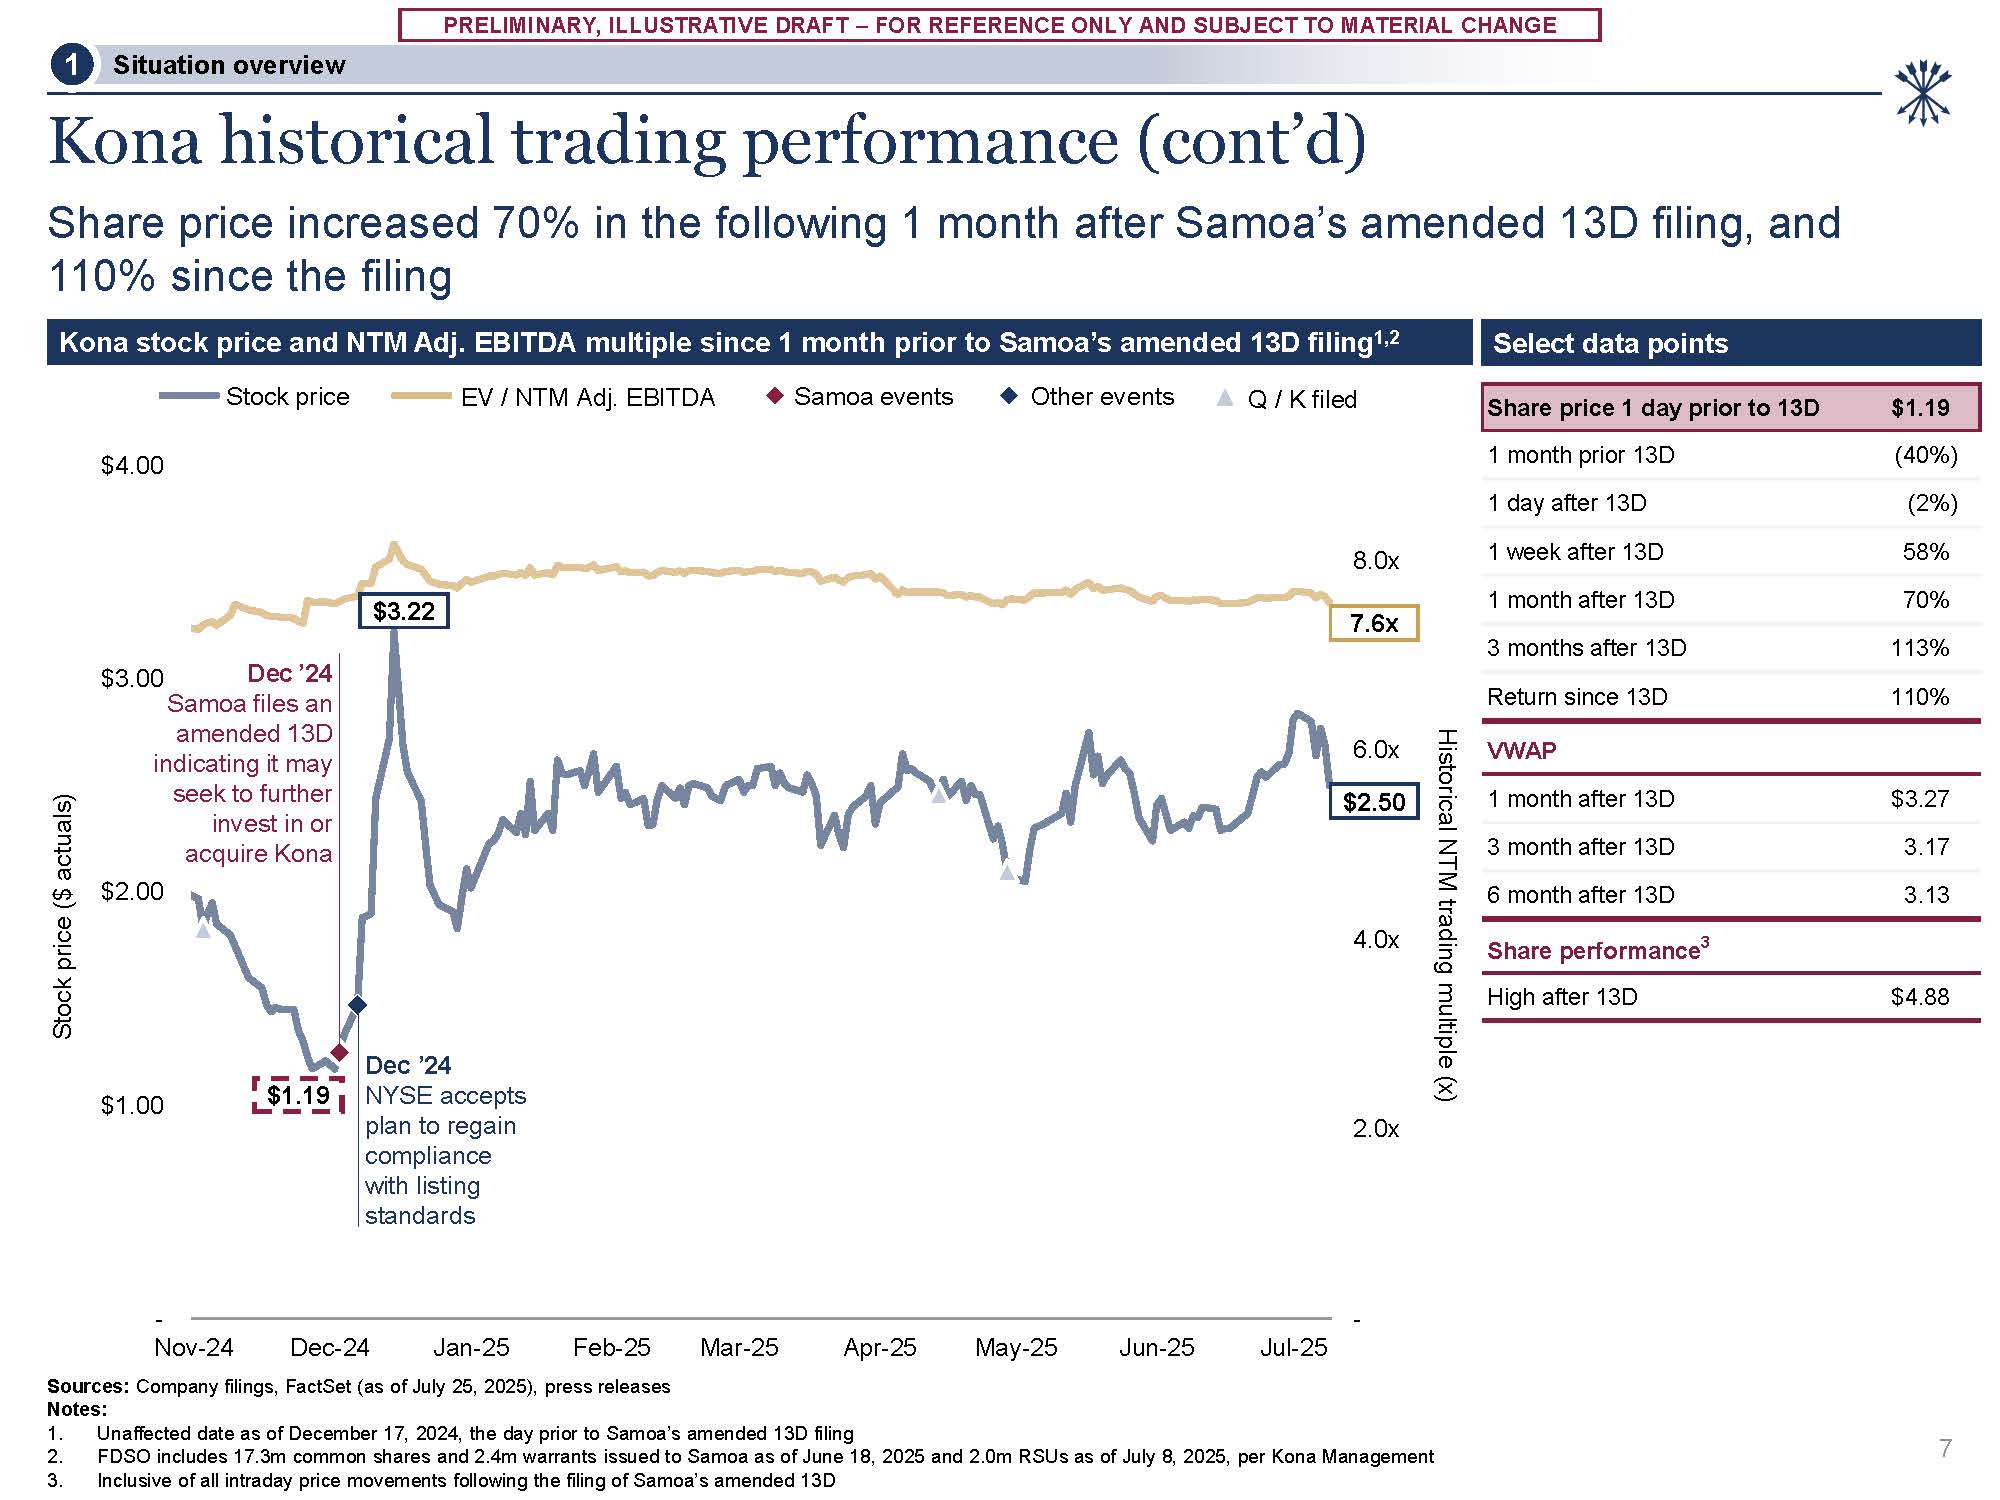
CHANGE - 2.0x 4.0x 6.0x 8.0x - Nov-24 Dec-24 Jan-25 Feb-25 Mar-25 Sources: Company filings, FactSet (as of July 25, 2025), press releases Notes: $1.00 $3.00 $4.00 Apr-25 May-25 Jun-25 Jul-25 Kona historical trading performance
(cont’d) Share price increased 70% in the following 1 month after Samoa’s amended 13D filing, and 110% since the filing 7.6x $1.19 Situation overview 1 7 $2.50 $3.22 Dec ’24 Samoa files an amended 13D indicating it may seek to
further invest in or acquire Kona $2.00 Stock price ($ actuals) Historical NTM trading multiple (x) Dec ’24 NYSE accepts plan to regain compliance with listing standards Unaffected date as of December 17, 2024, the day prior to Samoa’s
amended 13D filing FDSO includes 17.3m common shares and 2.4m warrants issued to Samoa as of June 18, 2025 and 2.0m RSUs as of July 8, 2025, per Kona Management Inclusive of all intraday price movements following the filing of Samoa’s amended
13D Kona stock price and NTM Adj. EBITDA multiple since 1 month prior to Samoa’s amended 13D filing1,2 Select data points Stock price EV / NTM Adj. EBITDA Samoa events Other events Q / K filed Share price 1 day prior to 13D $1.19 1 month
prior 13D (40%) 1 day after 13D (2%) 1 week after 13D 58% 1 month after 13D 70% 3 months after 13D 113% Return since 13D 110% VWAP 1 month after 13D $3.27 3 month after 13D 3.17 6 month after 13D 3.13 Share performance3 High
after 13D $4.88
PRELIMINARY, ILLUSTRATIVE DRAFT – FOR REFERENCE ONLY AND SUBJECT TO MATERIAL
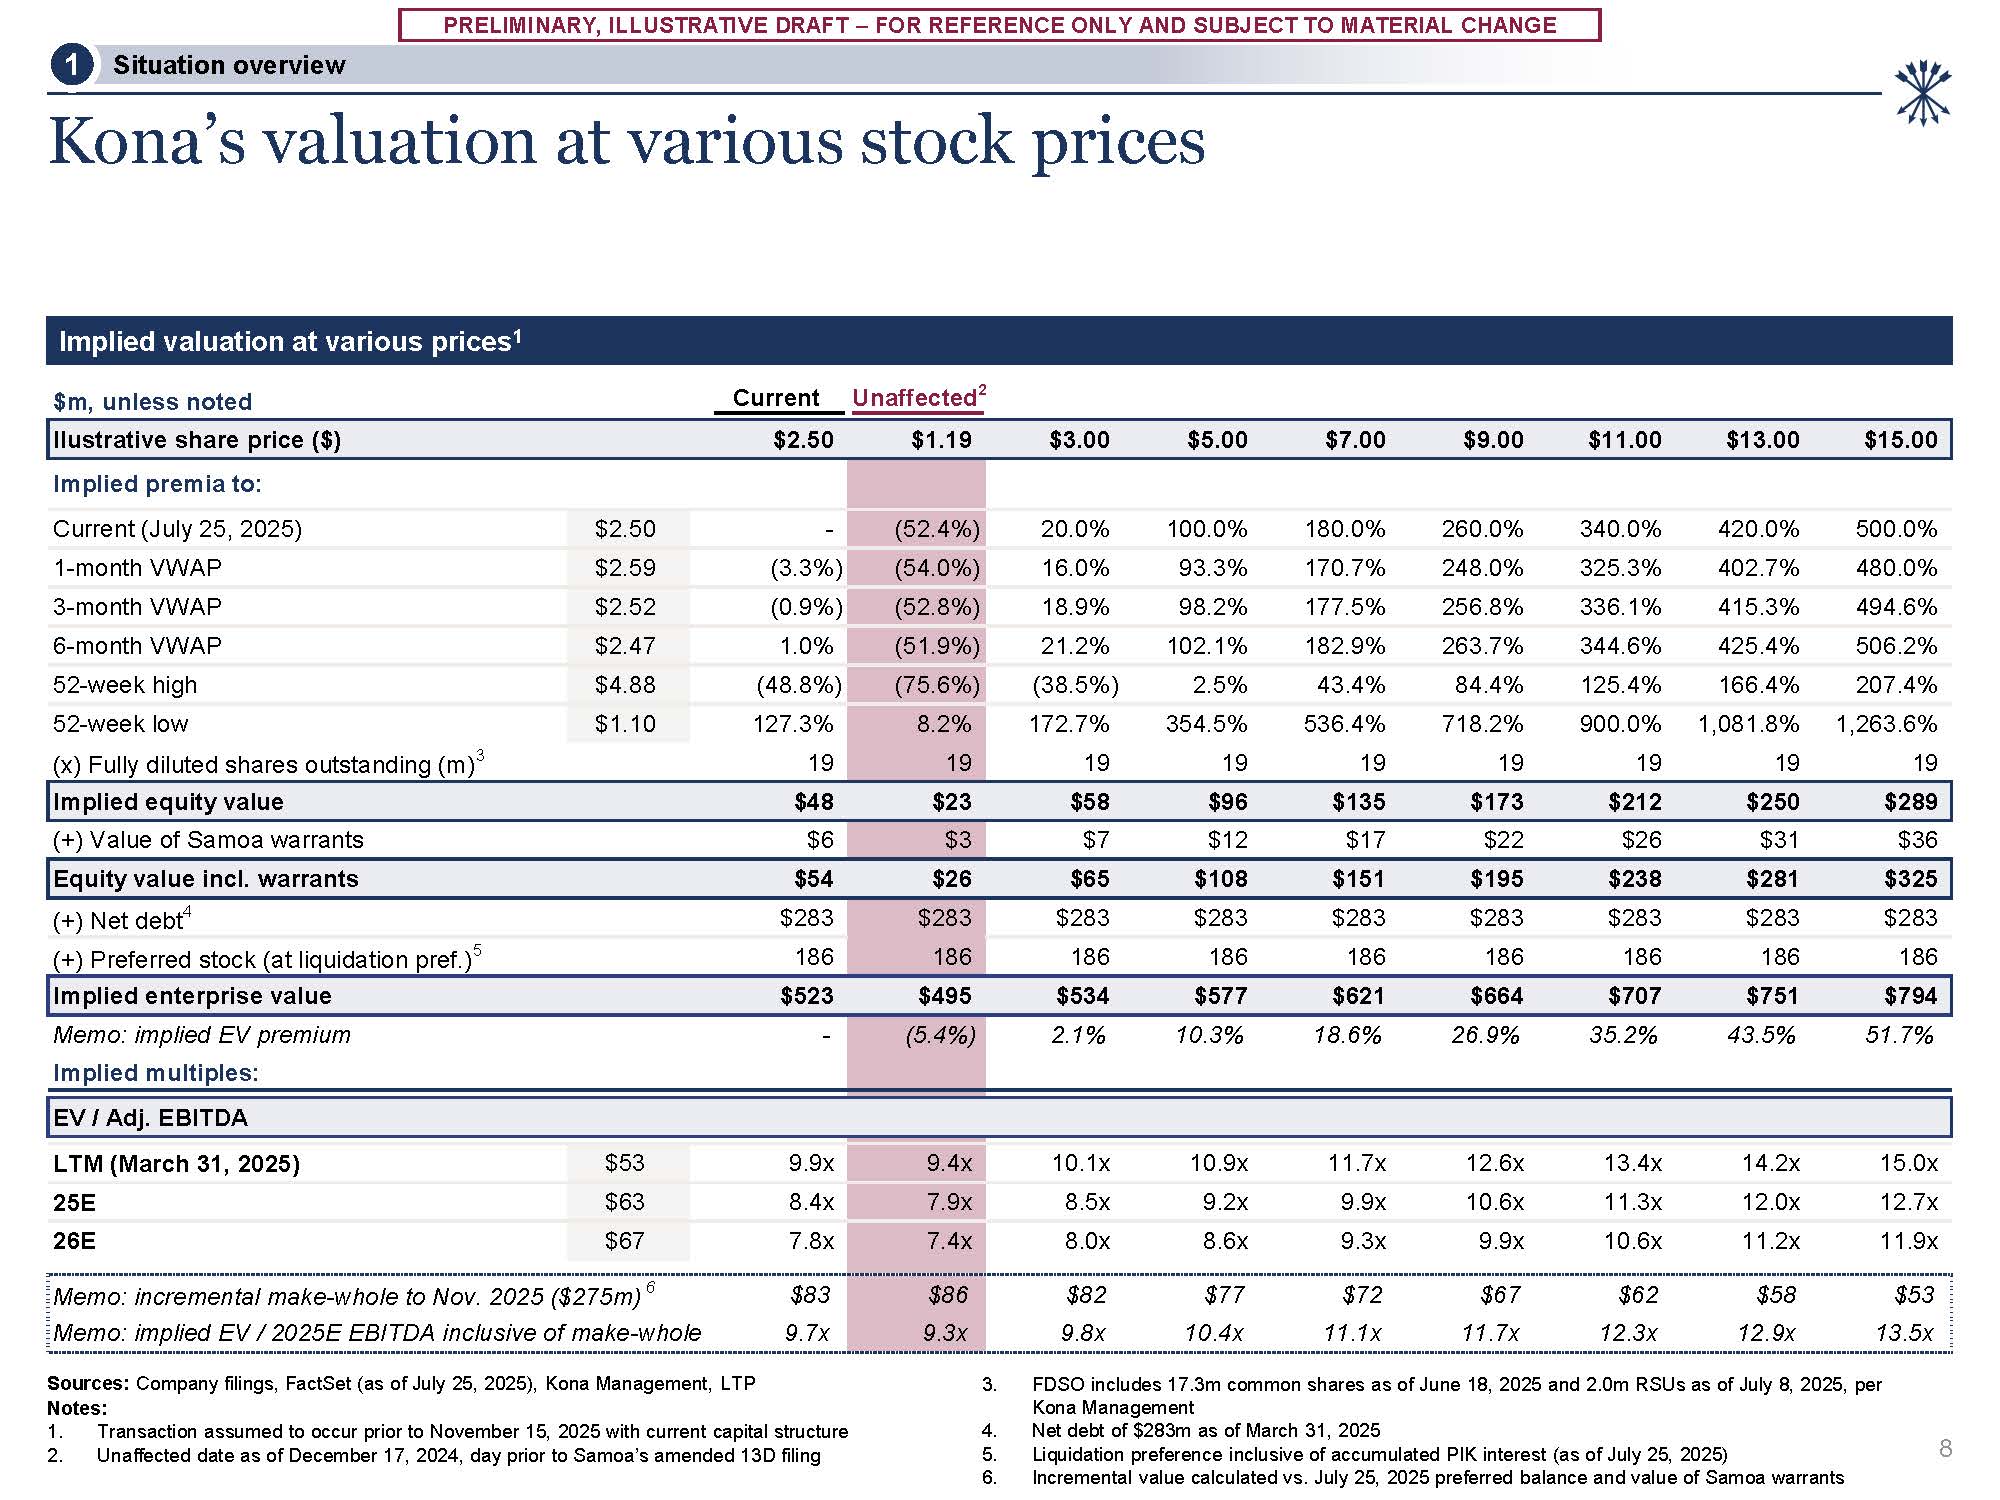
CHANGE Ilustrative share price ($) $2.50 $1.19 $3.00 $5.00 $7.00 $9.00 $11.00 $13.00 $15.00 Implied premia to: Current (July 25, 2025) $2.50 - (52.4%) 20.0% 100.0% 180.0% 260.0% 340.0% 420.0% 500.0% 1-month VWAP
$2.59 (3.3%) (54.0%) 16.0% 93.3% 170.7% 248.0% 325.3% 402.7% 480.0% 3-month VWAP $2.52 (0.9%) (52.8%) 18.9% 98.2% 177.5% 256.8% 336.1% 415.3% 494.6% 6-month VWAP
$2.47 1.0% (51.9%) 21.2% 102.1% 182.9% 263.7% 344.6% 425.4% 506.2% 52-week high $4.88 (48.8%) (75.6%) (38.5%) 2.5% 43.4% 84.4% 125.4% 166.4% 207.4% 52-week low
$1.10 127.3% 8.2% 172.7% 354.5% 536.4% 718.2% 900.0% 1,081.8% 1,263.6% (x) Fully diluted shares outstanding (m)3 19 19 19 19 19 19 19 19 19 Implied equity value $48 $23 $58 $96 $135 $173 $212 $250 $289 (+) Value of
Samoa warrants $6 $3 $7 $12 $17 $22 $26 $31 $36 Equity value incl. warrants $54 $26 $65 $108 $151 $195 $238 $281 $325 (+) Net debt4 $283 $283 $283 $283 $283 $283 $283 $283 $283 (+) Preferred stock (at liquidation
pref.)5 186 186 186 186 186 186 186 186 186 Implied enterprise value $523 $495 $534 $577 $621 $664 $707 $751 $794 Memo: implied EV premium Implied multiples: - (5.4%) 2.1% 10.3% 18.6% 26.9% 35.2% 43.5% 51.7% EV /
Adj. EBITDA LTM (March 31, 2025) $53 9.9x 9.4x 10.1x 10.9x 11.7x 12.6x 13.4x 14.2x 15.0x 25E $63 8.4x 7.9x 8.5x 9.2x 9.9x 10.6x 11.3x 12.0x 12.7x 26E $67 7.8x 7.4x 8.0x 8.6x 9.3x 9.9x 10.6x 11.2x 11.9x Memo:
incremental make-whole to Nov. 2025 ($275m) 6 $83 $86 $82 $77 $72 $67 $62 $58 $53 Memo: implied EV / 2025E EBITDA inclusive of make-whole 9.7x 9.3x 9.8x 10.4x 11.1x 11.7x 12.3x 12.9x 13.5x $m, unless noted Current
Unaffected2 Kona’s valuation at various stock prices Sources: Company filings, FactSet (as of July 25, 2025), Kona Management, LTP Notes: Transaction assumed to occur prior to November 15, 2025 with current capital structure Unaffected
date as of December 17, 2024, day prior to Samoa’s amended 13D filing FDSO includes 17.3m common shares as of June 18, 2025 and 2.0m RSUs as of July 8, 2025, per Kona Management Net debt of $283m as of March 31, 2025 Liquidation preference
inclusive of accumulated PIK interest (as of July 25, 2025) Incremental value calculated vs. July 25, 2025 preferred balance and value of Samoa warrants Implied valuation at various prices1 8 Situation overview 41

2 Management LTP
PRELIMINARY, ILLUSTRATIVE DRAFT – FOR REFERENCE ONLY AND SUBJECT TO MATERIAL
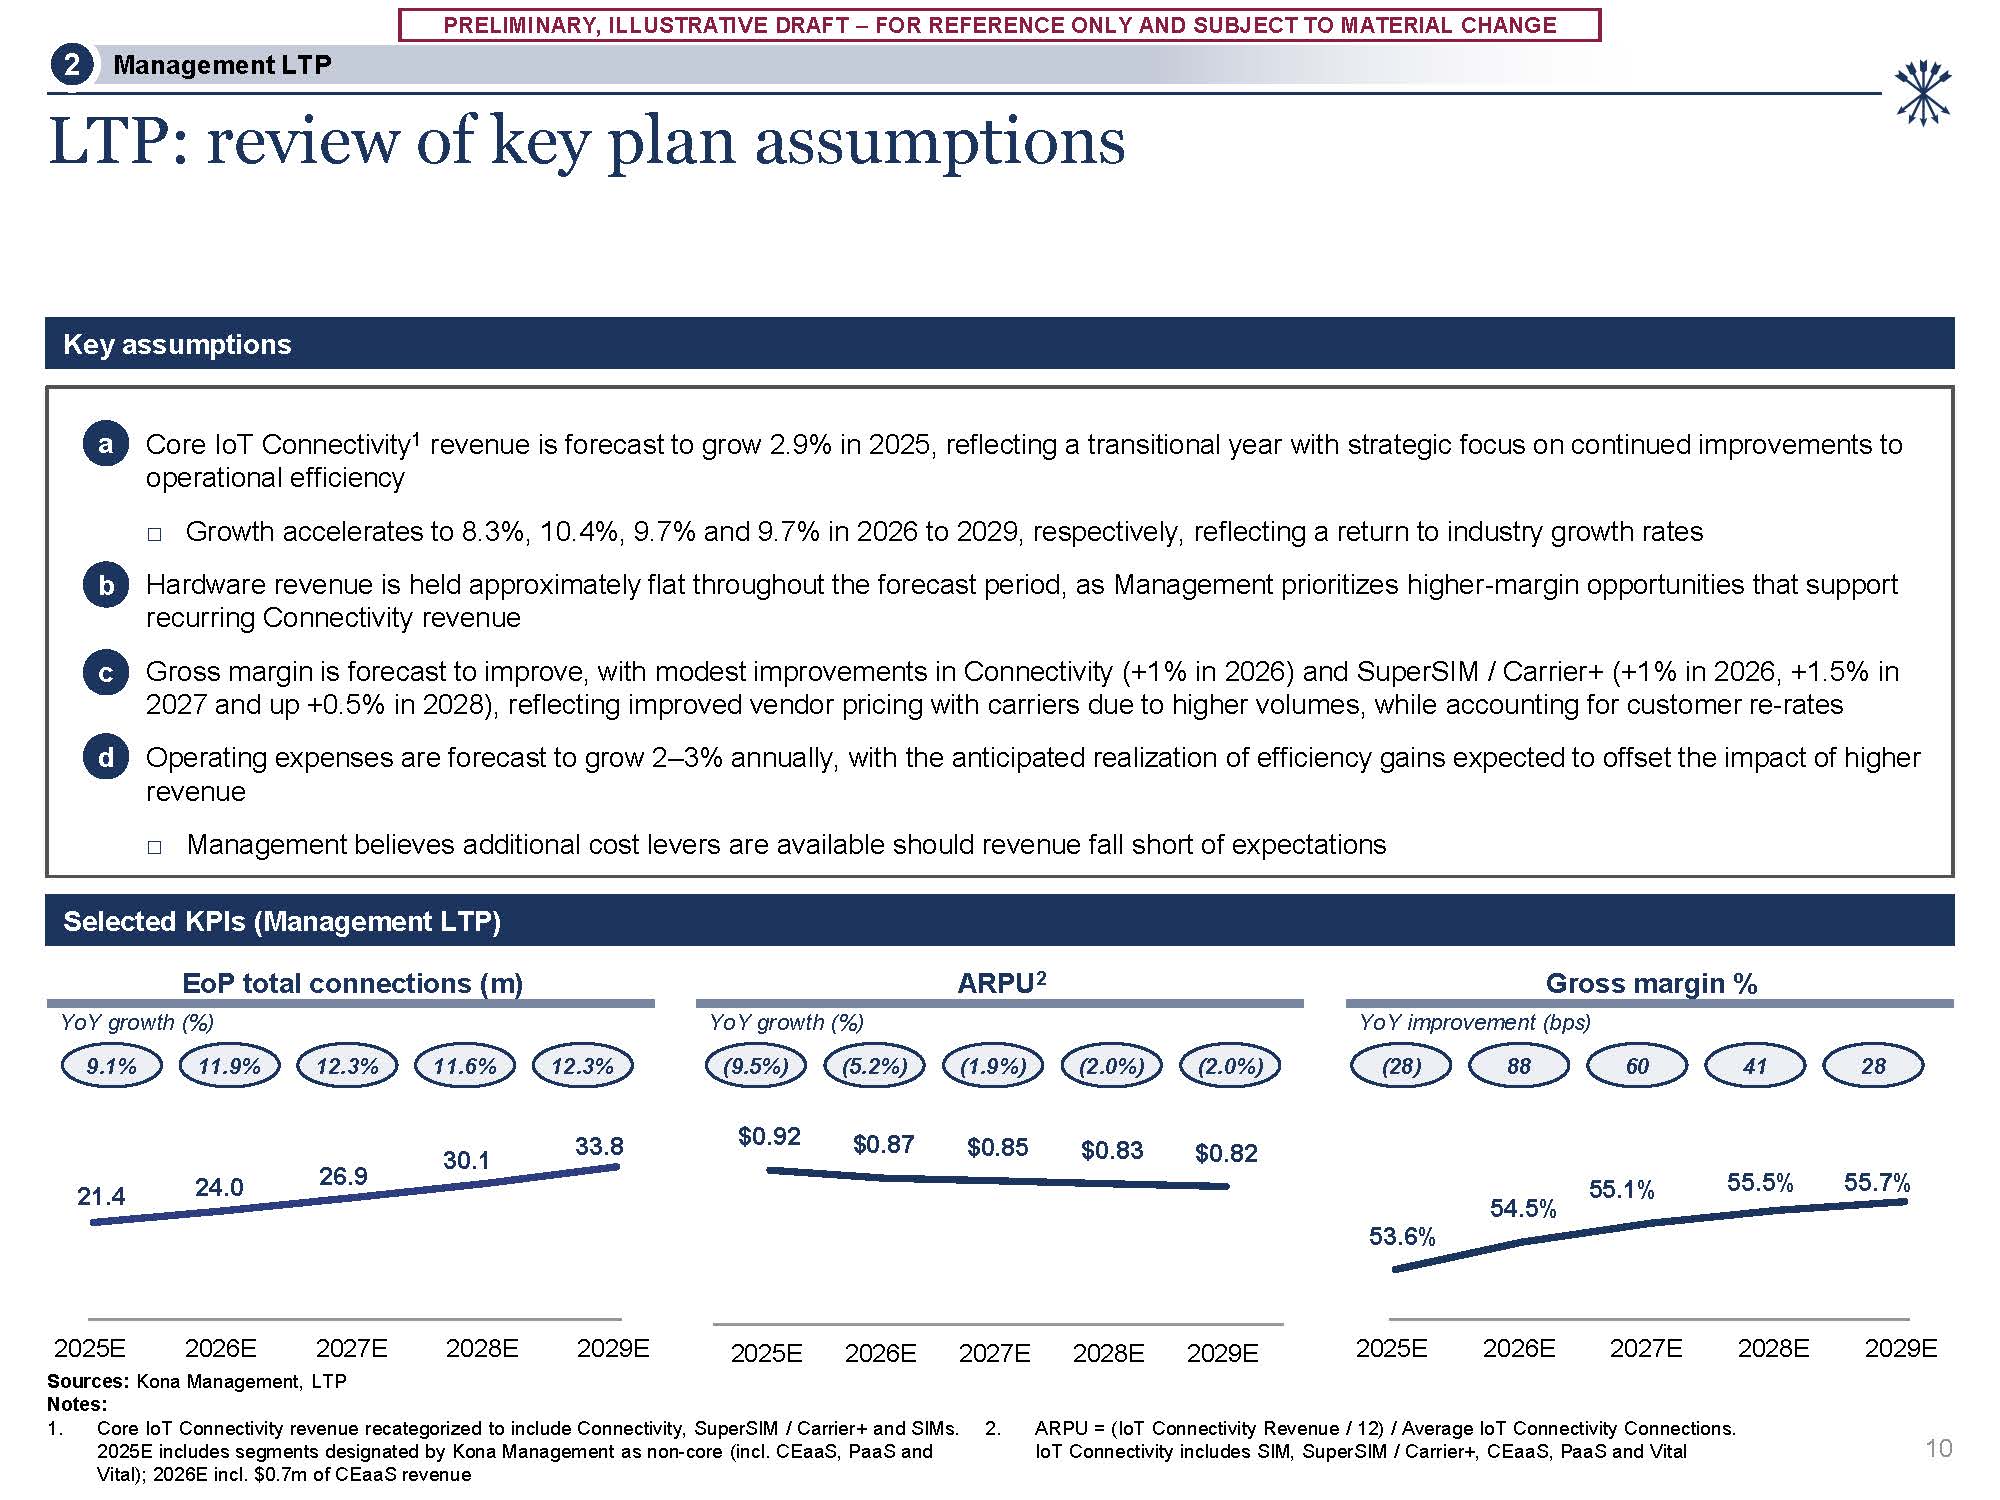
CHANGE 53.6% 54.5% 55.1% 55.5% 55.7% 2025E 2026E 2027E 2028E 2029E $0.92 $0.87 $0.85 $0.83 $0.82 2025E 2026E 2027E 2028E 2029E 21.4 24.0 26.9 30.1 33.8 2025E 2026E 2027E Sources: Kona Management,
LTP Notes: 2028E 2029E b LTP: review of key plan assumptions 1. Core IoT Connectivity revenue recategorized to include Connectivity, SuperSIM / Carrier+ and SIMs. 2. 2025E includes segments designated by Kona Management as non-core
(incl. CEaaS, PaaS and Vital); 2026E incl. $0.7m of CEaaS revenue ARPU = (IoT Connectivity Revenue / 12) / Average IoT Connectivity Connections. IoT Connectivity includes SIM, SuperSIM / Carrier+, CEaaS, PaaS and Vital Selected KPIs
(Management LTP) Key assumptions a Core IoT Connectivity1 revenue is forecast to grow 2.9% in 2025, reflecting a transitional year with strategic focus on continued improvements to operational efficiency Growth accelerates to 8.3%, 10.4%,
9.7% and 9.7% in 2026 to 2029, respectively, reflecting a return to industry growth rates Hardware revenue is held approximately flat throughout the forecast period, as Management prioritizes higher-margin opportunities that support recurring
Connectivity revenue c Gross margin is forecast to improve, with modest improvements in Connectivity (+1% in 2026) and SuperSIM / Carrier+ (+1% in 2026, +1.5% in 2027 and up +0.5% in 2028), reflecting improved vendor pricing with carriers due
to higher volumes, while accounting for customer re-rates d Operating expenses are forecast to grow 2–3% annually, with the anticipated realization of efficiency gains expected to offset the impact of higher revenue Management believes
additional cost levers are available should revenue fall short of expectations 28 10 EoP total connections (m) ARPU2 Gross margin % YoY growth (%) YoY growth (%) YoY improvement (bps) 9.1% 11.9% 12.3% 11.6% 12.3% (9.5%) (5.2%) (1.9%)
(2.0%) (2.0%) (28) 88 60 41 Management LTP 2
PRELIMINARY, ILLUSTRATIVE DRAFT – FOR REFERENCE ONLY AND SUBJECT TO MATERIAL
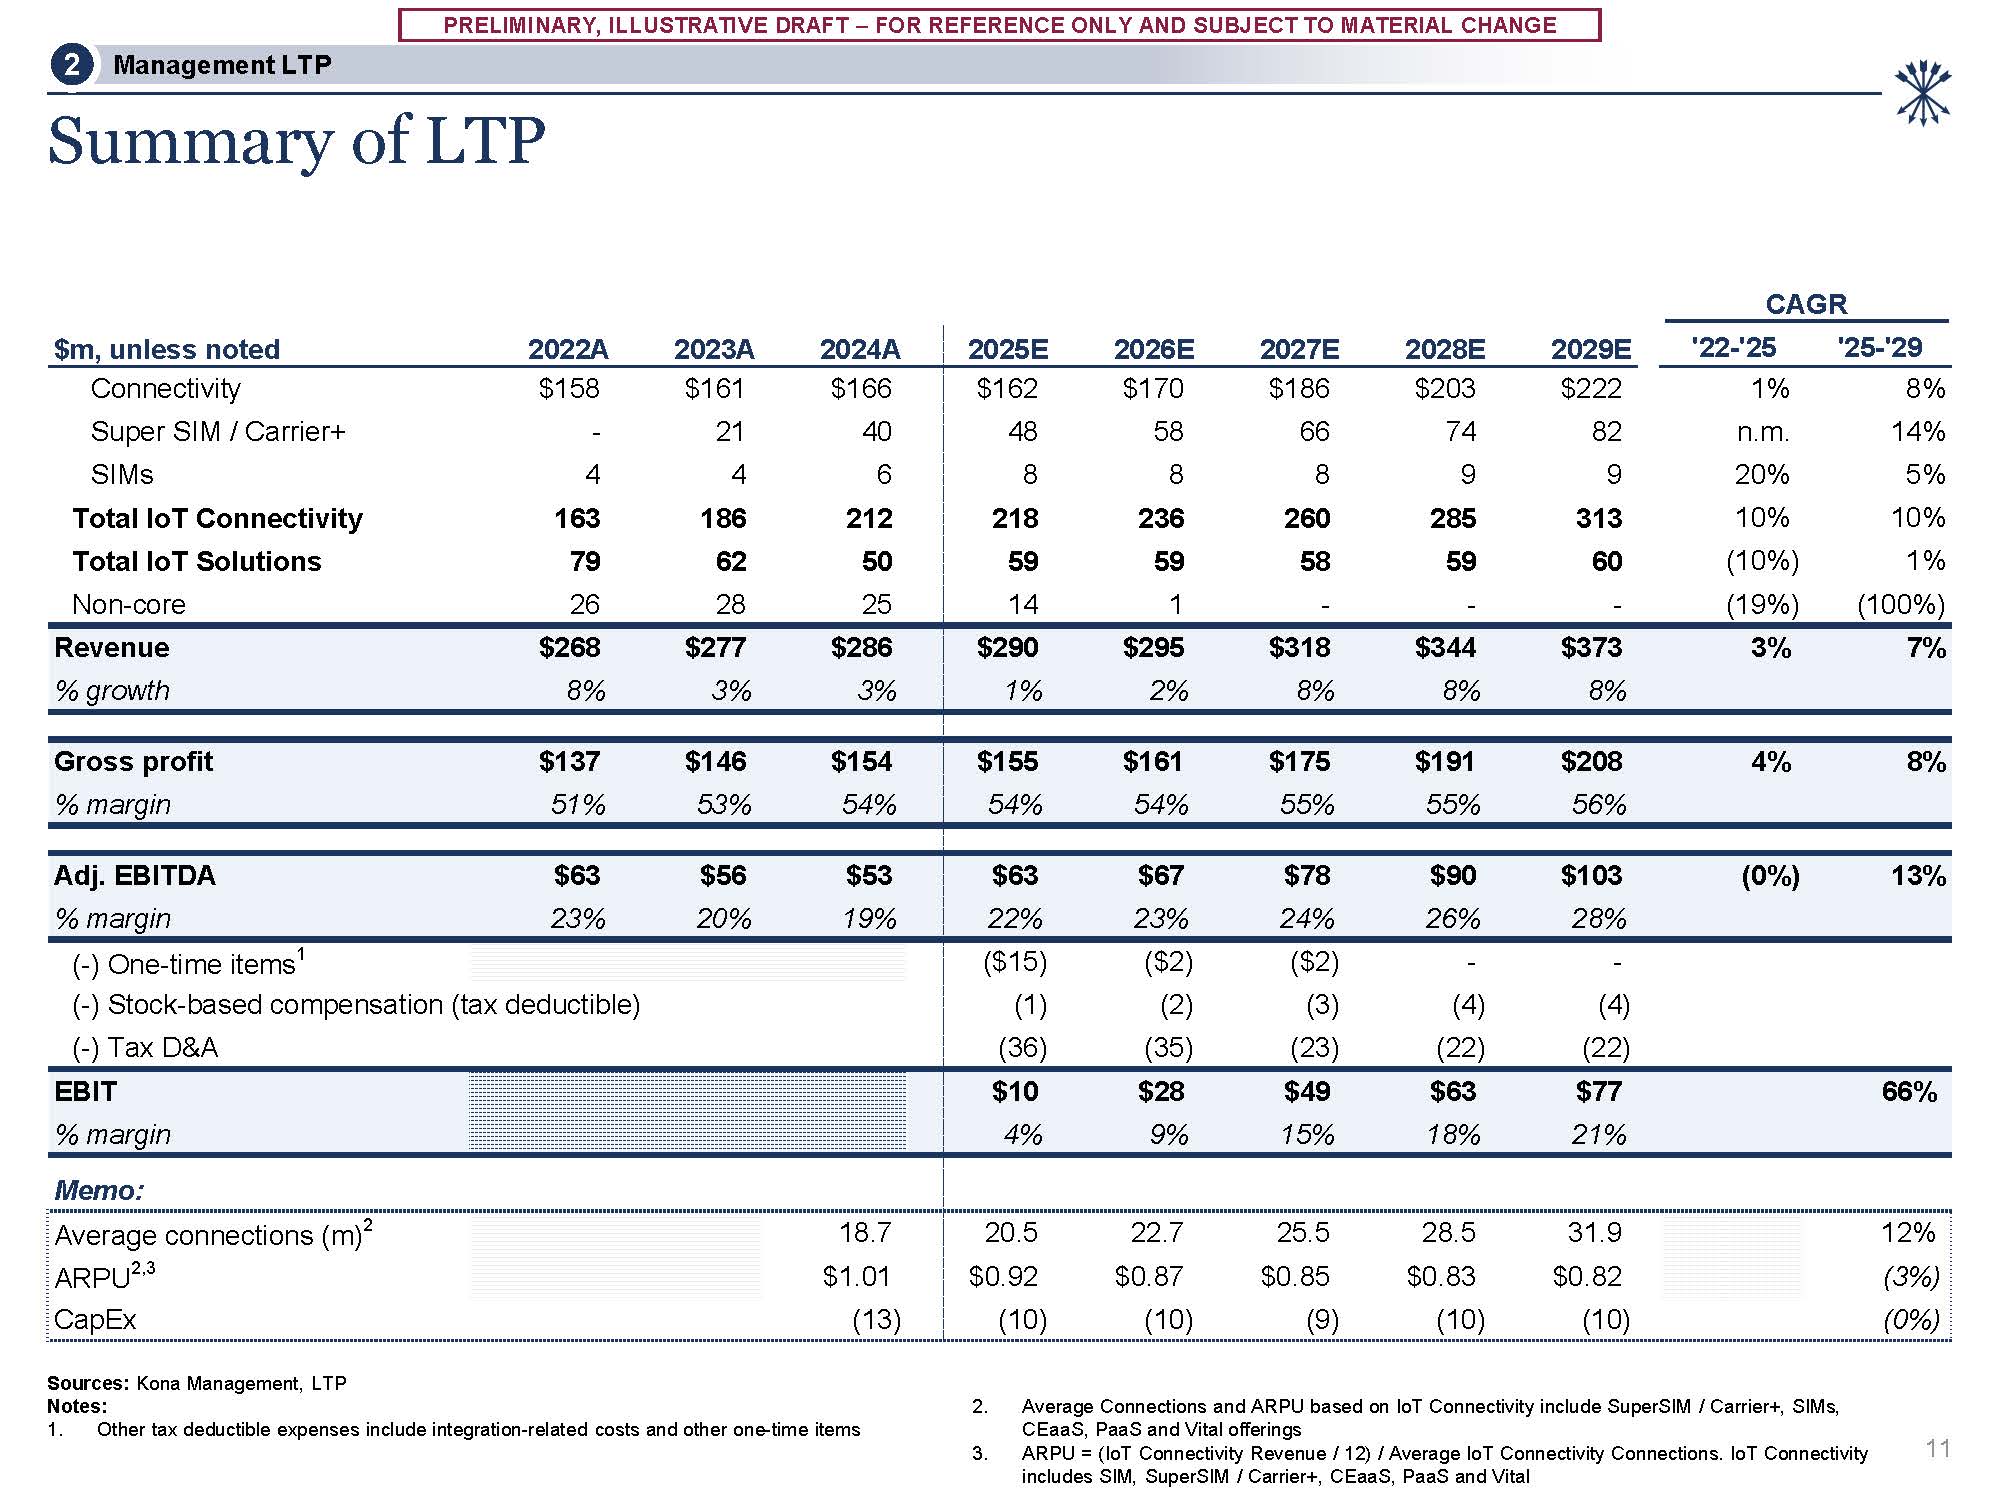
CHANGE Summary of LTP Sources: Kona Management, LTP Notes: 1. Other tax deductible expenses include integration-related costs and other one-time items Average Connections and ARPU based on IoT Connectivity include SuperSIM / Carrier+,
SIMs, CEaaS, PaaS and Vital offerings ARPU = (IoT Connectivity Revenue / 12) / Average IoT Connectivity Connections. IoT Connectivity includes SIM, SuperSIM / Carrier+, CEaaS, PaaS and Vital 11 Management LTP 2 CAGR $m, unless noted
2022A 2023A 2024A 2025E 2026E 2027E 2028E 2029E '22-'25 '25-'29 Connectivity $158 $161 $166 Super SIM / Carrier+ - 21 40 SIMs 4 4 6 Total IoT Connectivity 163 186 212 Total IoT Solutions 79 62 50 Non-core 26 28 25 $162 $170 $186 $203
$222 48 58 66 74 82 8 8 8 9 9 218 236 260 285 313 59 59 58 59 60 14 1 - - - 1% 8% n.m. 14% 20% 5% 10% 10% (10%) 1% (19%) (100%) Revenue $268 $277 $286 % growth 8% 3% 3% $290 $295 $318 $344 $373 3% 7% 1% 2% 8% 8% 8% Gross profit
$137 $146 $154 % margin 51% 53% 54% $155 $161 $175 $191 $208 4% 8% 54% 54% 55% 55% 56% Adj. EBITDA $63 $56 $53 % margin 23% 20% 19% $63 $67 $78 $90 $103 (0%) 13% 22% 23% 24% 26% 28% (-) One-time items1 (-) Stock-based compensation (tax
deductible) (-) Tax D&A ($15) ($2) ($2) - - (1) (2) (3) (4) (4) (36) (35) (23) (22) (22) EBIT % margin $10 $28 $49 $63 $77 66% 4% 9% 15% 18% 21% Memo: Average connections (m)2 18.7 ARPU2,3 $1.01 CapEx (13) 20.5 22.7 25.5 28.5
31.9 12% $0.92 $0.87 $0.85 $0.83 $0.82 (3%) (10) (10) (9) (10) (10) (0%)
3 Preliminary valuation perspectives
PRELIMINARY, ILLUSTRATIVE DRAFT – FOR REFERENCE ONLY AND SUBJECT TO MATERIAL
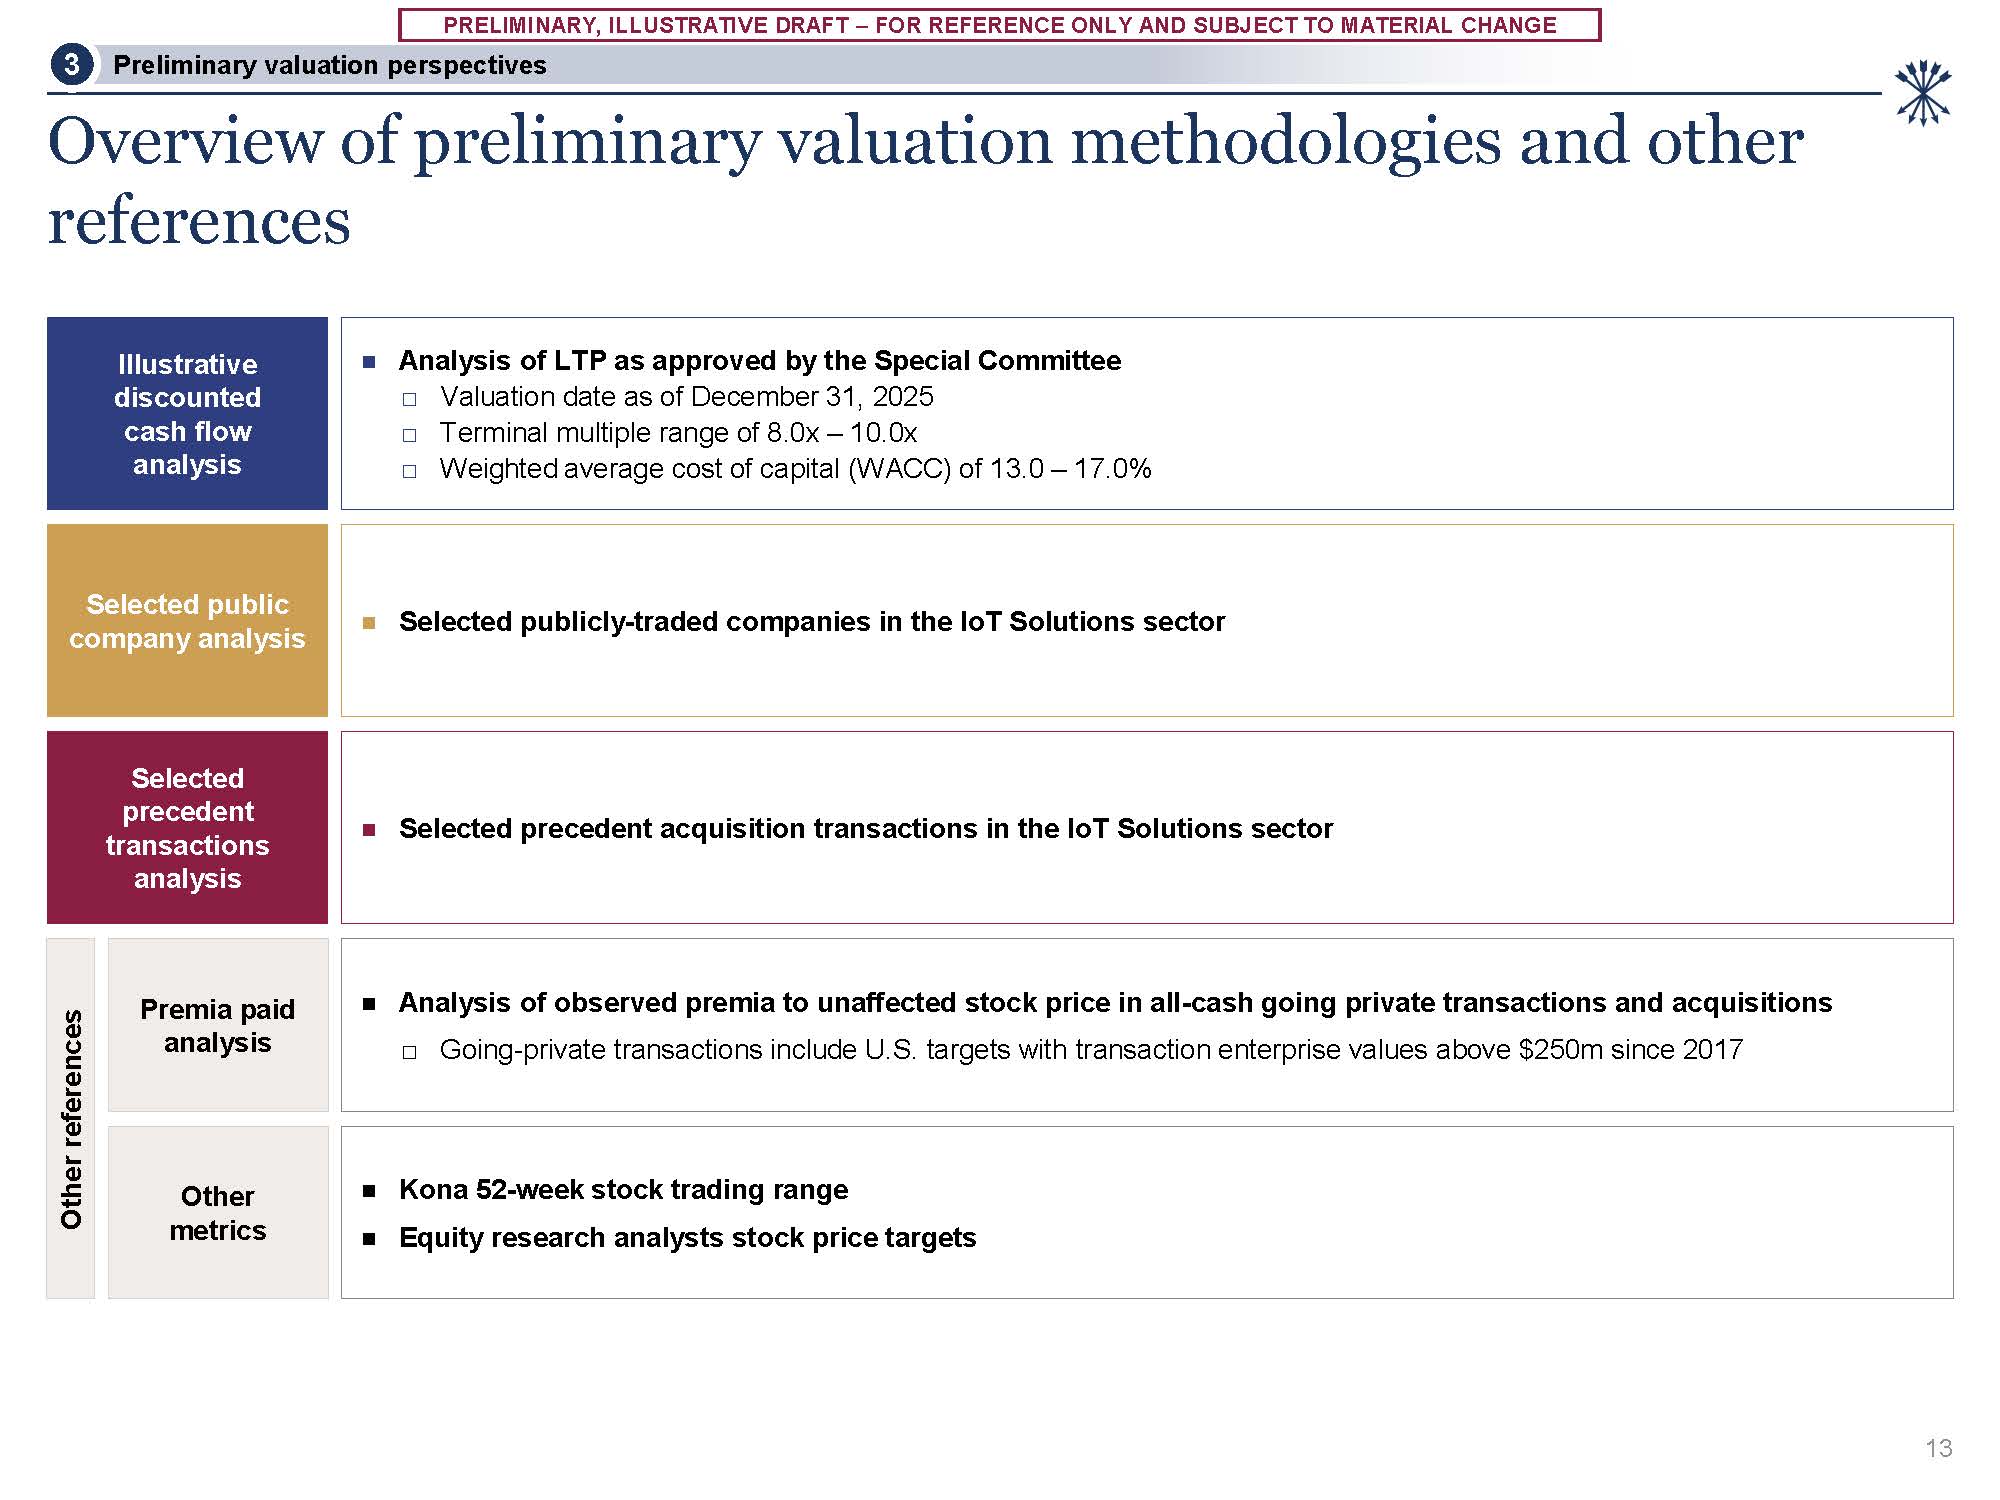
CHANGE Overview of preliminary valuation methodologies and other references Preliminary valuation perspectives 3 Selected public company analysis Selected publicly-traded companies in the IoT Solutions sector Selected precedent
acquisition transactions in the IoT Solutions sector Selected precedent transactions analysis Analysis of LTP as approved by the Special Committee Valuation date as of December 31, 2025 Terminal multiple range of 8.0x – 10.0x Weighted
average cost of capital (WACC) of 13.0 – 17.0% Illustrative discounted cash flow analysis Other references Premia paid analysis Analysis of observed premia to unaffected stock price in all-cash going private transactions and
acquisitions □ Going-private transactions include U.S. targets with transaction enterprise values above $250m since 2017 Other metrics Kona 52-week stock trading range Equity research analysts stock price targets 13
PRELIMINARY, ILLUSTRATIVE DRAFT – FOR REFERENCE ONLY AND SUBJECT TO MATERIAL
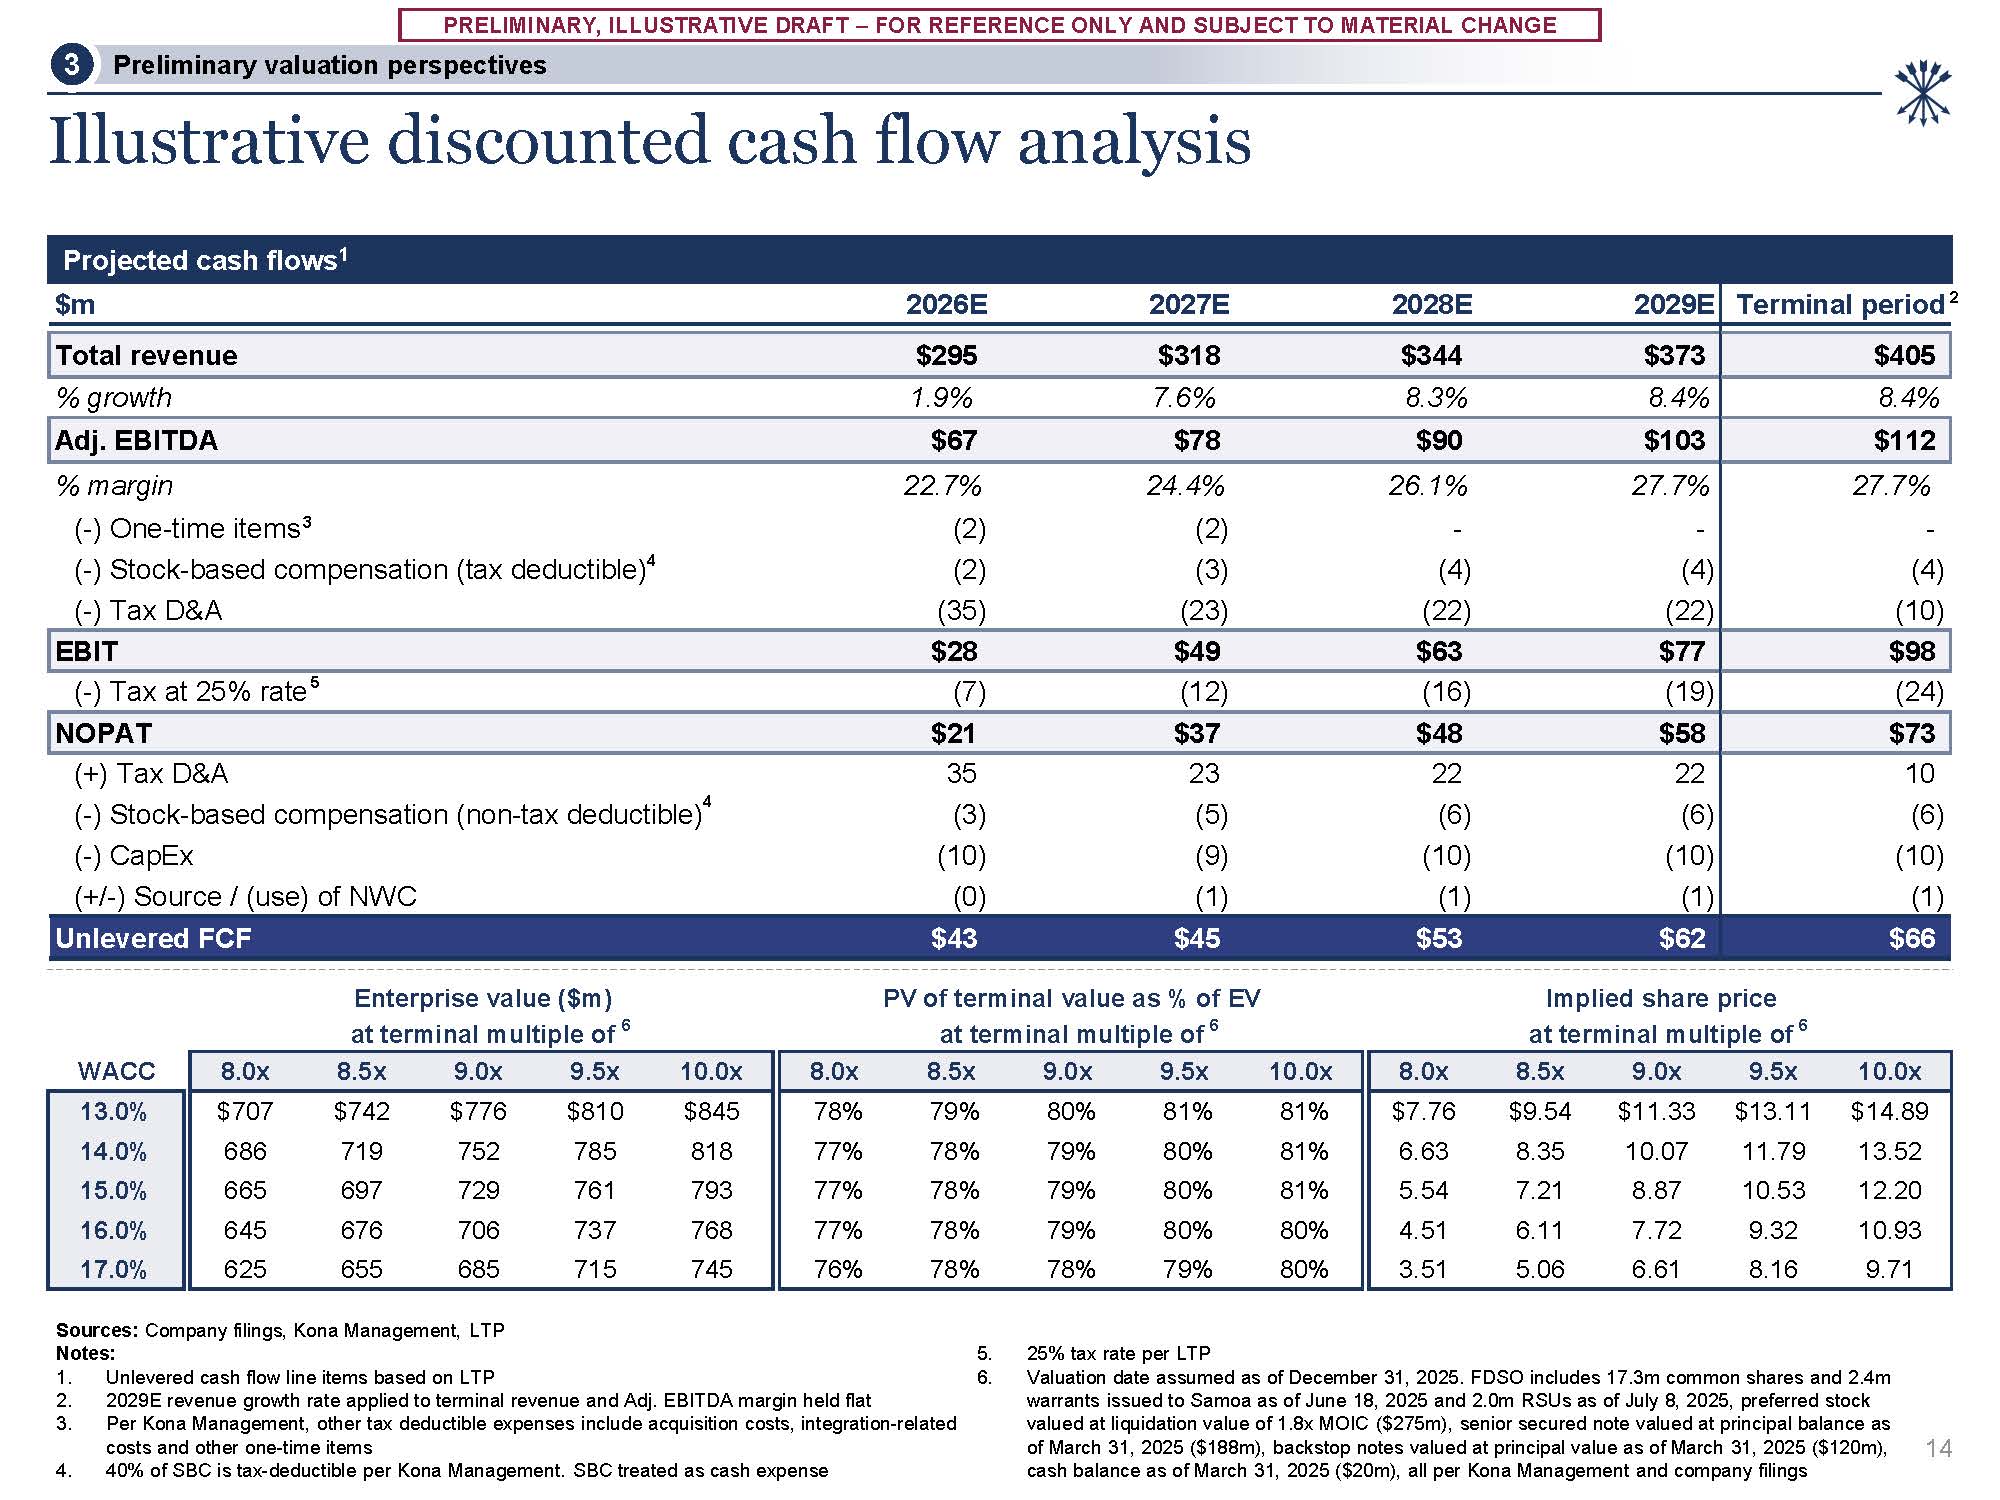
CHANGE WACC 8.0x 8.5x 9.0x 9.5x 10.0x 8.0x 8.5x 9.0x 9.5x 10.0x 8.0x 8.5x 9.0x 9.5x 10.0x 13.0% $707 $742 $776 $810 $845 78% 79% 80% 81% 81% $7.76 $9.54 $11.33 $13.11 $14.89 14.0% 686 719 752 785 818 77% 78% 79% 80% 81% 6.63 8.35 10.07 11.79 13.52 15.0% 665 697 729 761 793 77% 78% 79% 80% 81% 5.54 7.21 8.87 10.53 12.20 16.0% 645 676 706 737 768 77% 78% 79% 80% 80% 4.51 6.11 7.72 9.32 10.93 17.0% 625 655 685 715 745 76% 78% 78% 79% 80% 3.51 5.06 6.61 8.16 9.71 Implied
share price at terminal multiple of 6 Enterprise value ($m) at terminal multiple of 6 PV of terminal value as % of EV at terminal multiple of 6 Illustrative discounted cash flow analysis 14 Sources: Company filings, Kona Management,
LTP Notes: Unlevered cash flow line items based on LTP 2029E revenue growth rate applied to terminal revenue and Adj. EBITDA margin held flat Per Kona Management, other tax deductible expenses include acquisition costs, integration-related
costs and other one-time items 40% of SBC is tax-deductible per Kona Management. SBC treated as cash expense 25% tax rate per LTP Valuation date assumed as of December 31, 2025. FDSO includes 17.3m common shares and 2.4m warrants issued to
Samoa as of June 18, 2025 and 2.0m RSUs as of July 8, 2025, preferred stock valued at liquidation value of 1.8x MOIC ($275m), senior secured note valued at principal balance as of March 31, 2025 ($188m), backstop notes valued at principal value
as of March 31, 2025 ($120m), cash balance as of March 31, 2025 ($20m), all per Kona Management and company filings 2 Projected cash flows1 $m 2026E 2027E 2028E 2029E Terminal period Total revenue $295 $318 $344 $373 $405 % growth 1.9%
7.6% 8.3% 8.4% 8.4% Adj. EBITDA $67 $78 $90 $103 $112 % margin 22.7% 24.4% 26.1% 27.7% (-) One-time items 3 (2) (2) - - (-) Stock-based compensation (tax deductible)4 (2) (3) (4) (4) (-) Tax D&A (35) (23) (22) (22) 27.7% -
(4) (10) EBIT $28 $49 $63 $77 $98 (-) Tax at 25% rate 5 (7) (12) (16) (19) (24) NOPAT $21 $37 $48 $58 $73 (+) Tax D&A 35 23 22 22 (-) Stock-based compensation (non-tax deductible)4 (3) (5) (6) (6) (-) CapEx (10) (9) (10)
(10) (+/-) Source / (use) of NWC (0) (1) (1) (1) 10 (6) (10) (1) Unlevered FCF $43 $45 $53 $62 $66 Preliminary valuation perspectives 3
PRELIMINARY, ILLUSTRATIVE DRAFT – FOR REFERENCE ONLY AND SUBJECT TO MATERIAL
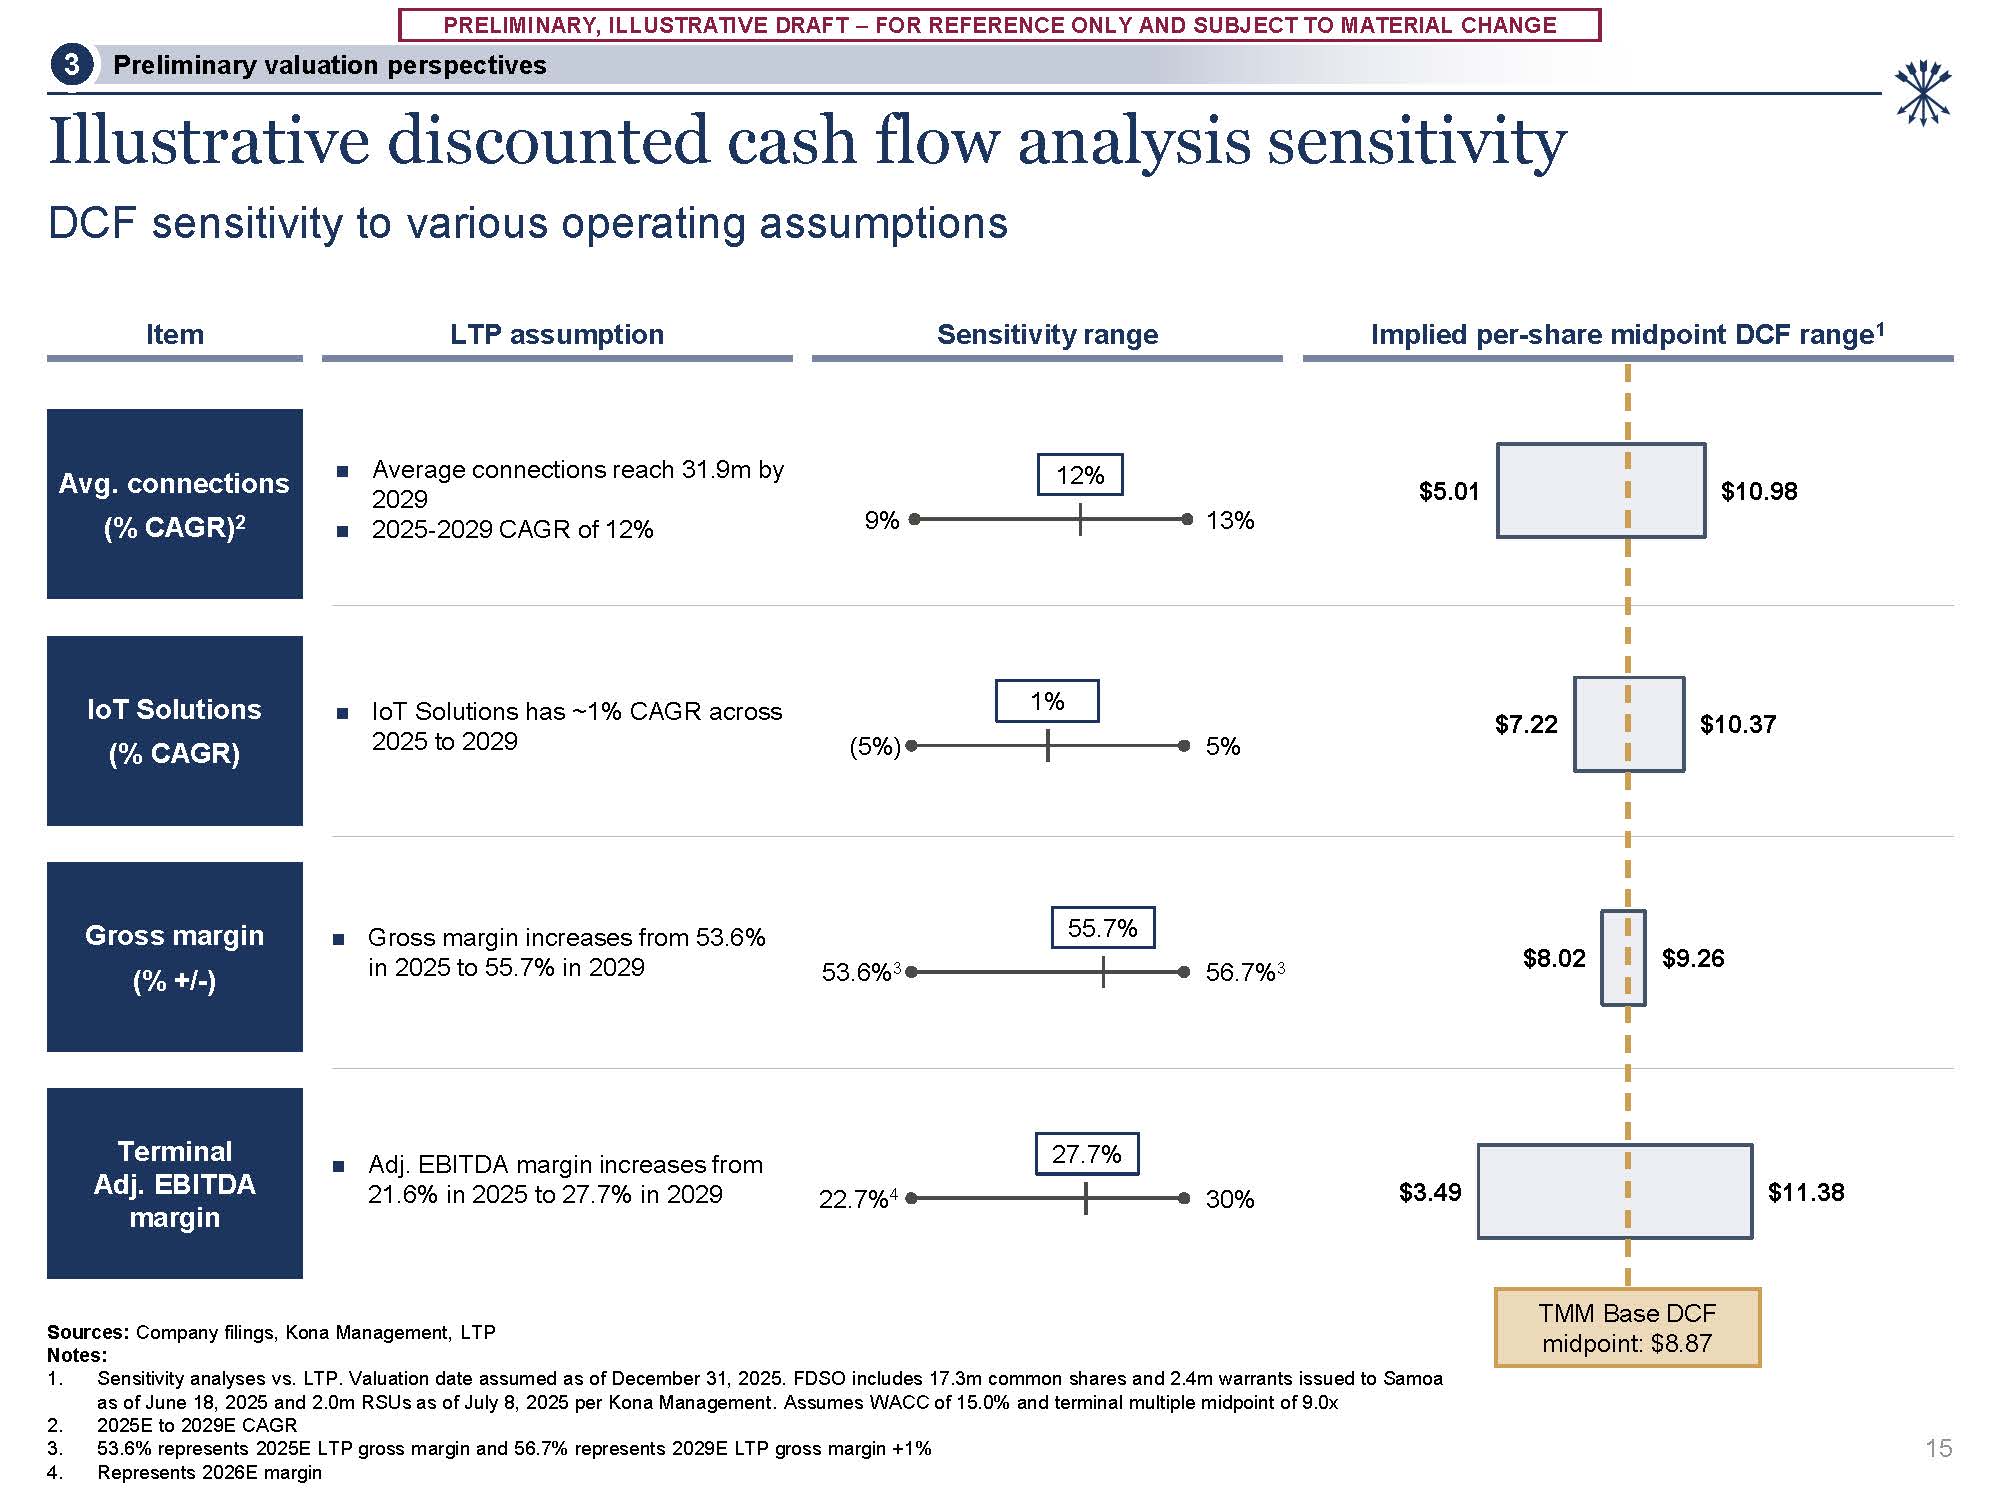
CHANGE $5.01 $7.22 $8.02 $3.49 $10.98 $10.37 $9.26 $11.38 Illustrative discounted cash flow analysis sensitivity DCF sensitivity to various operating assumptions 15 Implied per-share midpoint DCF range1 LTP
assumption Item Sources: Company filings, Kona Management, LTP Notes: Sensitivity analyses vs. LTP. Valuation date assumed as of December 31, 2025. FDSO includes 17.3m common shares and 2.4m warrants issued to Samoa as of June 18, 2025 and
2.0m RSUs as of July 8, 2025 per Kona Management. Assumes WACC of 15.0% and terminal multiple midpoint of 9.0x 2025E to 2029E CAGR 53.6% represents 2025E LTP gross margin and 56.7% represents 2029E LTP gross margin +1% Represents 2026E
margin Sensitivity range Avg. connections (% CAGR)2 Average connections reach 31.9m by 2029 2025-2029 CAGR of 12% 9% 13% 12% IoT Solutions (% CAGR) IoT Solutions has ~1% CAGR across 2025 to 2029 (5%) 5% 1% Gross margin (%
+/-) Gross margin increases from 53.6% in 2025 to 55.7% in 2029 53.6%3 56.7%3 55.7% Adj. EBITDA margin increases from 21.6% in 2025 to 27.7% in 2029 Terminal Adj. EBITDA margin 22.7%4 30% 27.7% TMM Base DCF midpoint:
$8.87 Preliminary valuation perspectives 3
PRELIMINARY, ILLUSTRATIVE DRAFT – FOR REFERENCE ONLY AND SUBJECT TO MATERIAL
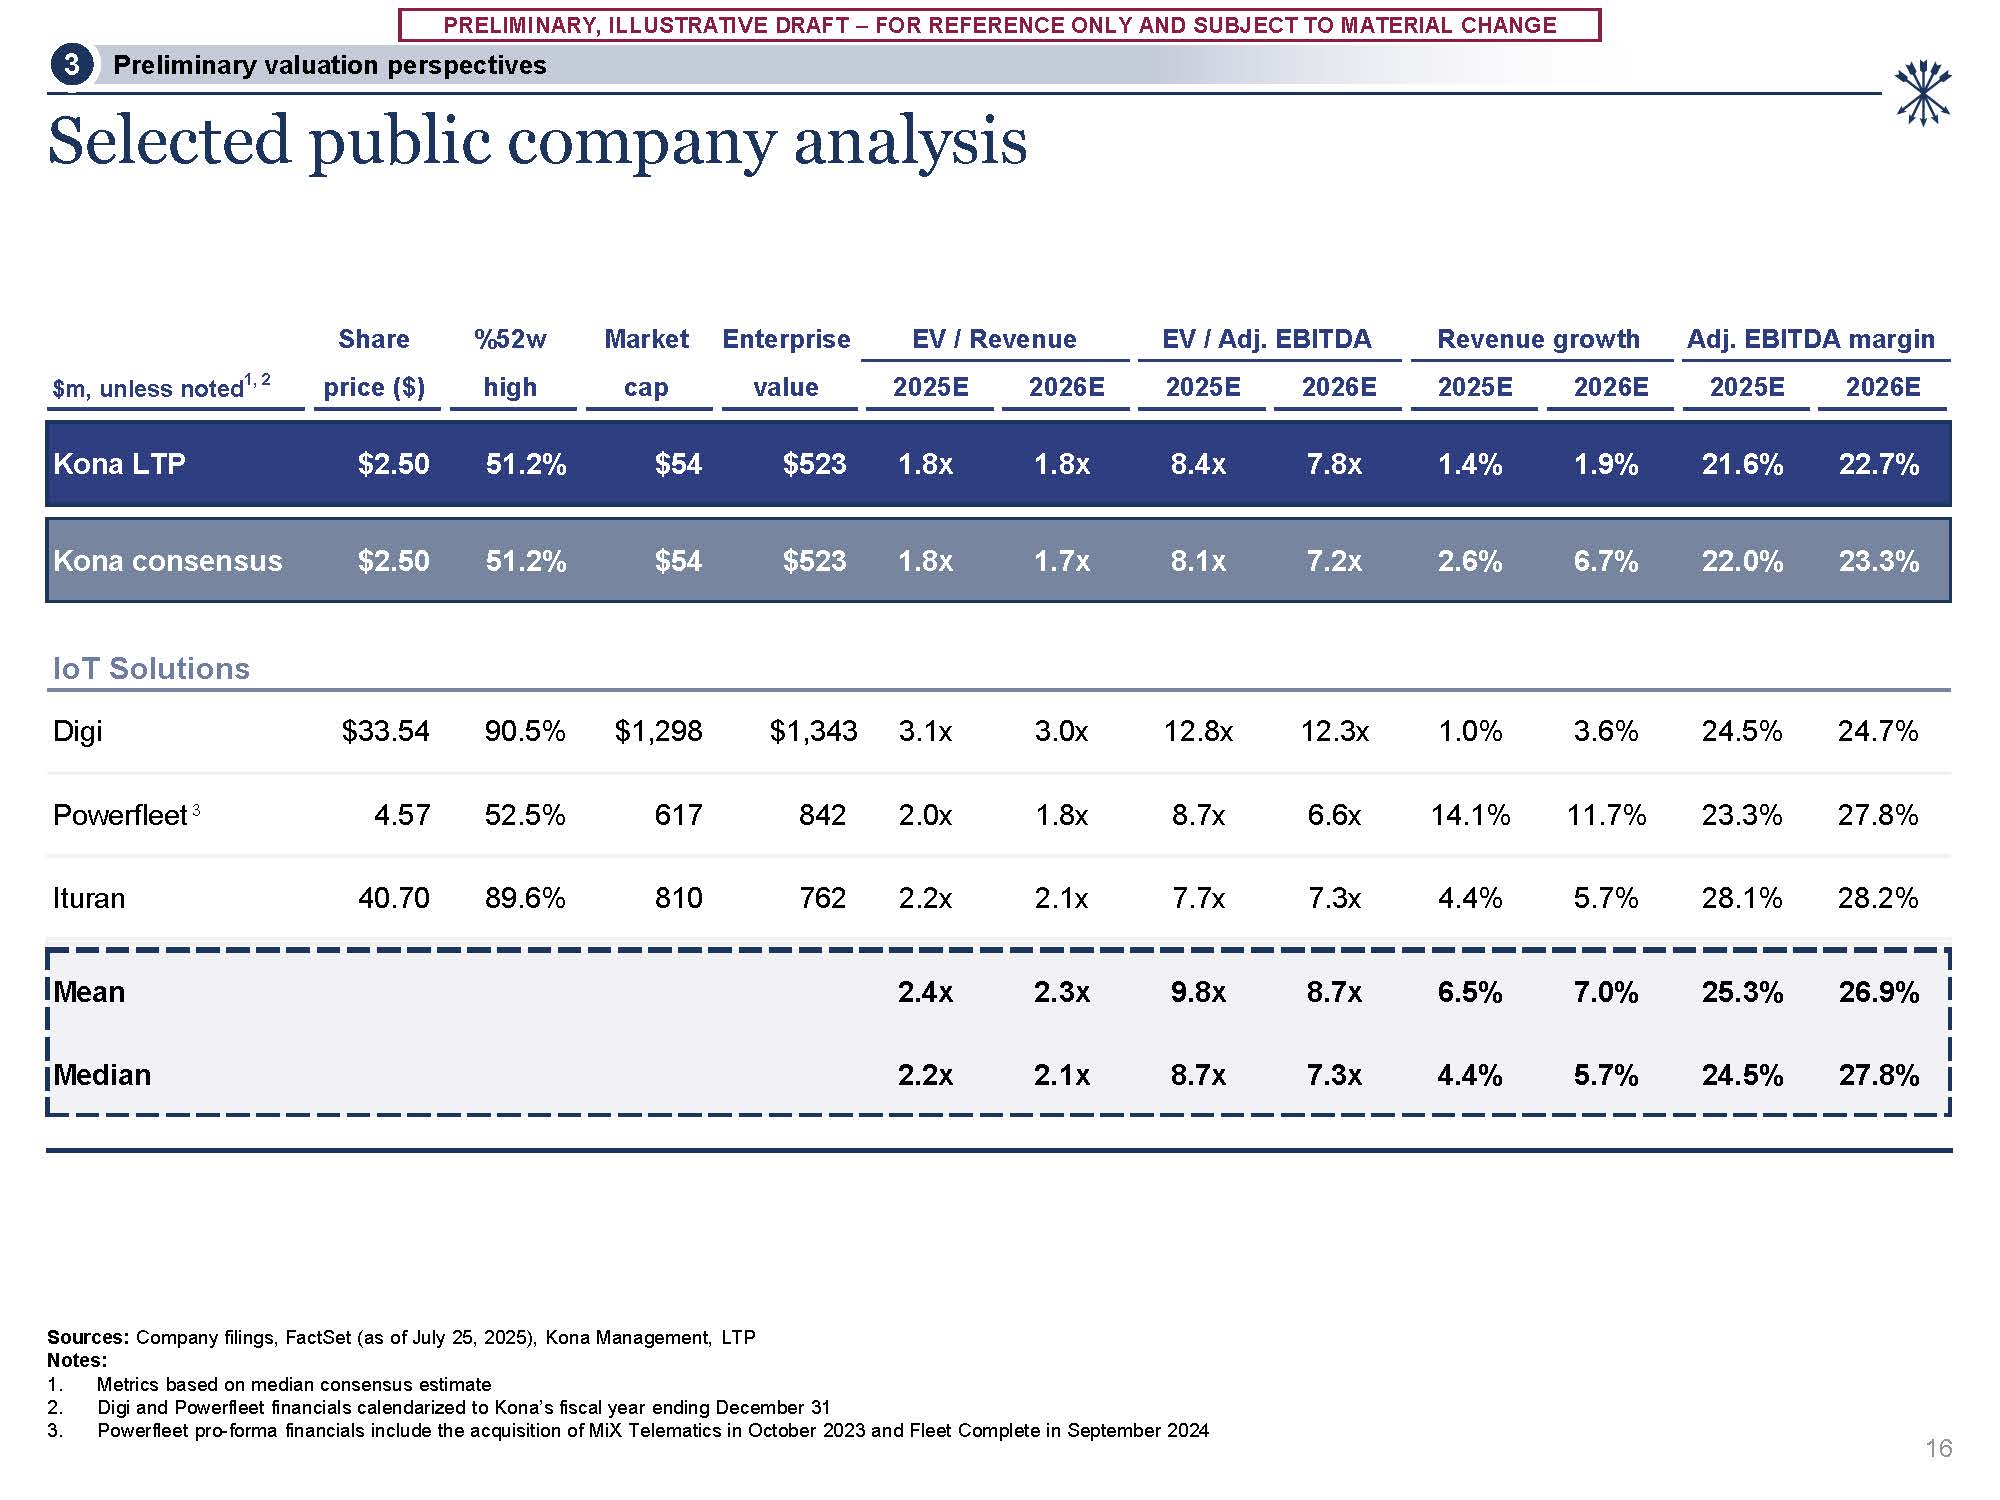
CHANGE $m, unless noted1, 2 price ($) high cap value 2025E 2026E 2025E 2026E 2025E 2026E 2025E 2026E Kona LTP $2.50 51.2% $54 $523 1.8x 1.8x 8.4x 7.8x 1.4% 1.9% 21.6% 22.7% Kona
consensus $2.50 51.2% $54 $523 1.8x 1.7x 8.1x 7.2x 2.6% 6.7% 22.0% 23.3% IoT Solutions Digi $33.54 90.5% $1,298 $1,343 3.1x 3.0x 12.8x 12.3x 1.0% 3.6% 24.5% 24.7% Powerfleet
3 4.57 52.5% 617 842 2.0x 1.8x 8.7x 6.6x 14.1% 11.7% 23.3% 27.8% Ituran 40.70 89.6% 810 762 2.2x 2.1x 7.7x 7.3x 4.4% 5.7% 28.1% 28.2% Mean 2.4x 2.3x 9.8x 8.7x 6.5% 7.0% 25.3% 26.9% Median 2.2x 2.1x 8.7x 7.3x 4.4% 5.7% 24.5% 27.8% Share %52w Market Enterprise EV
/ Revenue EV / Adj. EBITDA Revenue growth Adj. EBITDA margin Selected public company analysis Sources: Company filings, FactSet (as of July 25, 2025), Kona Management, LTP Notes: Metrics based on median consensus estimate Digi and
Powerfleet financials calendarized to Kona’s fiscal year ending December 31 Powerfleet pro-forma financials include the acquisition of MiX Telematics in October 2023 and Fleet Complete in September 2024 16 Preliminary valuation
perspectives 3
PRELIMINARY, ILLUSTRATIVE DRAFT – FOR REFERENCE ONLY AND SUBJECT TO MATERIAL
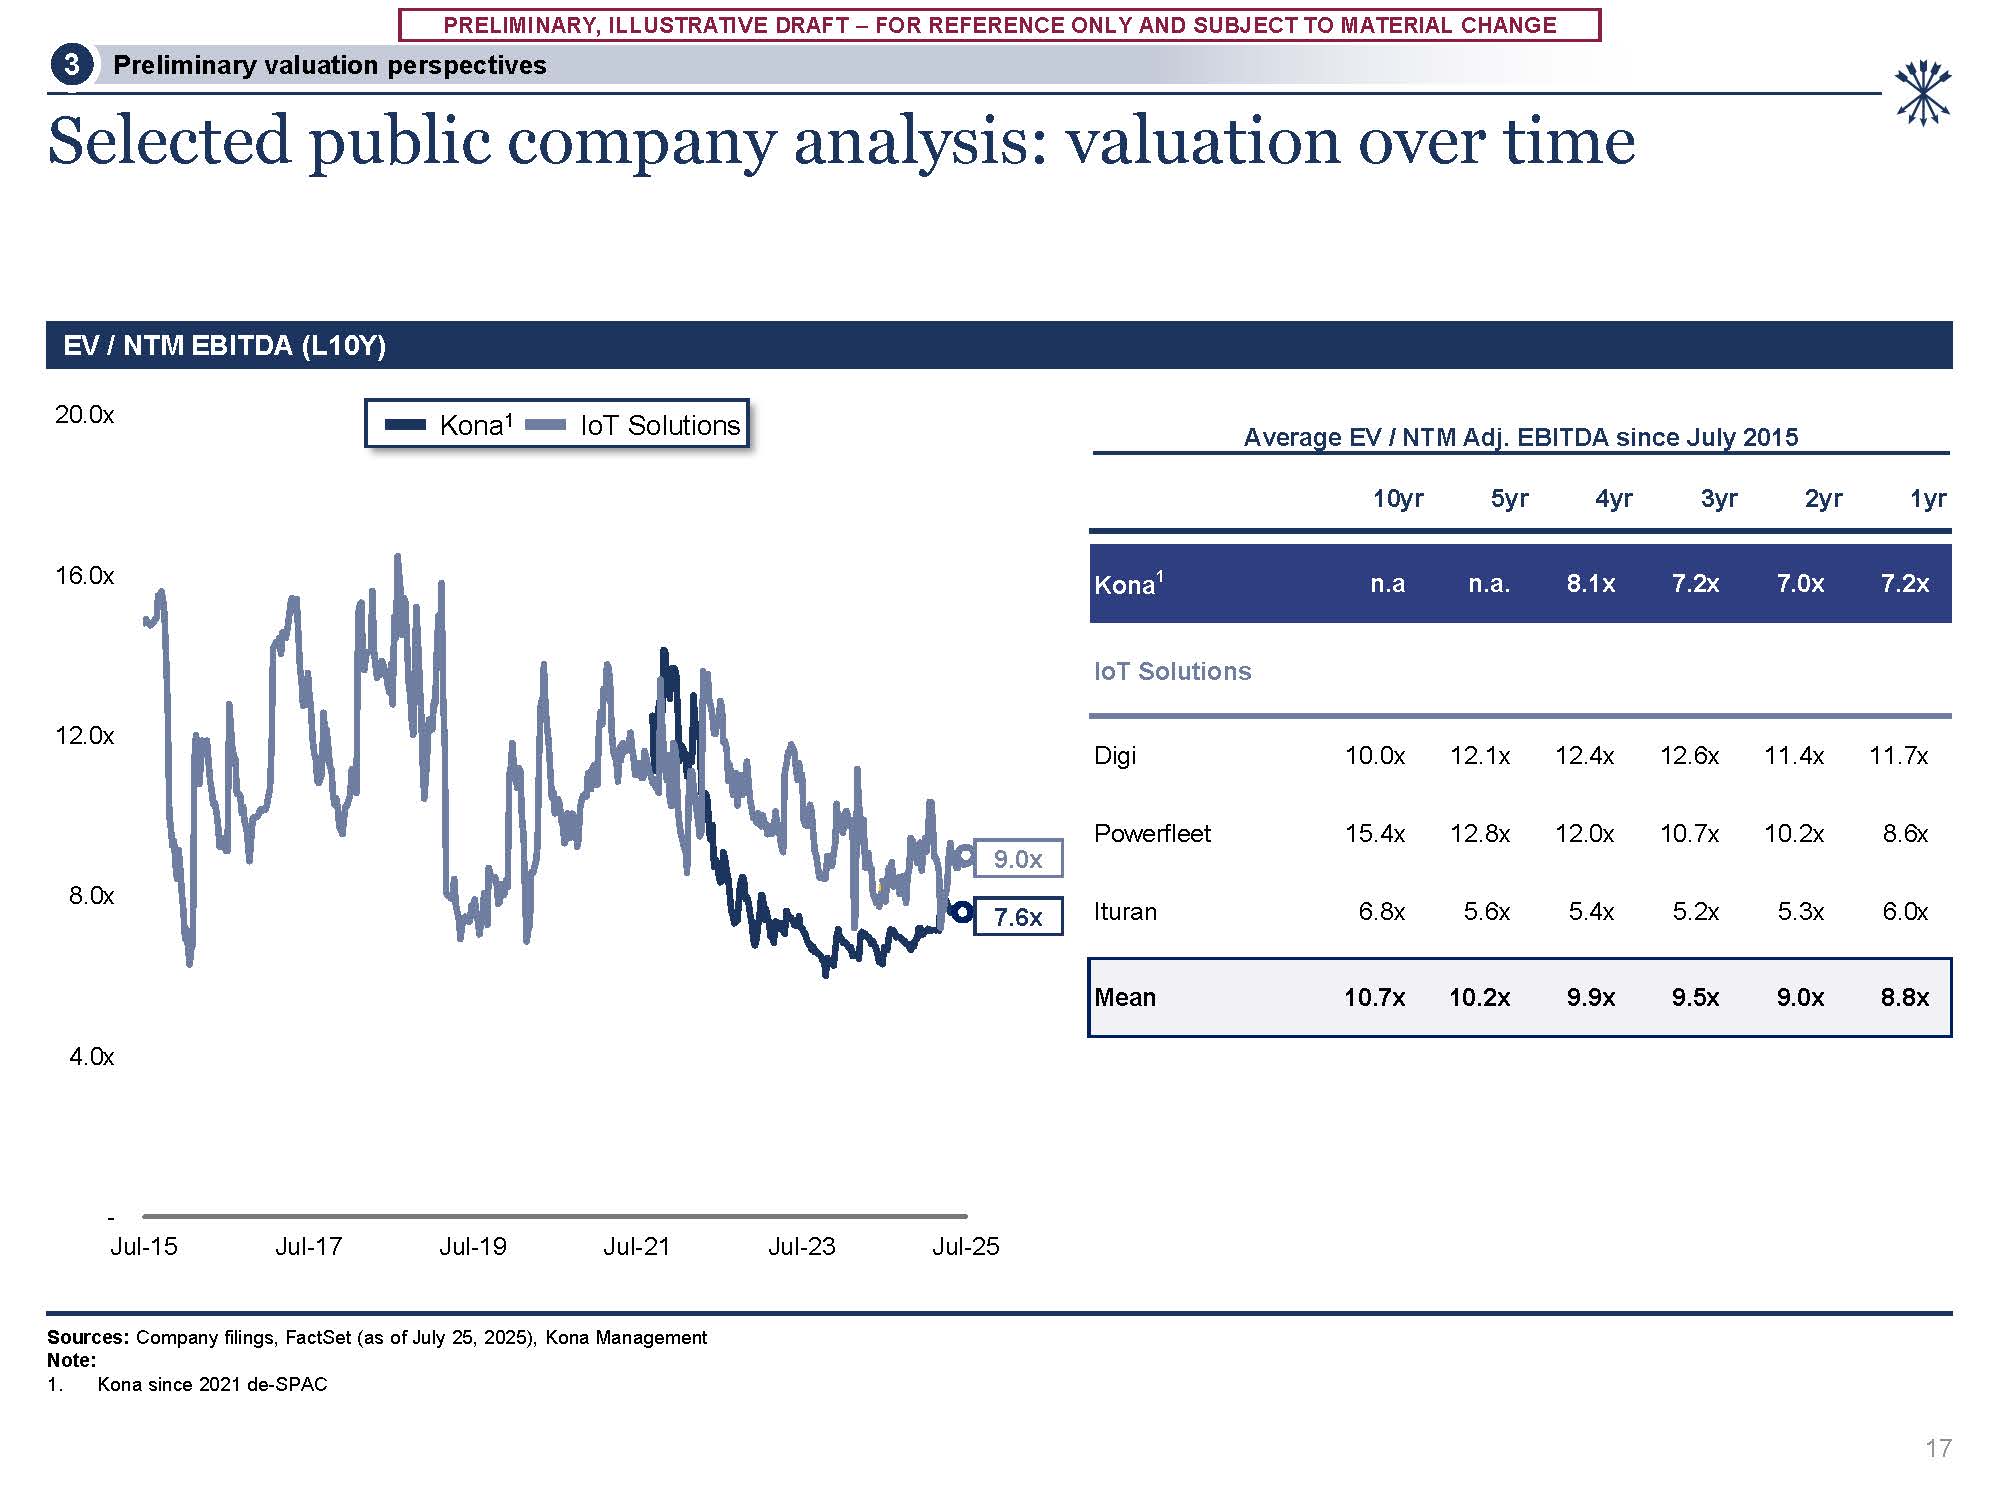
CHANGE - 4.0x 8.0x 12.0x 16.0x 20.0x Jul-15 Jul-17 Jul-19 Jul-21 Jul-23 Jul-25 Selected public company analysis: valuation over time EV / NTM EBITDA (L10Y) 17 Sources: Company filings, FactSet (as of July 25, 2025), Kona
Management Note: 1. Kona since 2021 de-SPAC Kona1 IoT Solutions Preliminary valuation perspectives 3 Average EV / NTM Adj. EBITDA since July 2015 10yr 5yr 4yr 3yr 2yr 1yr Kona1 n.a n.a. 8.1x 7.2x 7.0x 7.2x IoT
Solutions Digi 10.0x 12.1x 12.4x 12.6x 11.4x 11.7x Powerfleet 15.4x 12.8x 12.0x 10.7x 10.2x 8.6x 9.0x 7.6x Ituran 6.8x 5.6x 5.4x 5.2x 5.3x 6.0x Mean 10.7x 10.2x 9.9x 9.5x 9.0x 8.8x
PRELIMINARY, ILLUSTRATIVE DRAFT – FOR REFERENCE ONLY AND SUBJECT TO MATERIAL
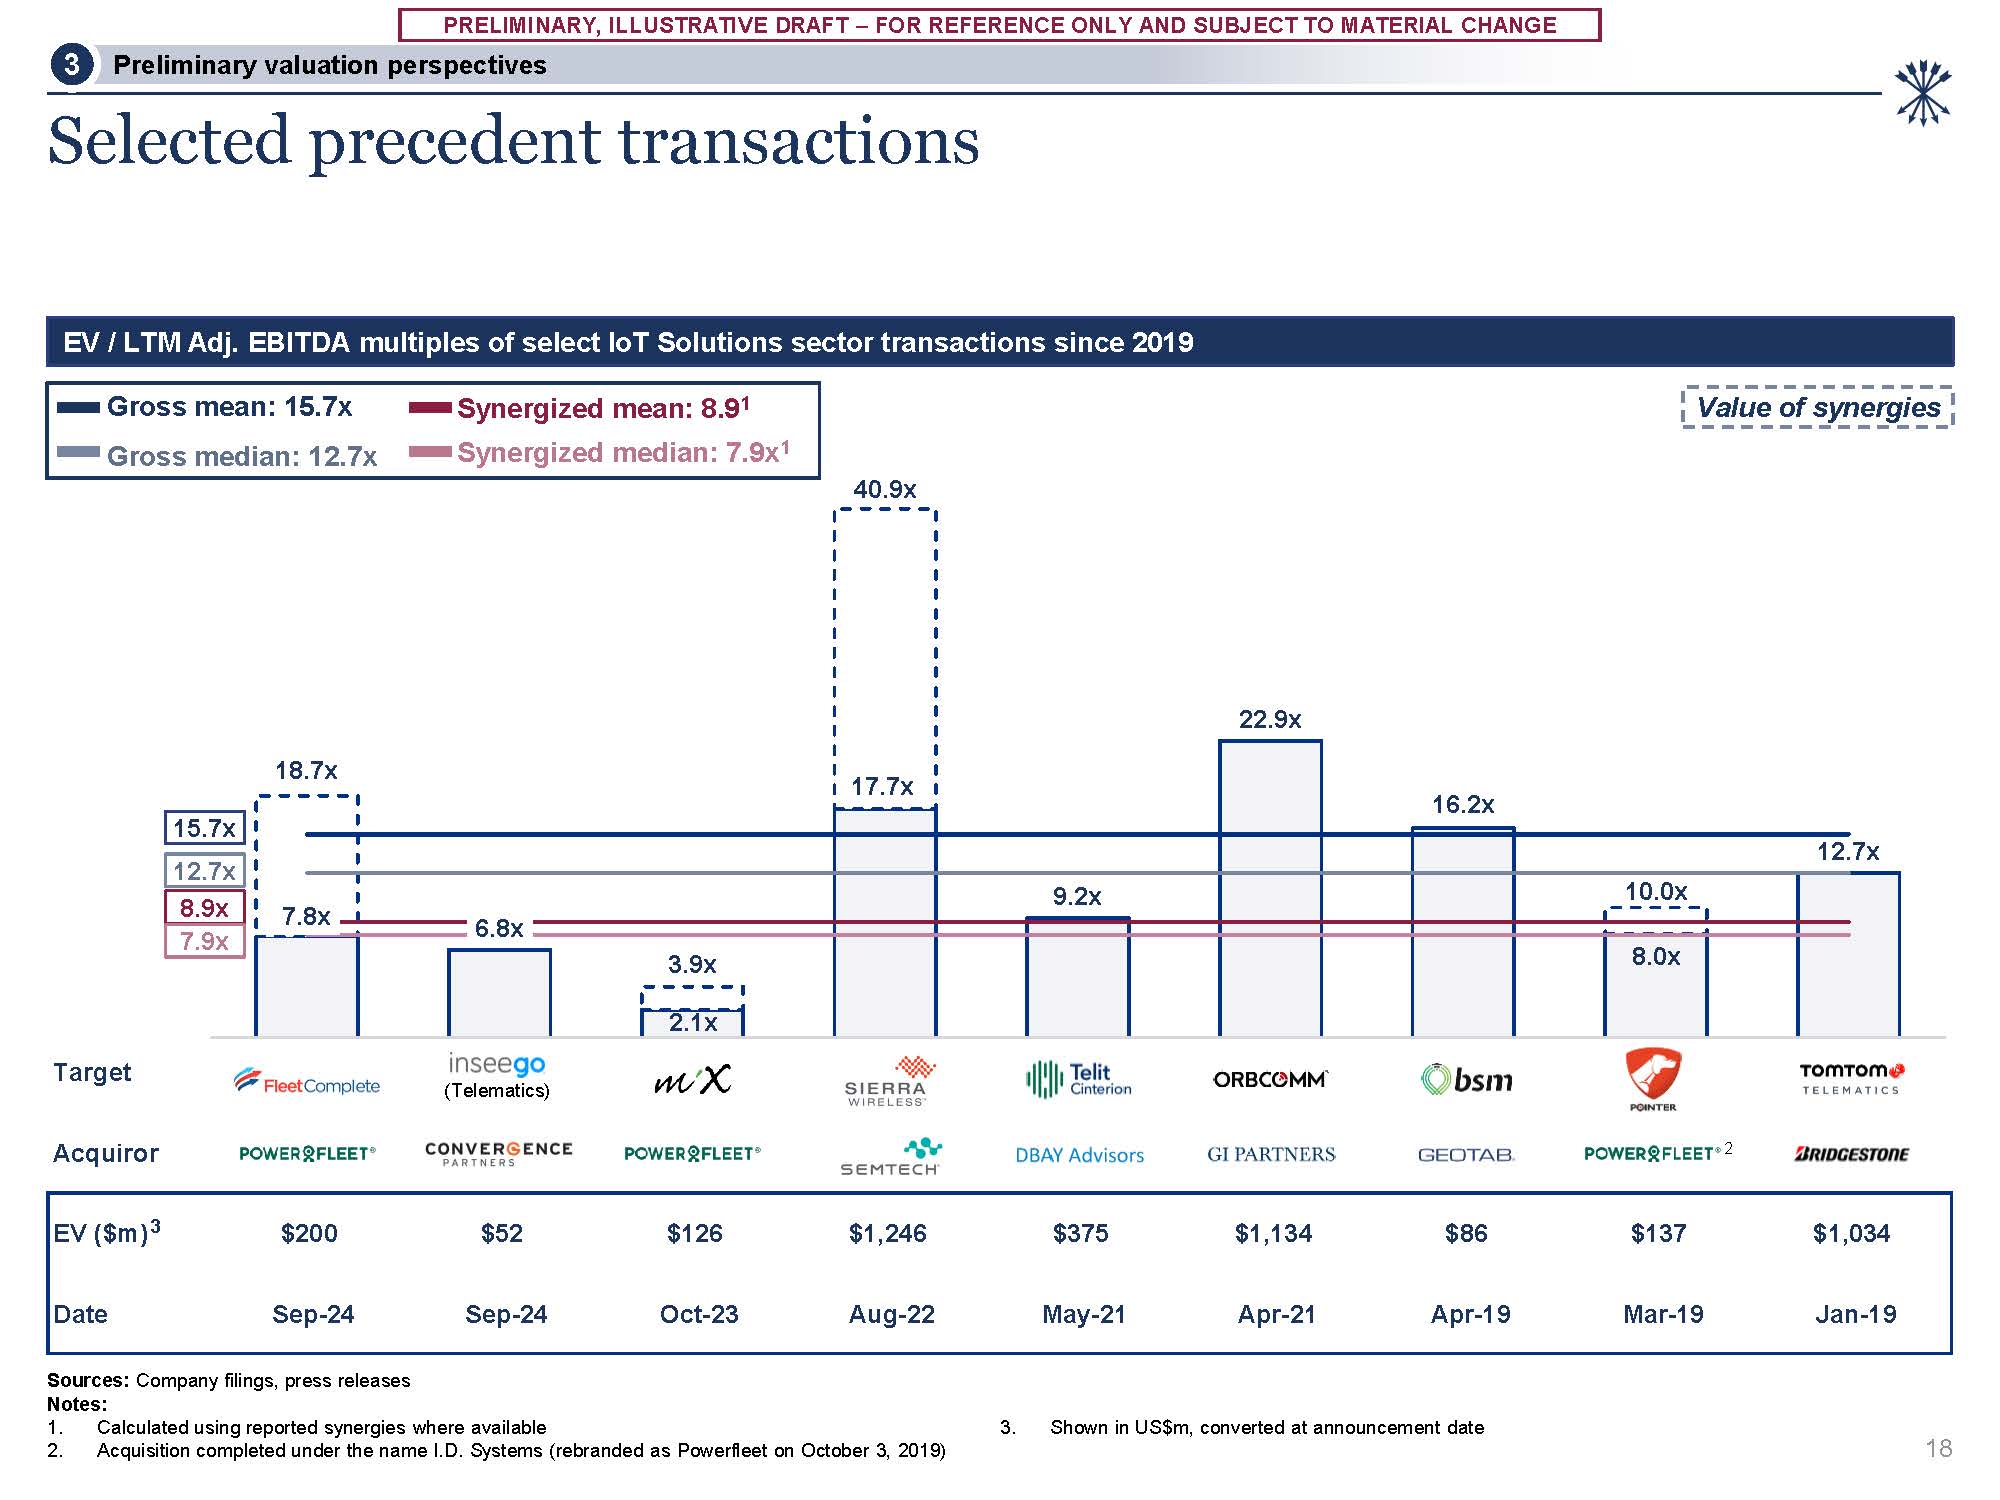
CHANGE Target Acquiror EV
($m)3 $200 $52 $126 $1,246 $375 $1,134 $86 $137 $1,034 Date Sep-24 Sep-24 Oct-23 Aug-22 May-21 Apr-21 Apr-19 Mar-19 Jan-19 7.8x 2.1x 17.7x 8.0x 18.7x 6.8x 3.9x 40.9x 9.2x 22.9x 16.2x 10.0x 12.7x Selected
precedent transactions Sources: Company filings, press releases Notes: Calculated using reported synergies where available Acquisition completed under the name I.D. Systems (rebranded as Powerfleet on October 3, 2019) 3. Shown in US$m,
converted at announcement date EV / LTM Adj. EBITDA multiples of select IoT Solutions sector transactions since 2019 18 (Telematics) 2 Value of synergies 15.7x 12.7x 8.9x 7.9x Gross mean: 15.7x Gross median: 12.7x Synergized mean:
8.91 Synergized median: 7.9x1 Preliminary valuation perspectives 3
PRELIMINARY, ILLUSTRATIVE DRAFT – FOR REFERENCE ONLY AND SUBJECT TO MATERIAL
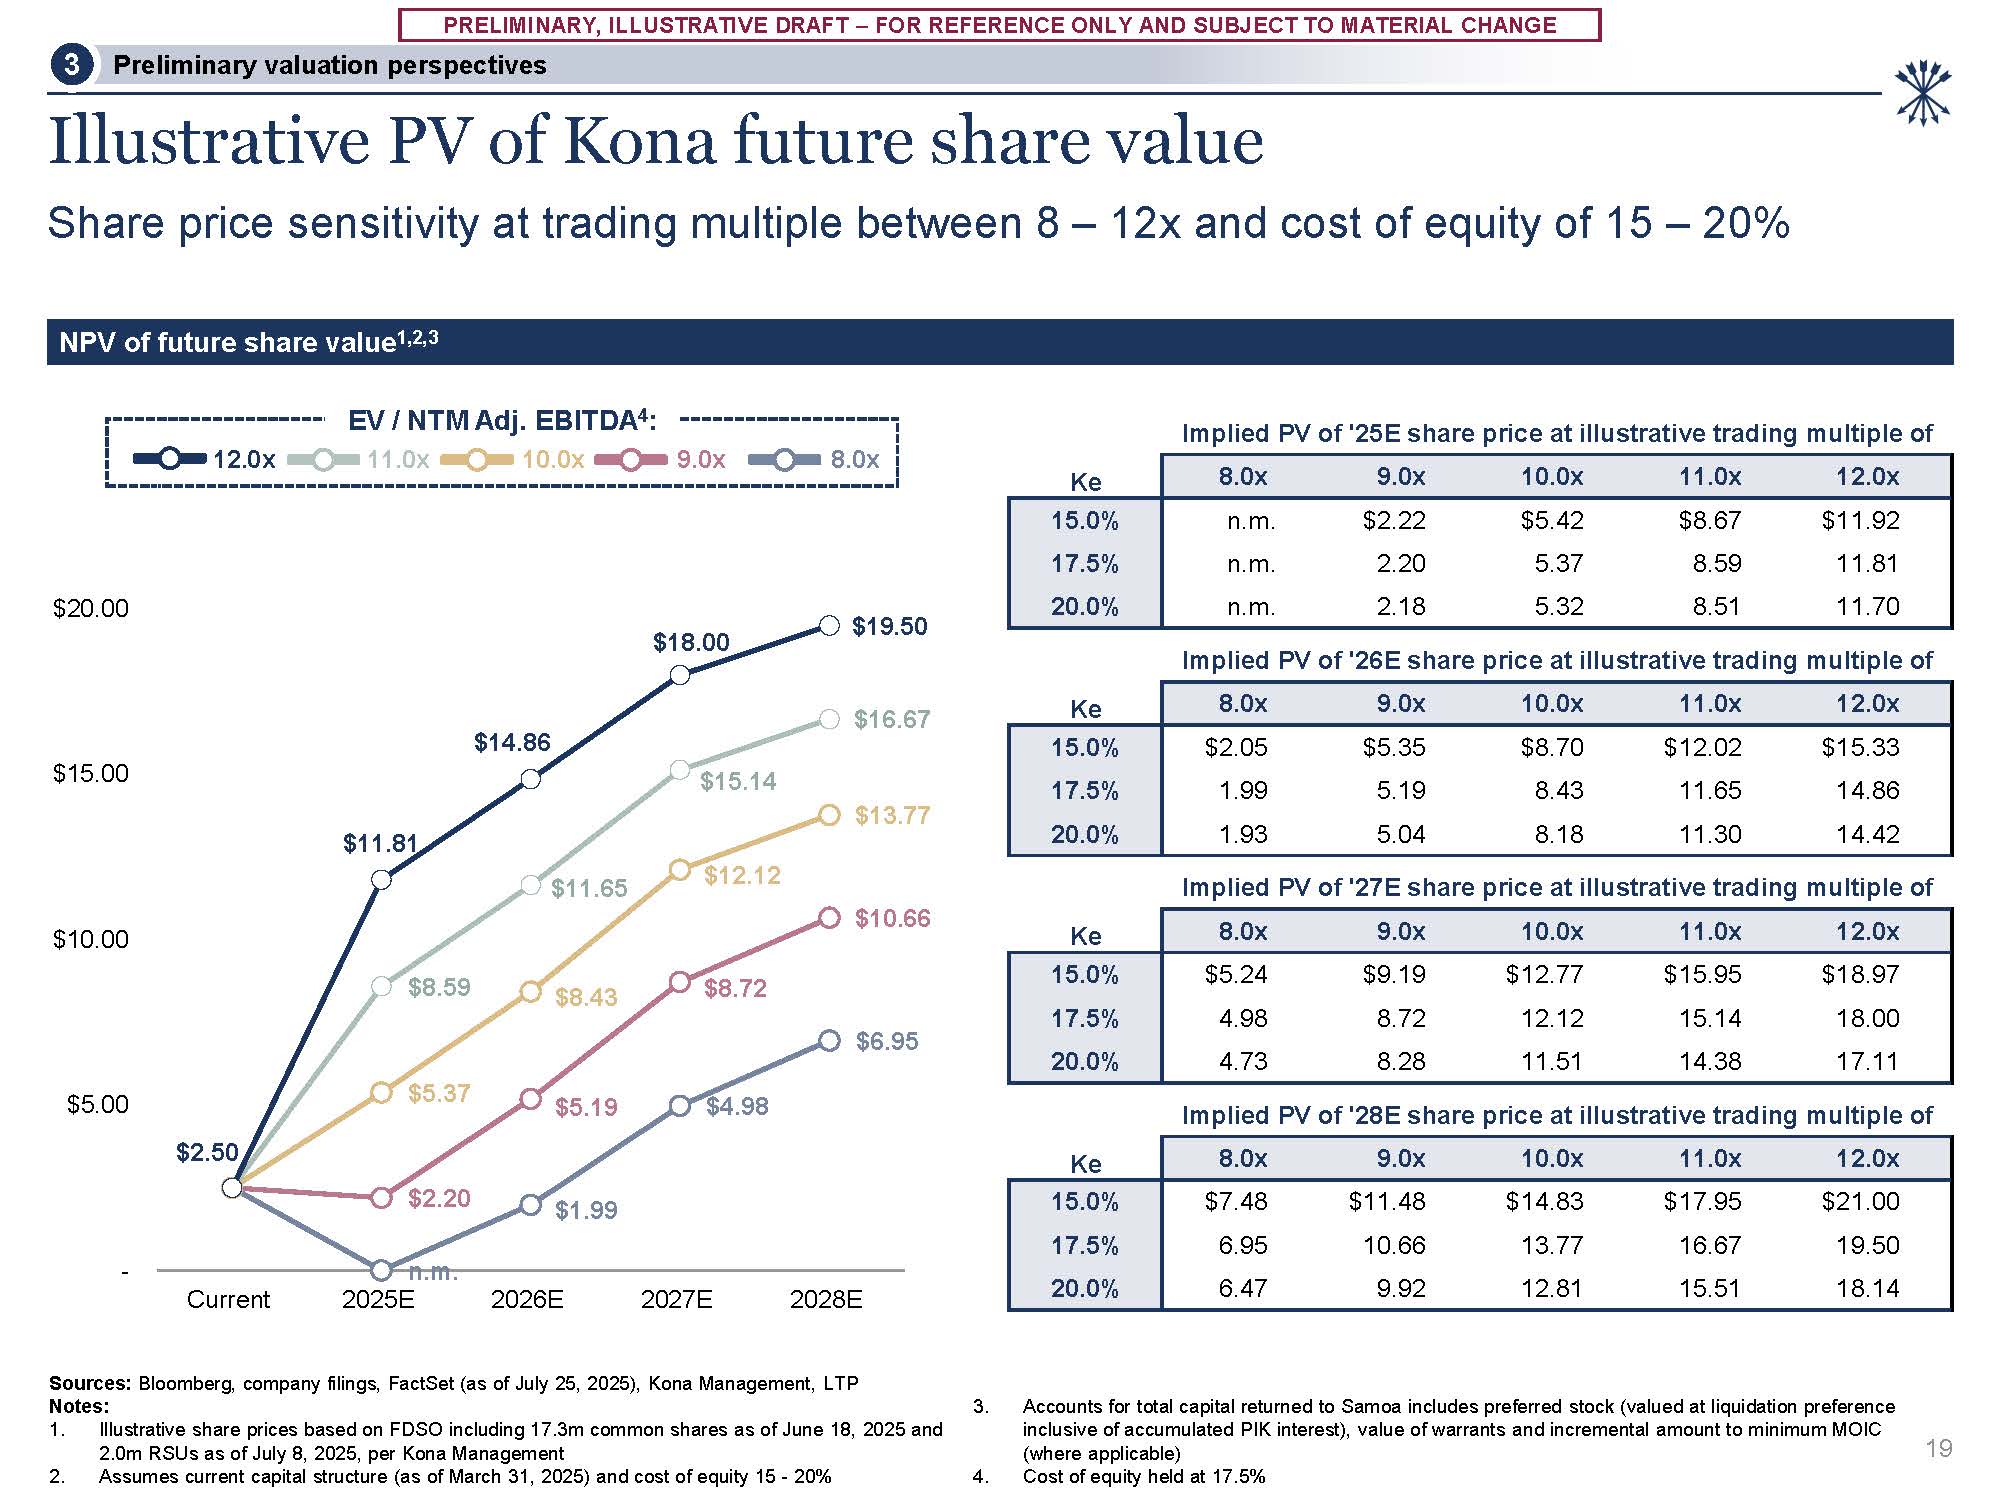
CHANGE Illustrative PV of Kona future share value Share price sensitivity at trading multiple between 8 – 12x and cost of equity of 15 – 20% Sources: Bloomberg, company filings, FactSet (as of July 25, 2025), Kona Management, LTP Notes: 1.
Illustrative share prices based on FDSO including 17.3m common shares as of June 18, 2025 and 2.0m RSUs as of July 8, 2025, per Kona Management 2. Assumes current capital structure (as of March 31, 2025) and cost of equity 15 - 20% Accounts
for total capital returned to Samoa includes preferred stock (valued at liquidation preference inclusive of accumulated PIK interest), value of warrants and incremental amount to minimum MOIC (where applicable) Cost of equity held at
17.5% NPV of future share value1,2,3 9.0x 8.0x EV / NTM Adj. EBITDA4: 11.0x 10.0x 12.0x 19 Preliminary valuation
perspectives 3 n.m. $1.99 $4.98 $6.95 $2.20 $5.19 $8.72 $10.66 $5.37 $8.43 $12.12 $13.77 $8.59 $11.65 $15.14 $16.67 $2.50 $11.81 $14.86 $18.00 $19.50 - $5.00 $10.00 $15.00 $20.00 Current 2025E 2026E 2027E 2028E Ke 8.0x 9.0x 10.0x 11.0x 12.0x 15.0% n.m. $2.22 $5.42 $8.67 $11.92 17.5% n.m. 2.20 5.37 8.59 11.81 20.0% n.m. 2.18 5.32 8.51 11.70 Ke 8.0x 9.0x 10.0x 11.0x 12.0x 15.0% $2.05 $5.35 $8.70 $12.02 $15.33 17.5% 1.99 5.19 8.43 11.65 14.86 20.0% 1.93 5.04 8.18 11.30 14.42 Ke 8.0x 9.0x 10.0x 11.0x 12.0x 15.0% $5.24 $9.19 $12.77 $15.95 $18.97 17.5% 4.98 8.72 12.12 15.14 18.00 20.0% 4.73 8.28 11.51 14.38 17.11 Ke 8.0x 9.0x 10.0x 11.0x 12.0x 15.0% $7.48 $11.48 $14.83 $17.95 $21.00 17.5% 6.95 10.66 13.77 16.67 19.50 20.0% 6.47 9.92 12.81 15.51 18.14 Implied
PV of '25E share price at illustrative trading multiple of Implied PV of '26E share price at illustrative trading multiple of Implied PV of '27E share price at illustrative trading multiple of Implied PV of '28E share price at illustrative
trading multiple of
PRELIMINARY, ILLUSTRATIVE DRAFT – FOR REFERENCE ONLY AND SUBJECT TO MATERIAL
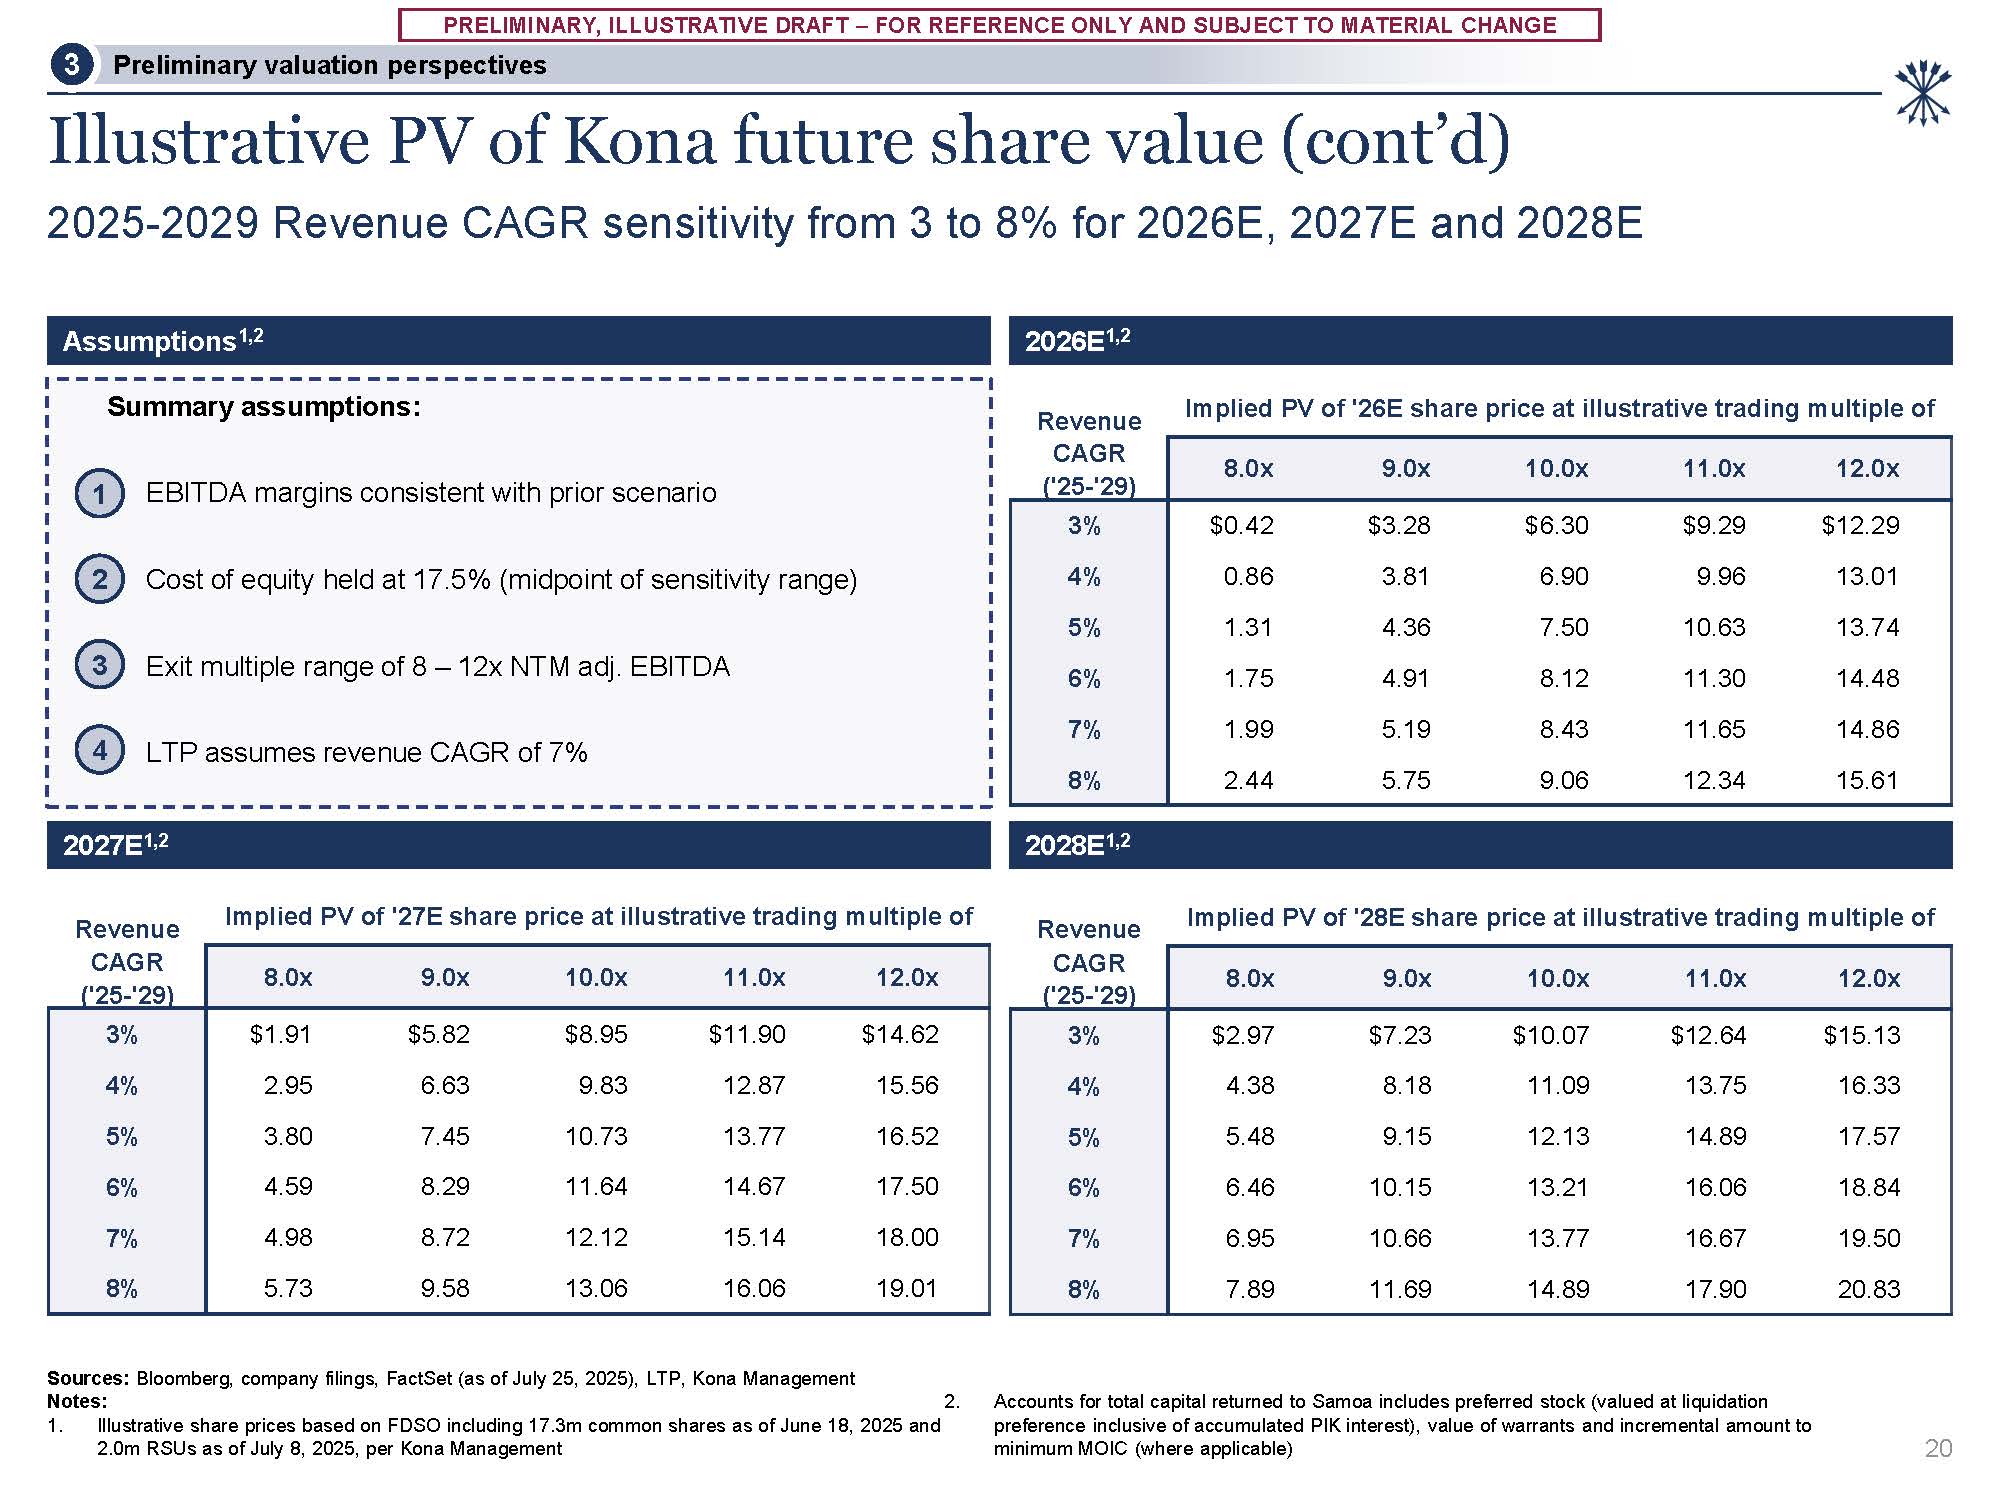
CHANGE Illustrative PV of Kona future share value (cont’d) 2025-2029 Revenue CAGR sensitivity from 3 to 8% for 2026E, 2027E and 2028E Assumptions1,2 2026E1,2 Summary assumptions: 1 EBITDA margins consistent with prior scenario 2 Cost
of equity held at 17.5% (midpoint of sensitivity range) 3 Exit multiple range of 8 – 12x NTM adj. EBITDA 4 LTP assumes revenue CAGR of 7% Sources: Bloomberg, company filings, FactSet (as of July 25, 2025), LTP, Kona Management Notes: 1.
Illustrative share prices based on FDSO including 17.3m common shares as of June 18, 2025 and 2.0m RSUs as of July 8, 2025, per Kona Management 2. Accounts for total capital returned to Samoa includes preferred stock (valued at liquidation
preference inclusive of accumulated PIK interest), value of warrants and incremental amount to minimum MOIC (where applicable) 2027E1,2 2028E1,2 20 Preliminary valuation perspectives 3 Revenue Implied PV of '26E share price at
illustrative trading multiple of CAGR
('25-'29) 8.0x 9.0x 10.0x 11.0x 12.0x 3% $0.42 $3.28 $6.30 $9.29 $12.29 4% 0.86 3.81 6.90 9.96 13.01 5% 1.31 4.36 7.50 10.63 13.74 6% 1.75 4.91 8.12 11.30 14.48 7% 1.99 5.19 8.43 11.65 14.86 8% 2.44 5.75 9.06 12.34 15.61 Revenue Implied
PV of '27E share price at illustrative trading multiple of CAGR
('25-'29) 8.0x 9.0x 10.0x 11.0x 12.0x 3% $1.91 $5.82 $8.95 $11.90 $14.62 4% 2.95 6.63 9.83 12.87 15.56 5% 3.80 7.45 10.73 13.77 16.52 6% 4.59 8.29 11.64 14.67 17.50 7% 4.98 8.72 12.12 15.14 18.00 8% 5.73 9.58 13.06 16.06 19.01 Revenue Implied
PV of '28E share price at illustrative trading multiple of CAGR
('25-'29) 8.0x 9.0x 10.0x 11.0x 12.0x 3% $2.97 $7.23 $10.07 $12.64 $15.13 4% 4.38 8.18 11.09 13.75 16.33 5% 5.48 9.15 12.13 14.89 17.57 6% 6.46 10.15 13.21 16.06 18.84 7% 6.95 10.66 13.77 16.67 19.50 8% 7.89 11.69 14.89 17.90 20.83
PRELIMINARY, ILLUSTRATIVE DRAFT – FOR REFERENCE ONLY AND SUBJECT TO MATERIAL
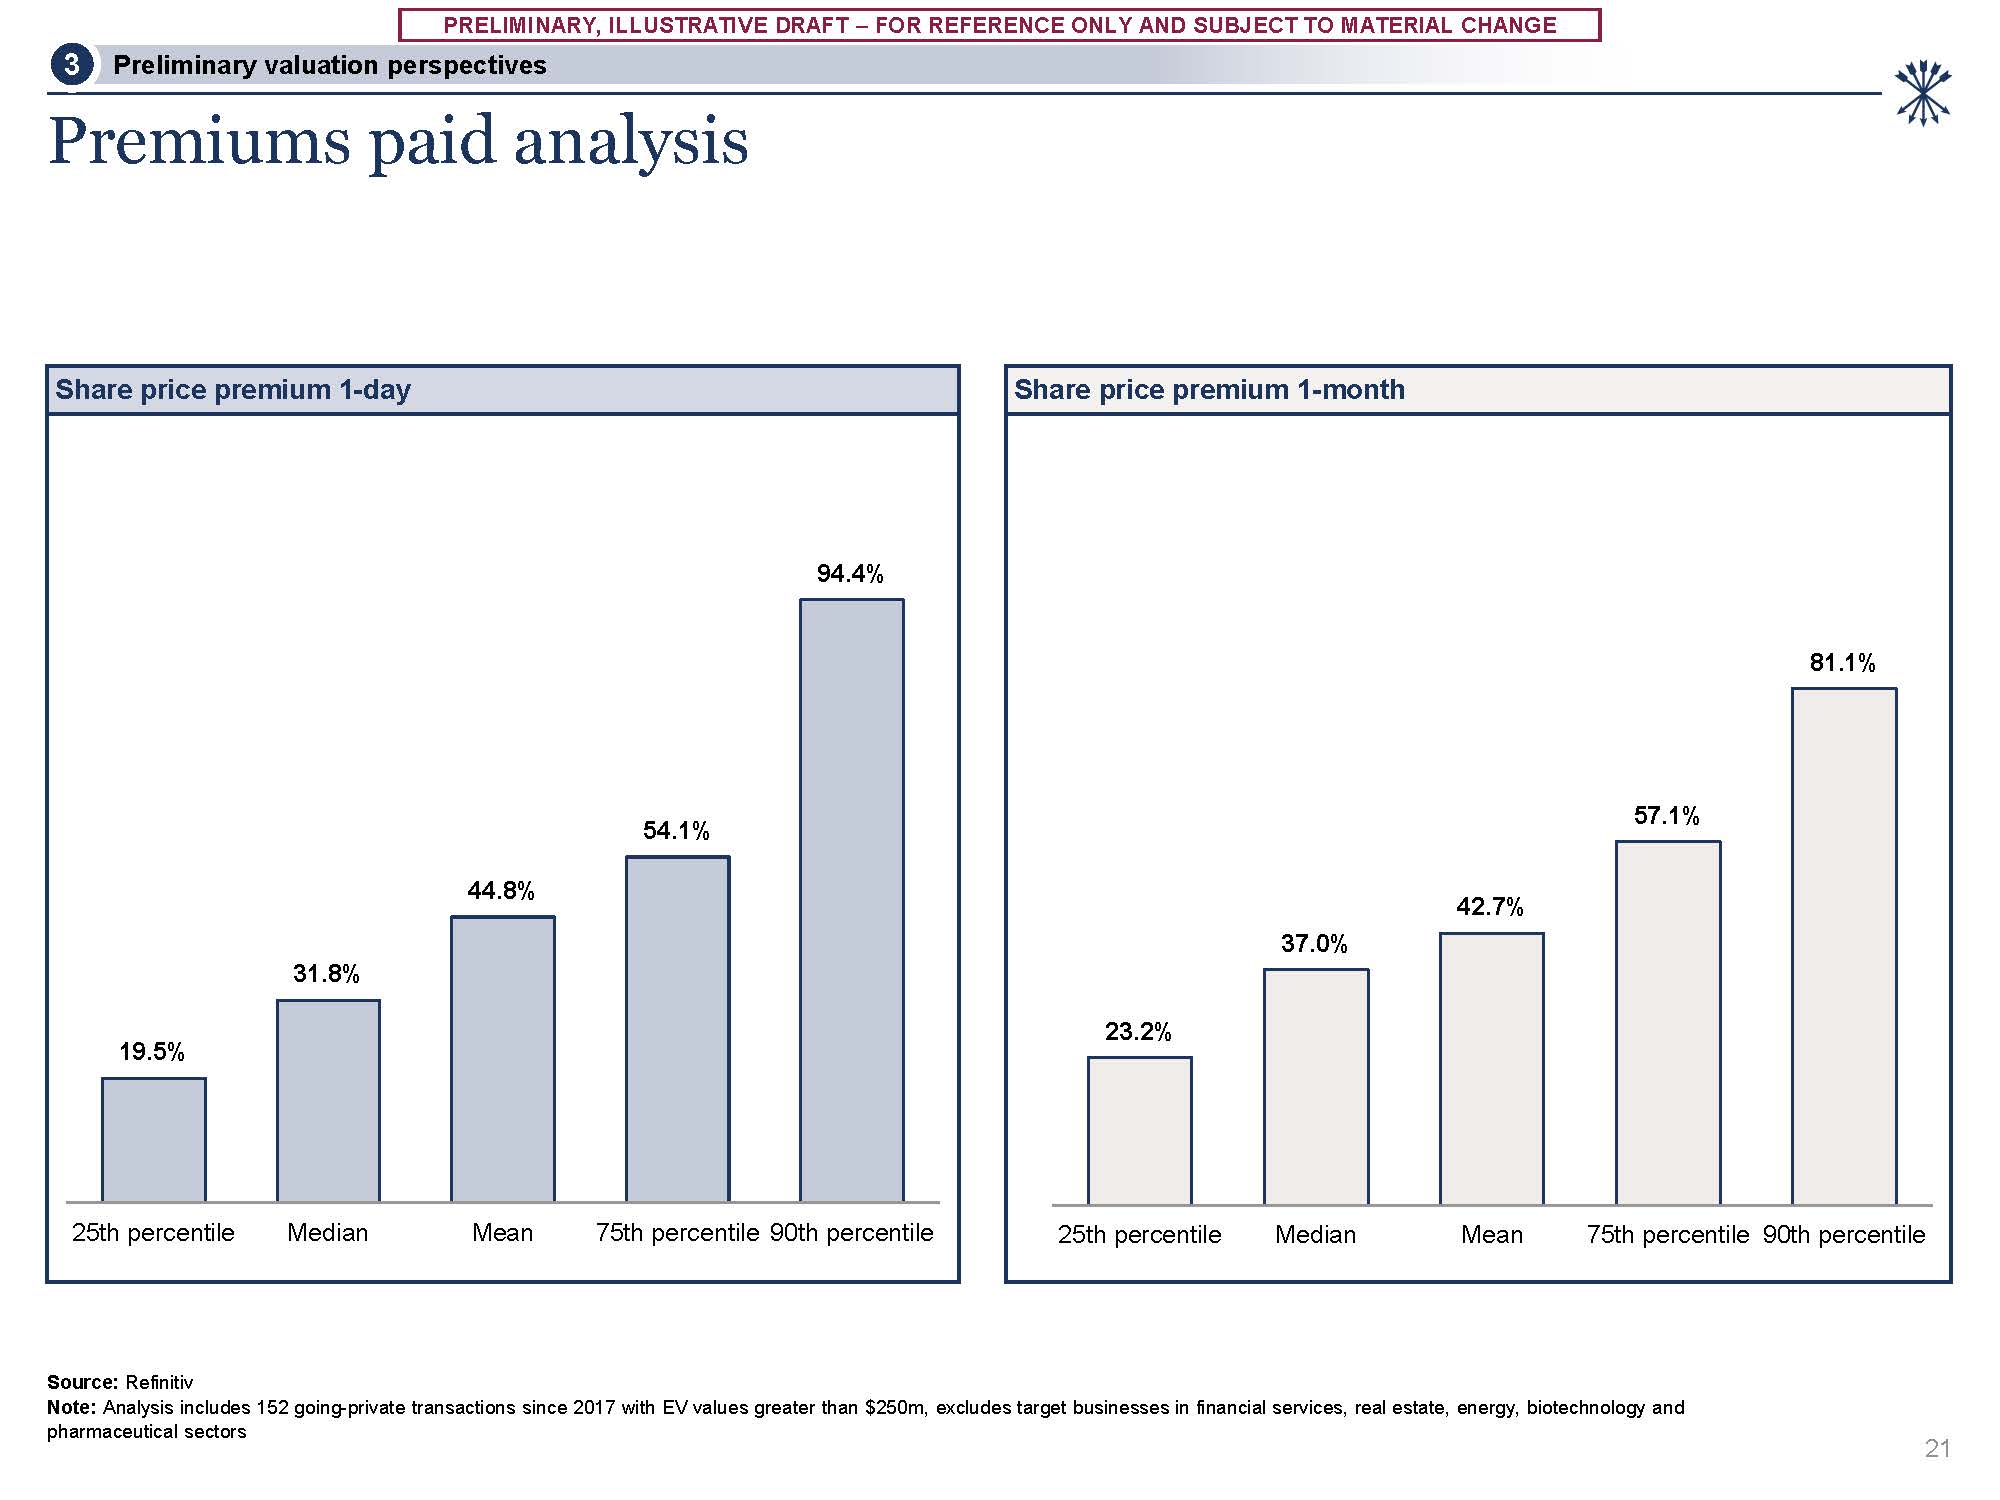
CHANGE Share price premium 1-day 19.5% 31.8% 44.8% 54.1% 94.4% 25th percentile Median Mean 75th percentile 90th percentile Premiums paid analysis Share price premium 1-month Source: Refinitiv Note: Analysis includes 152
going-private transactions since 2017 with EV values greater than $250m, excludes target businesses in financial services, real estate, energy, biotechnology and pharmaceutical sectors 21 23.2% 37.0% 42.7% 57.1% 81.1% 25th
percentile Median Mean 75th percentile 90th percentile Preliminary valuation perspectives 3

Appendices
Appendix A Additional valuation support
PRELIMINARY, ILLUSTRATIVE DRAFT – FOR REFERENCE ONLY AND SUBJECT TO MATERIAL
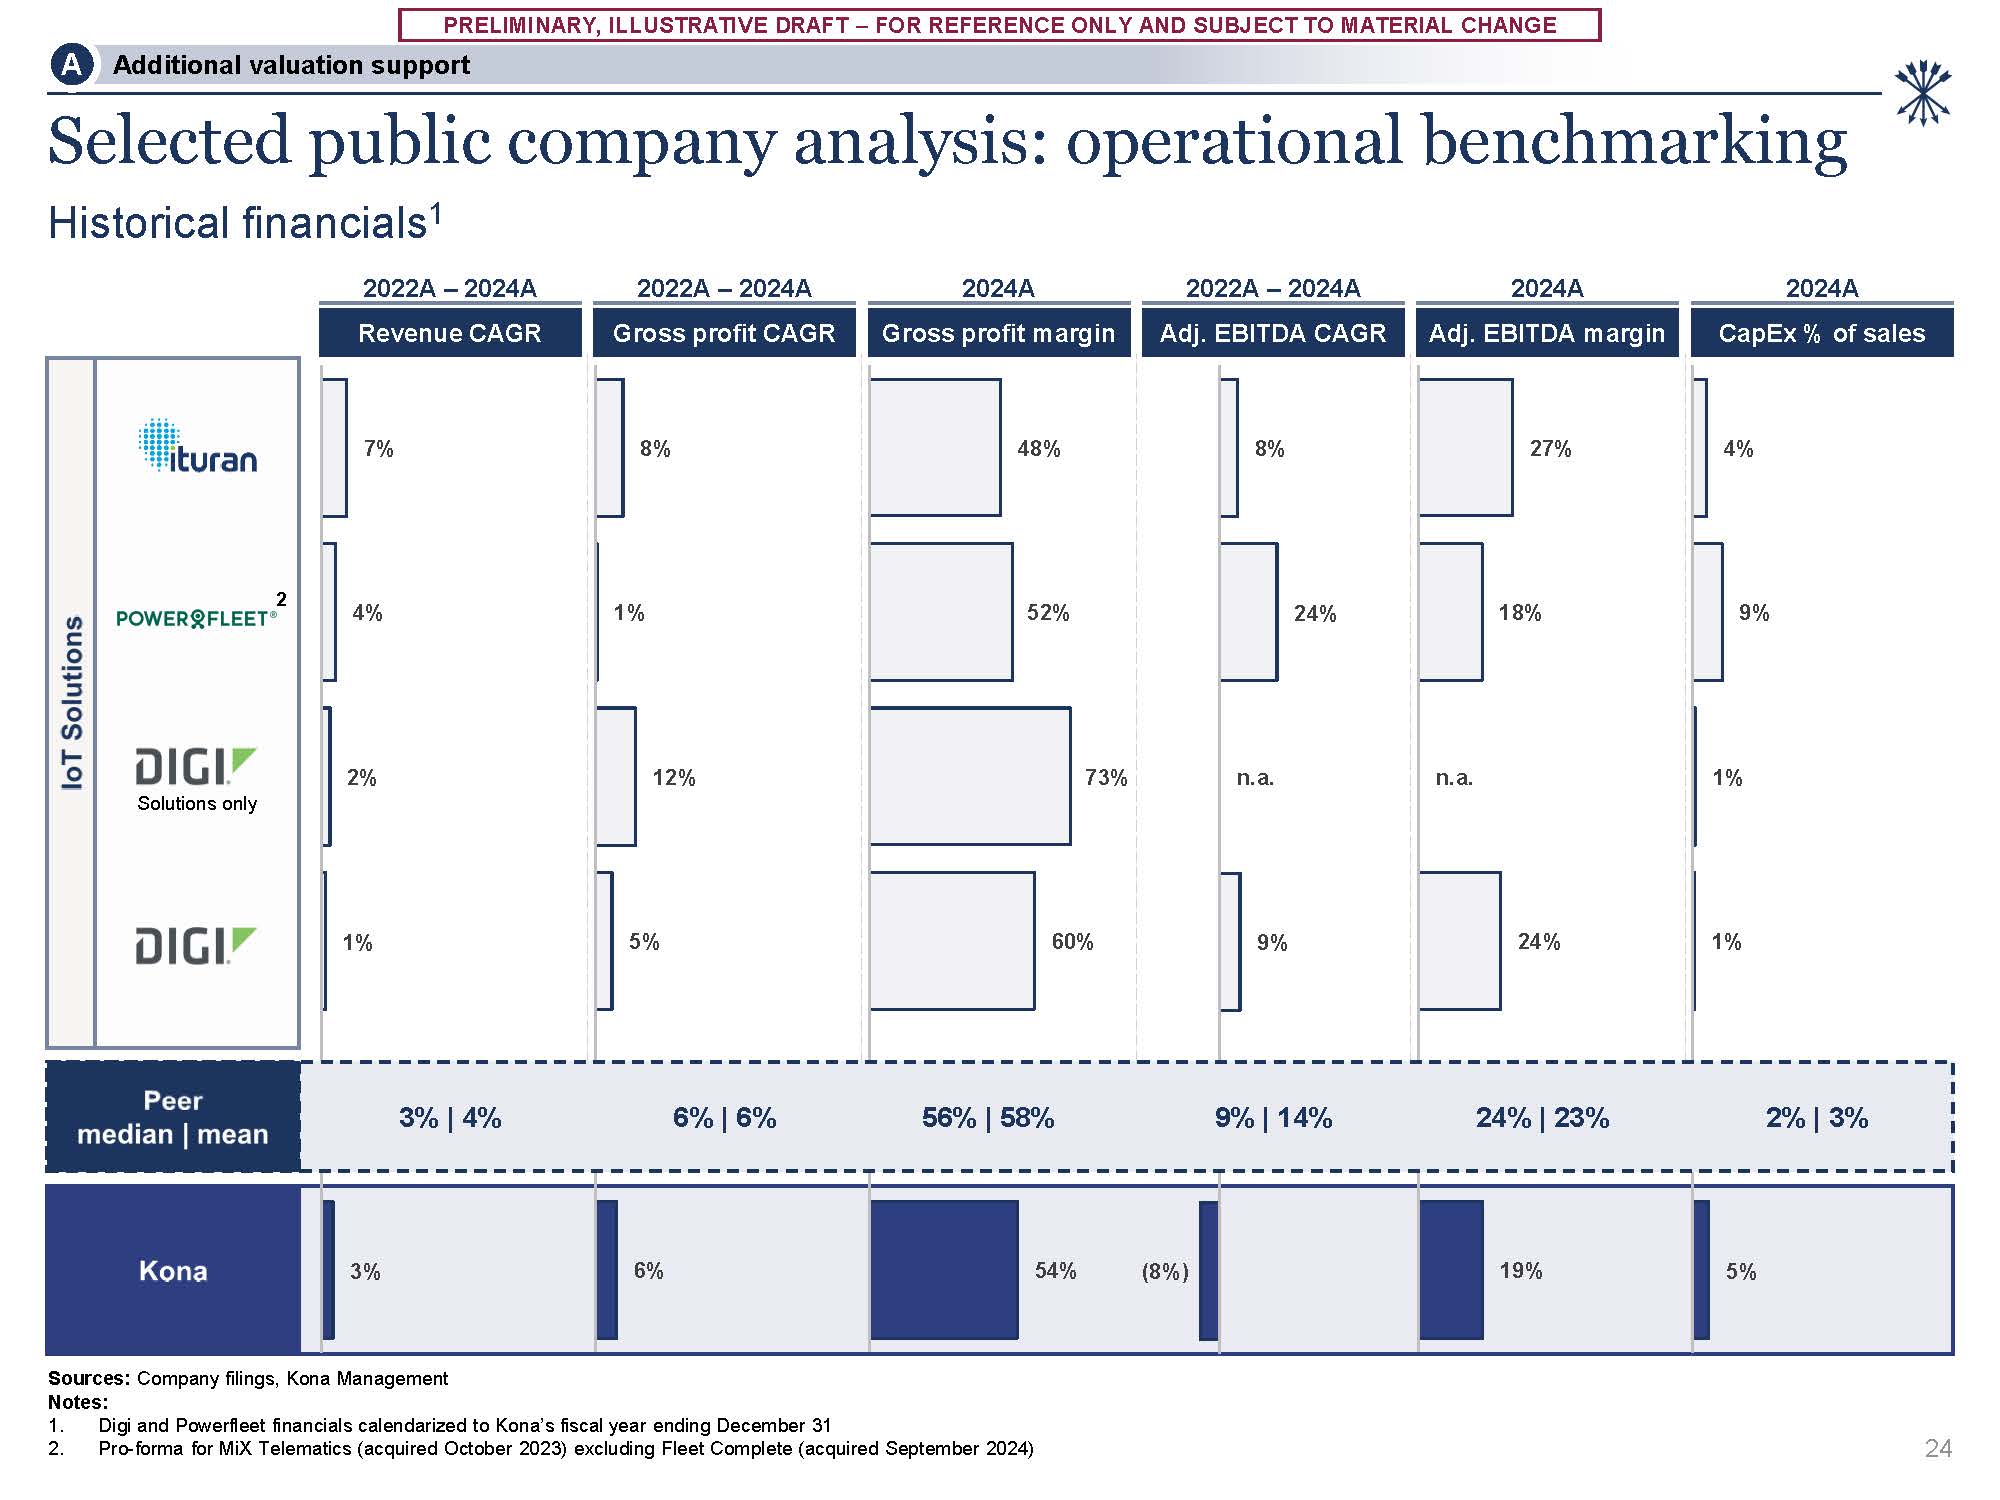
CHANGE 4% 9% 1% 1% 5% 27% 18% n.a. 24% 19% 7% 4% 2% 1% 3% 8% 1% 12% 5% 6% 48% 52% 73% 60% 54% 8% 24% n.a. 9% (8%) 24 Selected public company analysis: operational benchmarking Historical financials1 2022A –
2024A 2022A – 2024A 2024A 2022A – 2024A 2024A 2024A 3% | 4% 6% | 6% 56% | 58% 9% | 14% 24% | 23% 2% | 3% Gross profit CAGR Gross profit margin Adj. EBITDA CAGR Adj. EBITDA margin CapEx % of sales Revenue CAGR Solutions
only 2 Sources: Company filings, Kona Management Notes: Digi and Powerfleet financials calendarized to Kona’s fiscal year ending December 31 Pro-forma for MiX Telematics (acquired October 2023) excluding Fleet Complete (acquired September
2024) Additional valuation support A
PRELIMINARY, ILLUSTRATIVE DRAFT – FOR REFERENCE ONLY AND SUBJECT TO MATERIAL
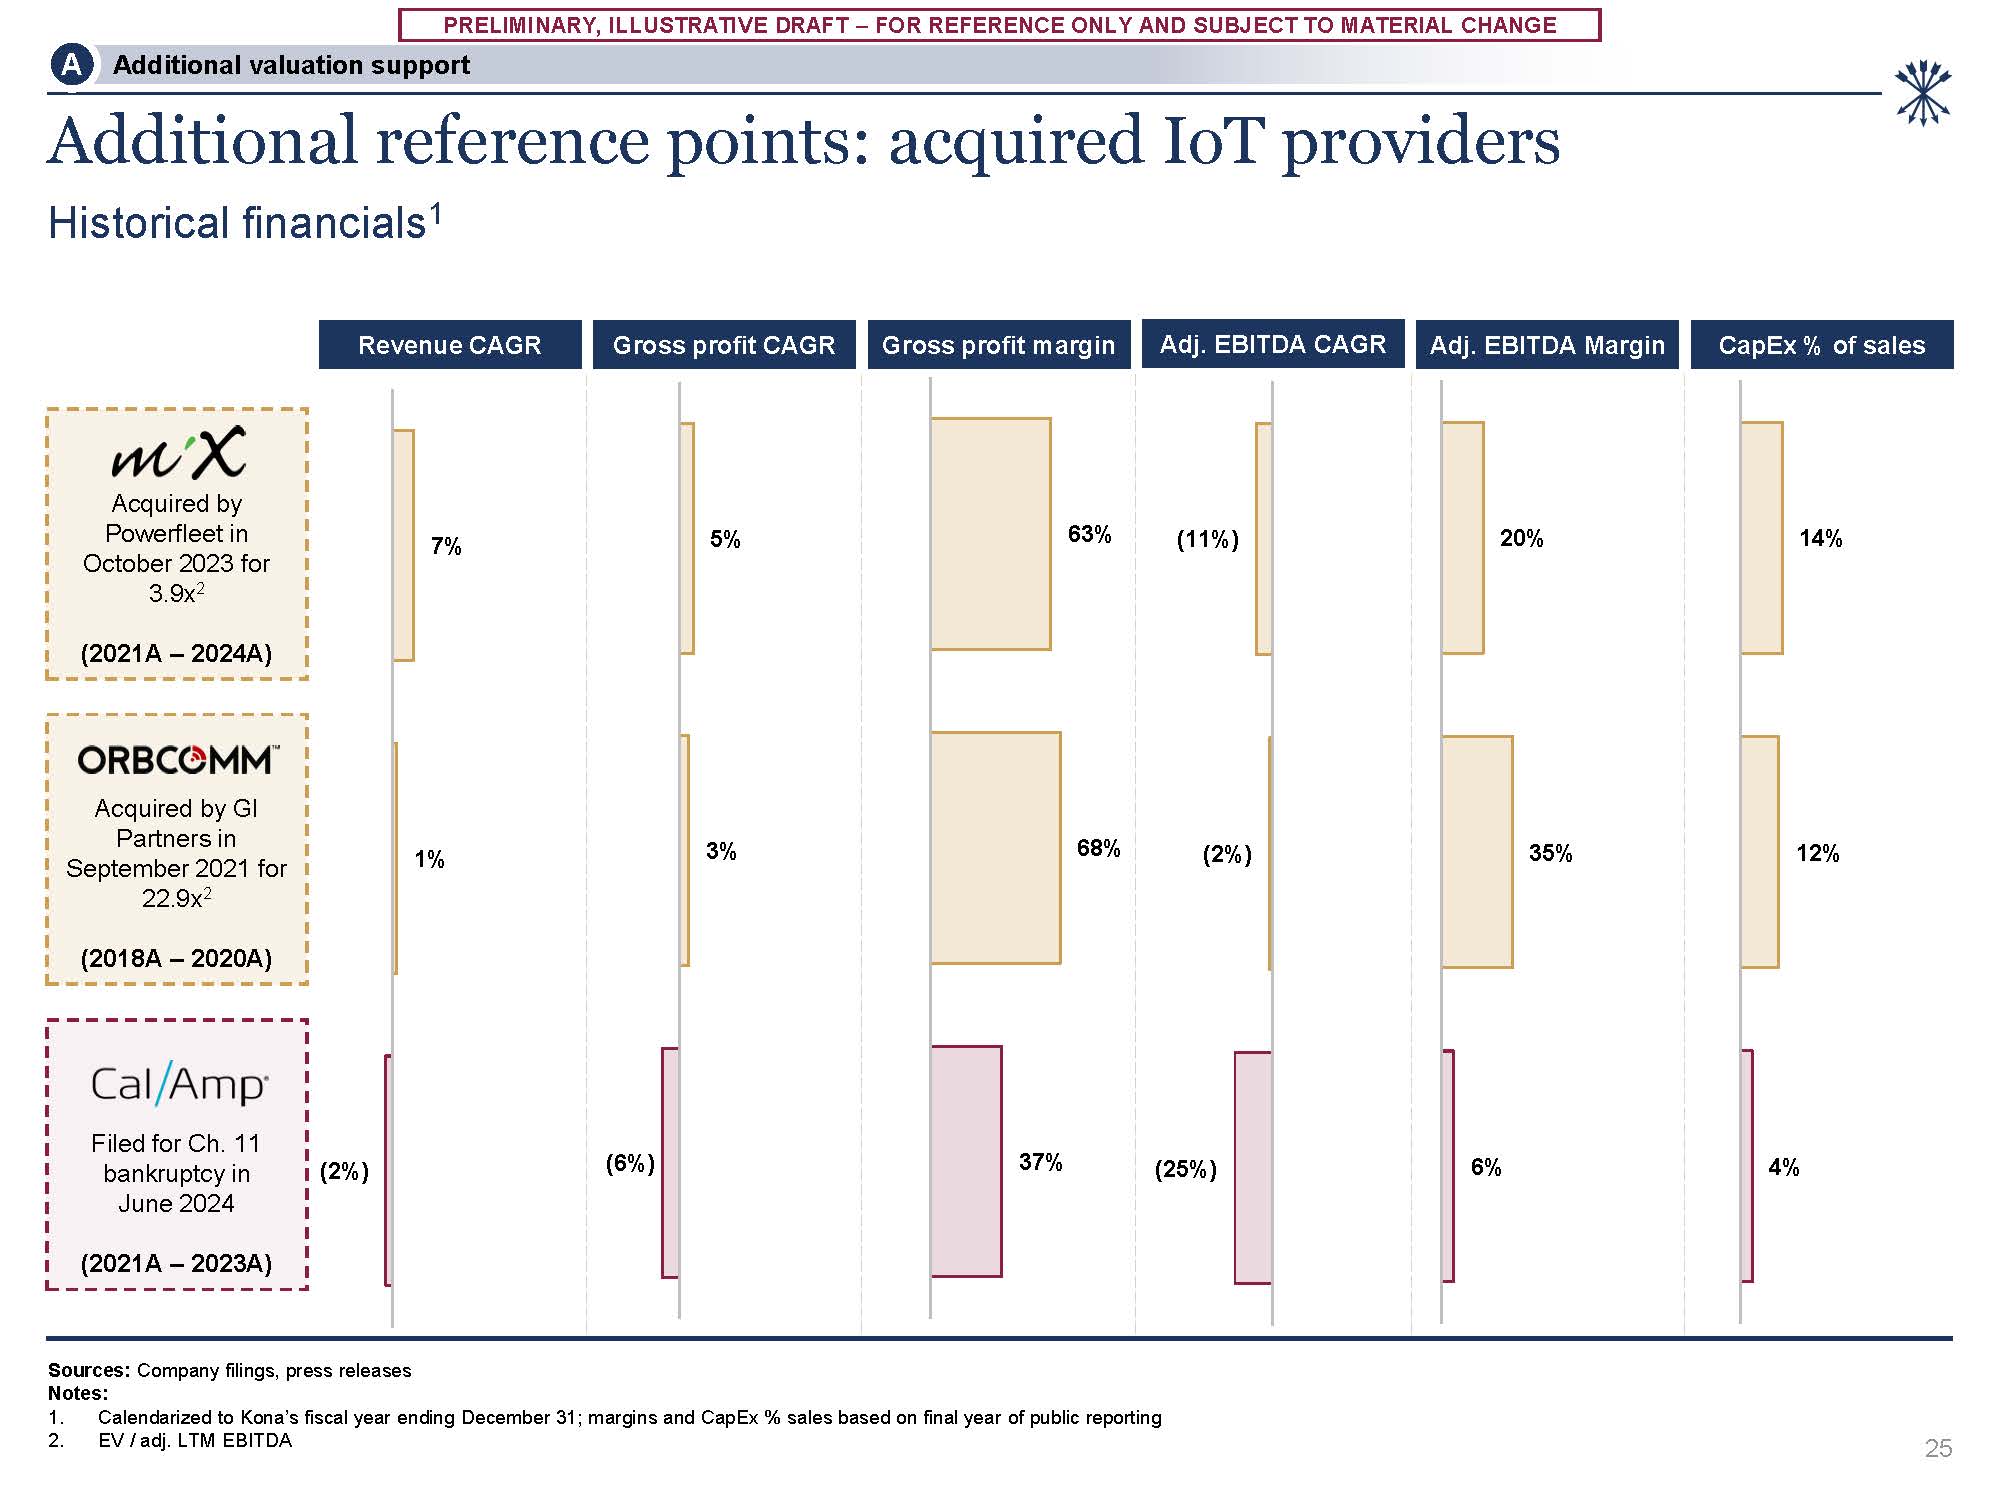
CHANGE Additional reference points: acquired IoT providers Historical financials1 Sources: Company filings, press releases Notes: Calendarized to Kona’s fiscal year ending December 31; margins and CapEx % sales based on final year of
public reporting EV / adj. LTM EBITDA Filed for Ch. 11 bankruptcy in June 2024 (2021A – 2023A) Acquired by Powerfleet in October 2023 for 3.9x2 (2021A – 2024A) Acquired by GI Partners in September 2021 for 22.9x2 (2018A – 2020A) Revenue
CAGR CapEx % of sales Additional valuation support A 25 7% 1% (2%) %) Gross profit CAGR Gross profit margin Adj. EBITDA CAGR Adj. EBITDA Margin 5% 3% (6%) 63% 68% 37% (11%) (2 (25%) 20% 35% 6% 14% 12% 4%
PRELIMINARY, ILLUSTRATIVE DRAFT – FOR REFERENCE ONLY AND SUBJECT TO MATERIAL
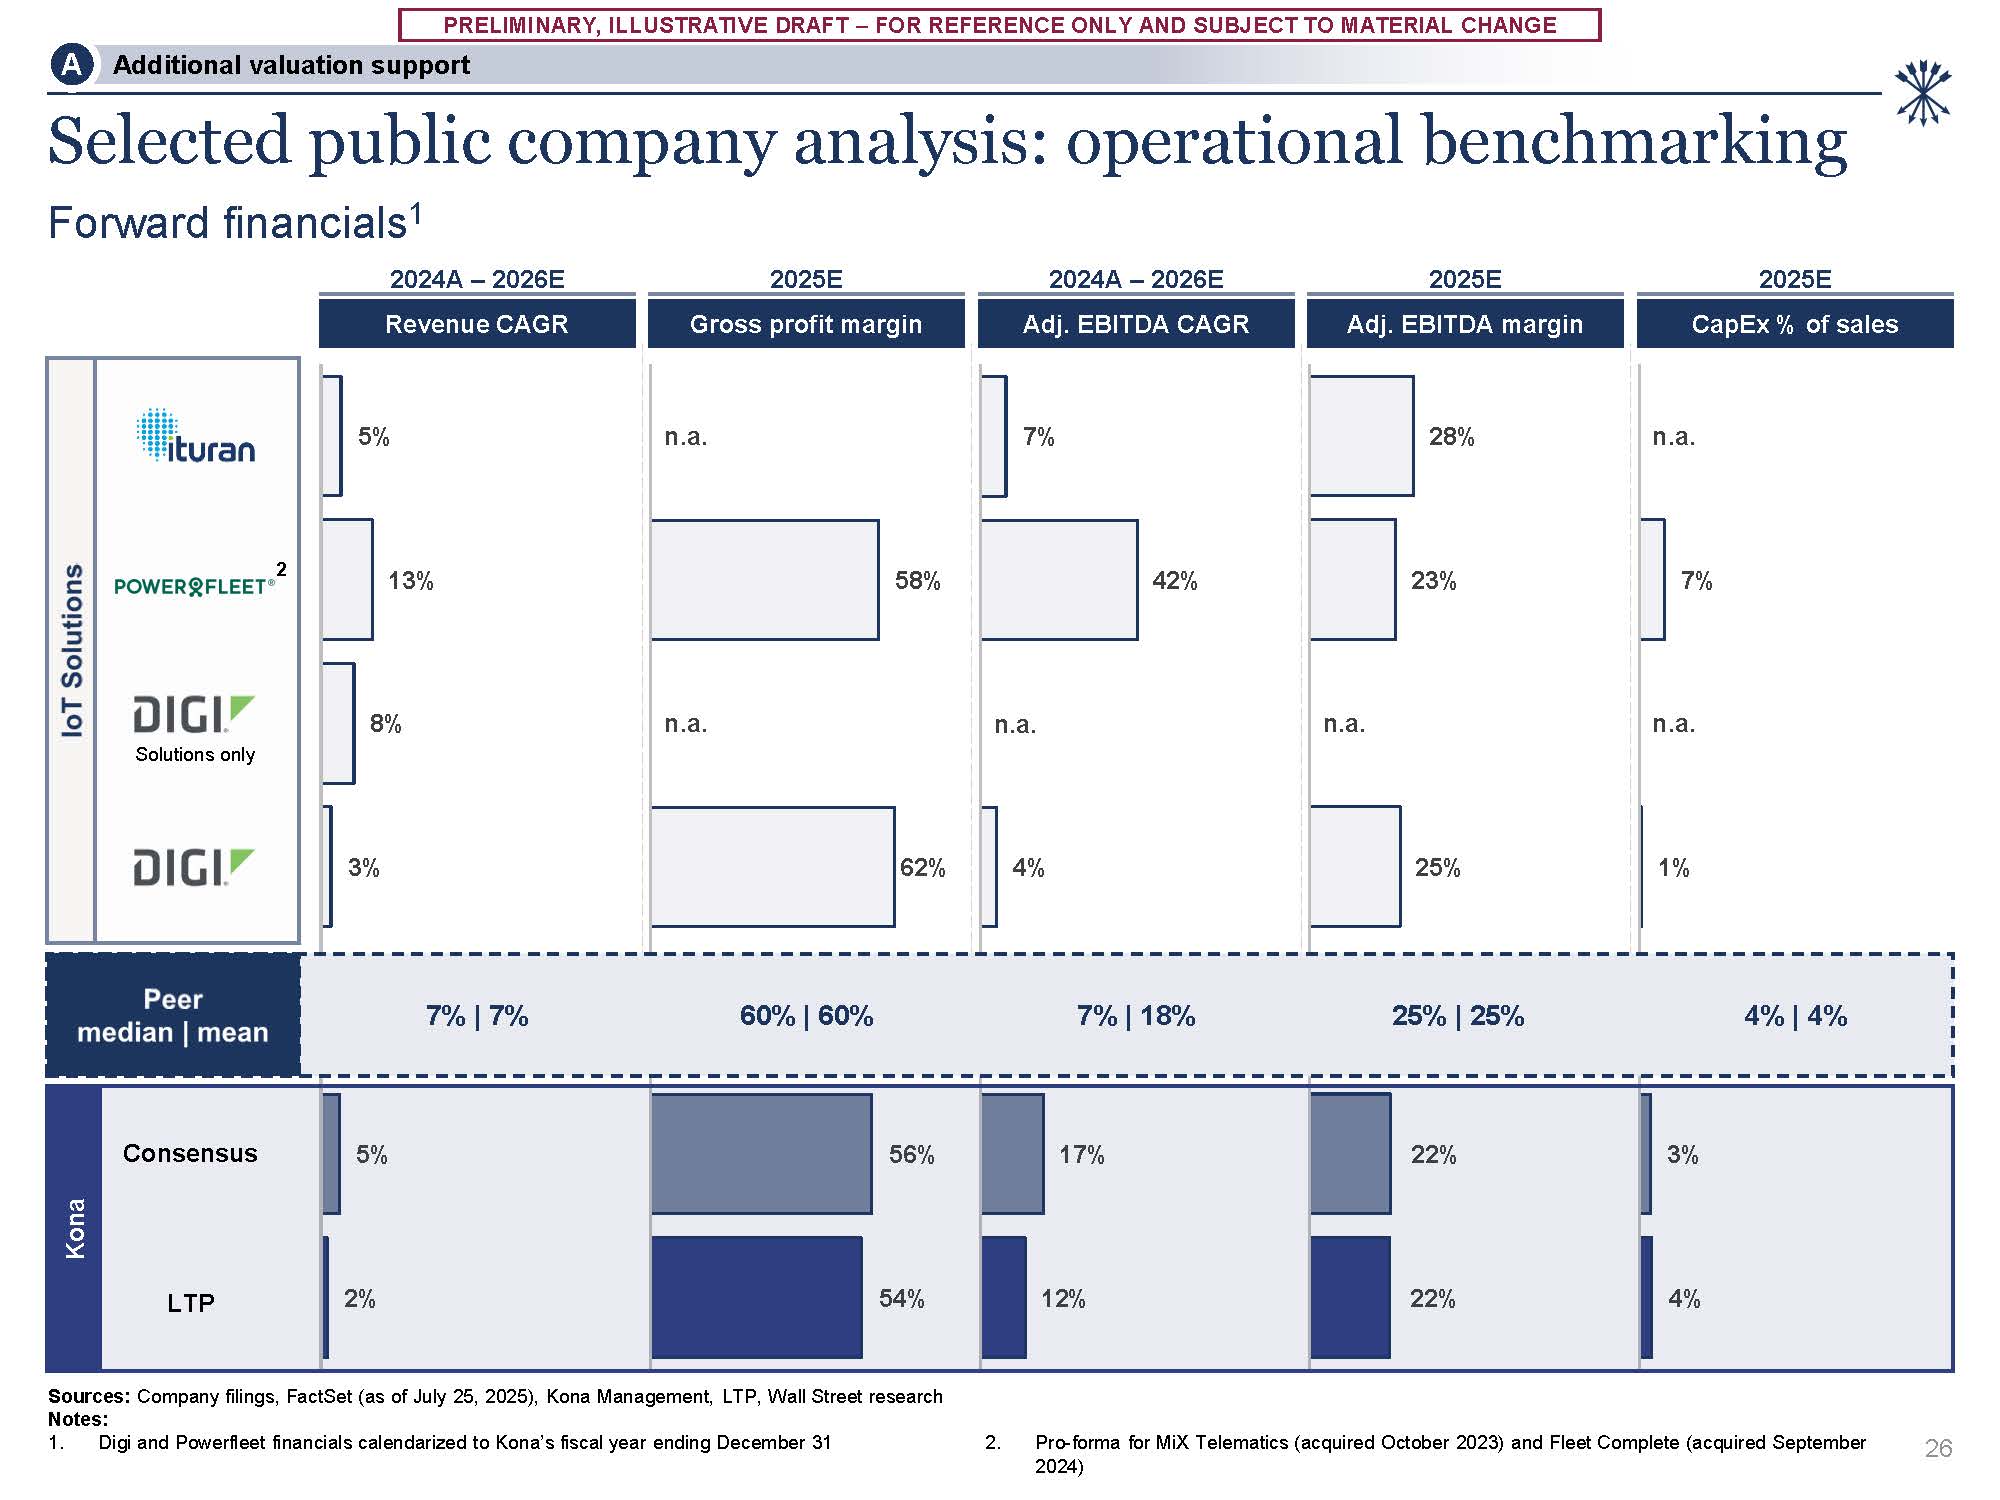
CHANGE 5% 13% 8% 3% 5% 2% n.a. 58% n.a. 62% 56% 54% 7% 42% n.a. 4% 17% 12% 28% 23% n.a. 25% 22% 22% n.a. 7% n.a. 1% 3% 4% Kona Consensus LTP 26 Sources: Company filings, FactSet (as of July 25, 2025), Kona
Management, LTP, Wall Street research Notes: 1. Digi and Powerfleet financials calendarized to Kona’s fiscal year ending December 31 2. Pro-forma for MiX Telematics (acquired October 2023) and Fleet Complete (acquired September
2024) Additional valuation support A Selected public company analysis: operational benchmarking Forward financials1 2024A – 2026E 2025E 2024A – 2026E 2025E 2025E Gross profit margin Adj. EBITDA CAGR Adj. EBITDA margin CapEx % of
sales Revenue CAGR 7% | 7% 60% | 60% 7% | 18% 25% | 25% 4% | 4% 2 Solutions only
PRELIMINARY, ILLUSTRATIVE DRAFT – FOR REFERENCE ONLY AND SUBJECT TO MATERIAL
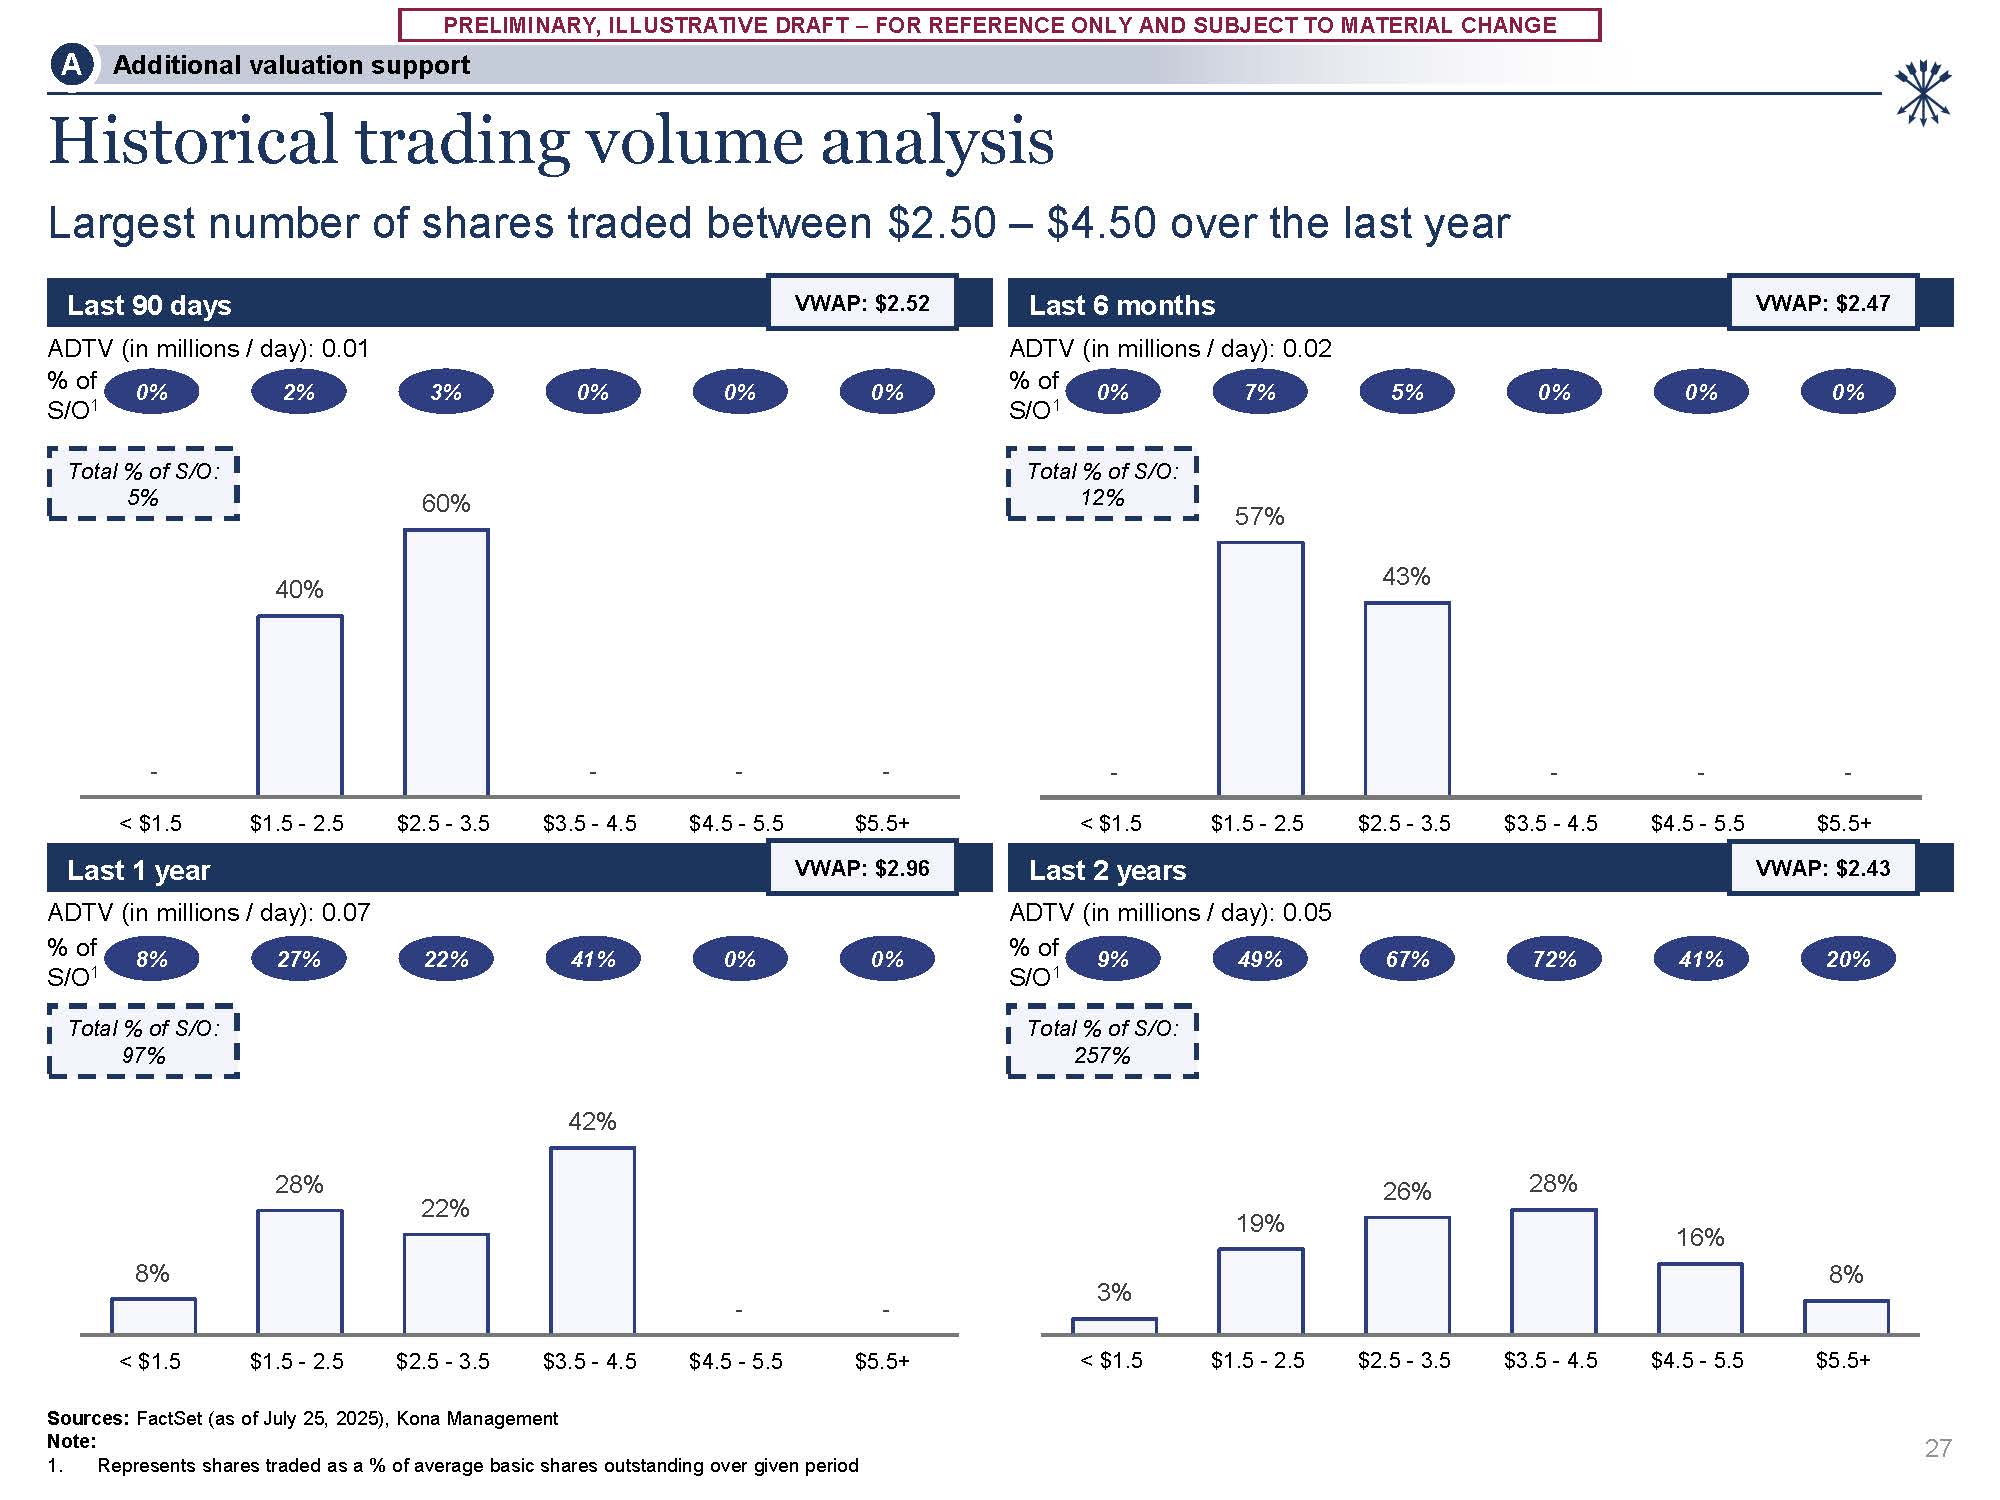
CHANGE - 57% 43% - - - < $1.5 $1.5 - 2.5 $2.5 - 3.5 $3.5 - 4.5 $4.5 - 5.5 $5.5+ 8% 28% 22% 42% - - < $1.5 $1.5 - 2.5 $2.5 - 3.5 $3.5 - 4.5 Sources: FactSet (as of July 25, 2025), Kona Management Note: $4.5 -
5.5 $5.5+ 3% 19% 26% 28% 16% 8% < $1.5 $1.5 - 2.5 $2.5 - 3.5 $3.5 - 4.5 $4.5 - 5.5 $5.5+ Last 90 days Last 6 months Last 1 year Last 2 years 1. Represents shares traded as a % of average basic shares outstanding over given
period VWAP: $2.52 VWAP: $2.47 ADTV (in millions / day): 0.01 % of VWAP: $2.96 ADTV (in millions / day): 0.07 % of VWAP: $2.43 ADTV (in millions / day): 0.05 % of S/O1 S/O1 3% 0% 2% ADTV (in millions / day): 0.02 %
of 0% 0% 0% S/O1 S/O1 Total % of S/O: 5% Total % of S/O: 12% Total % of S/O: 97% Total % of S/O: 257% 5% 0% 7% 0% 0% 0% 22% 8% 27% 41% 0% 0% 67% 9% 49% 72% 41% 20% Historical trading volume analysis Largest number of
shares traded between $2.50 – $4.50 over the last year Additional valuation support A 27 - 40% 60% - - - < $1.5 $1.5 - 2.5 $2.5 - 3.5 $3.5 - 4.5 $4.5 - 5.5 $5.5+

Appendix B Other supporting materials
PRELIMINARY, ILLUSTRATIVE DRAFT – FOR REFERENCE ONLY AND SUBJECT TO MATERIAL
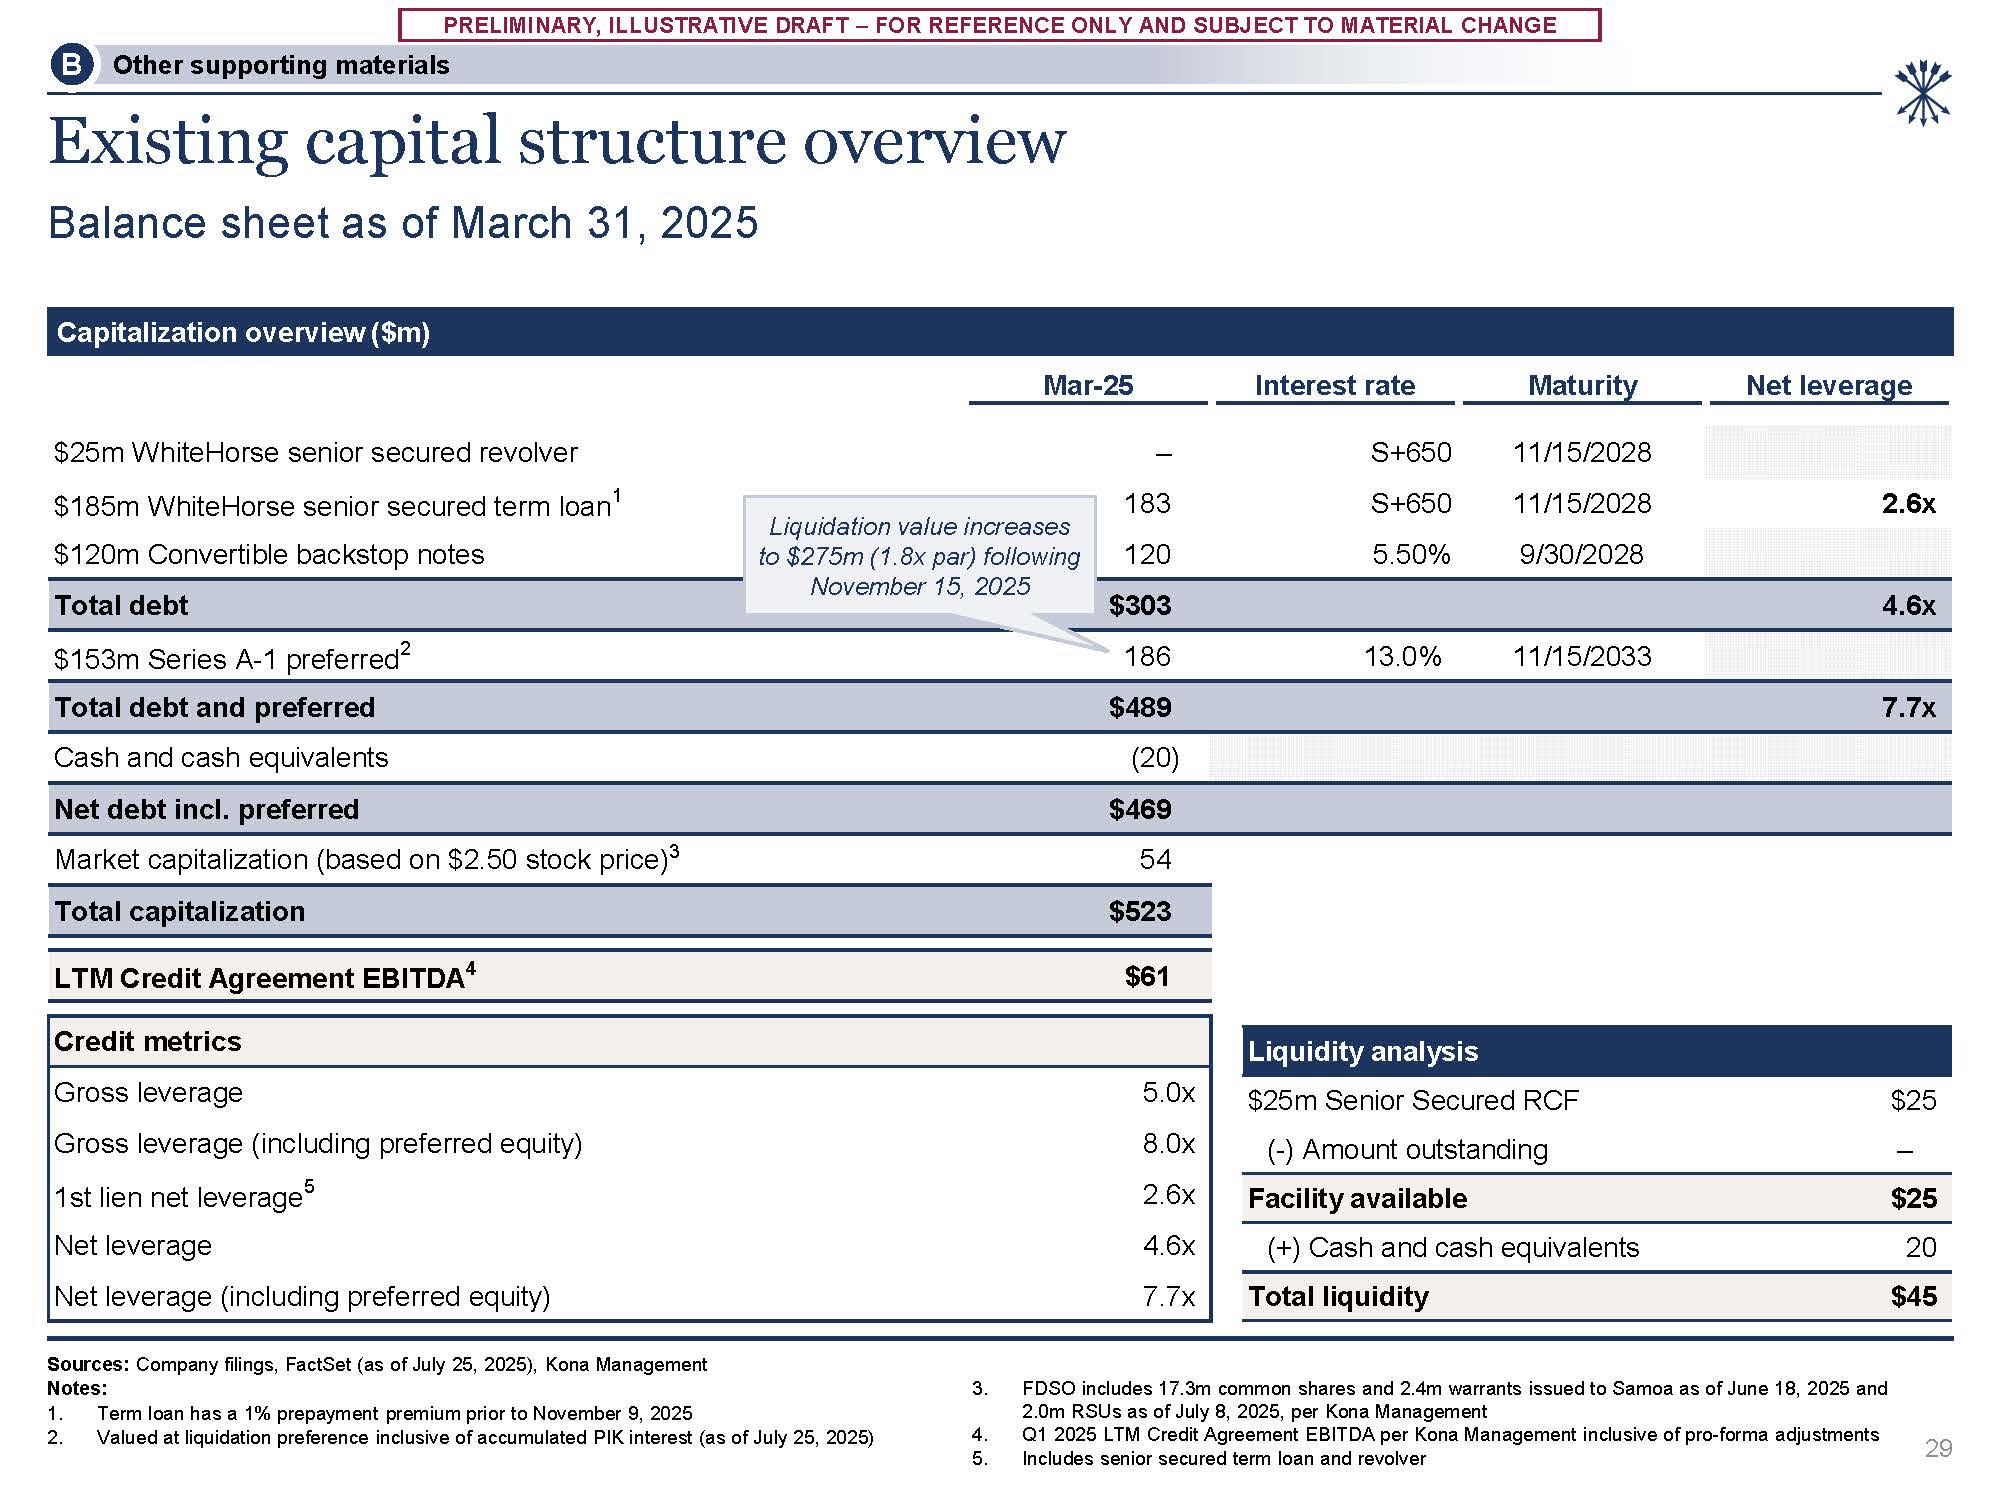
CHANGE Mar-25 Interest rate Maturity Net leverage $25m WhiteHorse senior secured revolver – 2.6x $185m WhiteHorse senior secured term loan1 $120m Convertible backstop notes 183 120 S+650 S+650
5.50% 11/15/2028 11/15/2028 9/30/2028 Total debt 4.6x $153m Series A-1 preferred2 $303 186 13.0% 11/15/2033 Credit metrics Gross leverage Gross leverage (including preferred equity) 1st lien net leverage5 Net leverage Net leverage
(including preferred equity) 5.0x 8.0x 2.6x 4.6x 7.7x Total debt and preferred $489 7.7x Cash and cash equivalents (20) Net debt incl. preferred $469 Market capitalization (based on $2.50 stock price)3 54 Total capitalization
$523 LTM Credit Agreement EBITDA4 $61 Existing capital structure overview Balance sheet as of March 31, 2025 Capitalization overview ($m) Sources: Company filings, FactSet (as of July 25, 2025), Kona Management Notes: Term loan has a 1%
prepayment premium prior to November 9, 2025 Valued at liquidation preference inclusive of accumulated PIK interest (as of July 25, 2025) FDSO includes 17.3m common shares and 2.4m warrants issued to Samoa as of June 18, 2025 and 2.0m RSUs as
of July 8, 2025, per Kona Management Q1 2025 LTM Credit Agreement EBITDA per Kona Management inclusive of pro-forma adjustments Includes senior secured term loan and revolver Other supporting materials B 29 Liquidation value increases to
$275m (1.8x par) following November 15, 2025 Liquidity analysis $25m Senior Secured RCF $25 (-) Amount outstanding – Facility available $25 (+) Cash and cash equivalents 20 Total liquidity $45
PRELIMINARY, ILLUSTRATIVE DRAFT – FOR REFERENCE ONLY AND SUBJECT TO MATERIAL
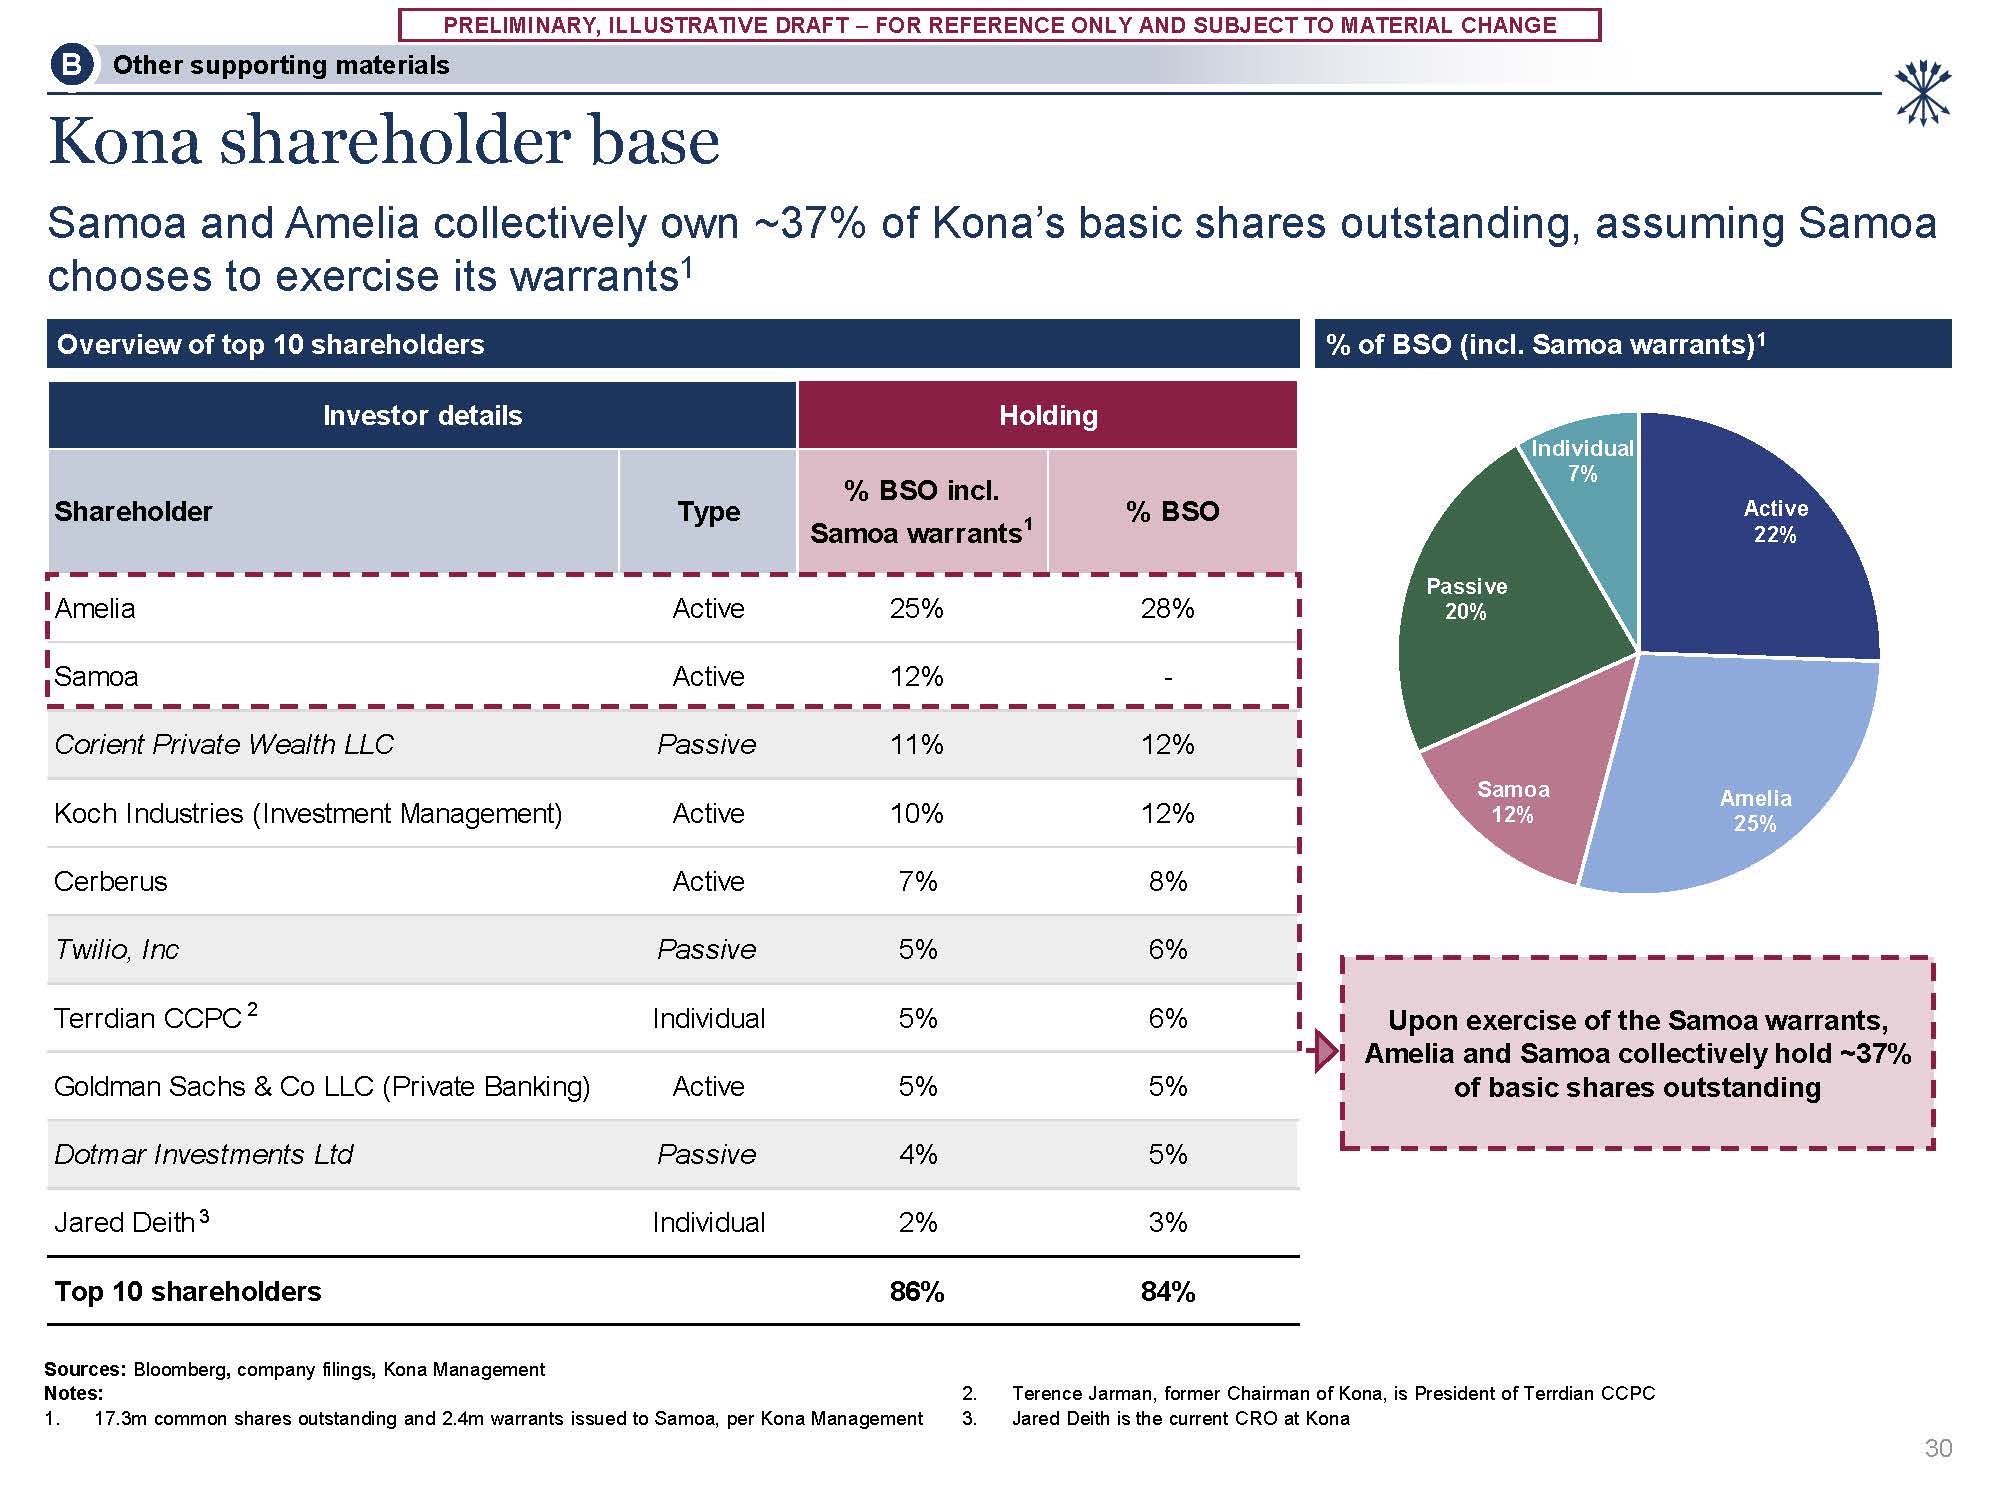
CHANGE Amelia 25% Samoa 12% Individual 7% Active 22% Passive 20% Overview of top 10 shareholders Investor details Holding Shareholder Type % BSO incl. Samoa warrants1 % BSO Amelia Active 25% 28% Samoa Active 12% - Corient
Private Wealth LLC Passive 11% 12% Koch Industries (Investment Management) Active 10% 12% Cerberus Active 7% 8% Twilio, Inc Passive 5% 6% Terrdian CCPC 2 Individual 5% 6% Goldman Sachs & Co LLC (Private Banking) Active 5% 5% Dotmar
Investments Ltd Passive 4% 5% Jared Deith3 Individual 2% 3% Top 10 shareholders 86% 84% % of BSO (incl. Samoa warrants)1 Kona shareholder base Samoa and Amelia collectively own ~37% of Kona’s basic shares outstanding, assuming
Samoa chooses to exercise its warrants1 Sources: Bloomberg, company filings, Kona Management Notes: 1. 17.3m common shares outstanding and 2.4m warrants issued to Samoa, per Kona Management Terence Jarman, former Chairman of Kona, is
President of Terrdian CCPC Jared Deith is the current CRO at Kona Other supporting materials B Upon exercise of the Samoa warrants, Amelia and Samoa collectively hold ~37% of basic shares outstanding 30