Year | Summary compensation table total for PEO Stedham(1) | Compensation actually paid to PEO Stedham(4) | Summary compensation table total for PEO Greenberg(2) | Compensation actually paid to PEO Greenberg(4) | Summary compensation table total for PEO White(3) | Compensation actually paid to PEO White(4) | Average summary compensation table total for non-PEO named executive officers(5) | Average compensation actually paid to non- named executive officers(6) | Value of initial fixed $100 investment based on Total shareholder return(7) | Net income (loss) (in | ||||||||||||||||||||||||||||||
| 2025 | $ | 347,813 | $ | (122,498 | ) | N/A | N/A | N/A | N/A | $ | 153,007 | $ | 121,822 | $ | 51.79 | $ | (4,905 | ) | ||||||||||||||||||||||
| 2024 | $ | 312,094 | $ | 485,758 | N/A | N/A | N/A | N/A | $ | 230,194 | $ | 223,757 | $ | 42.83 | $ | (3,824 | ) | |||||||||||||||||||||||
| 2023 | $ | 1,145,819 | $ | 538,126 | $ | 213,069 | $ | 113,941 | $ | 396,177 | $ | 232,100 | $ | 351,550 | $ | 309,172 | $ | 31.11 | $ | (3,390 | ) | |||||||||||||||||||
| 1. | Reflects compensation for Adam Stedham, VerifyMe’s Chief Executive Officer for the years ended December 31, 2025 and 2024 as reported in the Summary Compensation Table above. Mr. Stedham was appointed as VerifyMe’s Chief Executive Officer on June 19, 2023. Mr. Stedham’s compensation for 2023 is reported in the Summary Compensation Table in VerifyMe’s proxy statement filed with the SEC on September 8, 2025 and includes compensation for the time he served as a non-employee director during fiscal year 2023. |
| 2. | Reflects compensation for Scott Greenberg, who was VerifyMe’s Interim Chief Executive Officer during fiscal year 2023 as reported in the Summary Compensation Table in VerifyMe’s proxy statement filed with the SEC on April 25, 2024. Mr. Greenberg served as VerifyMe’s Interim Chief Executive Officer between March 14, 2023 and June 19, 2023. Mr. Greenberg’s compensation for fiscal year 2023 includes an award of restricted stock with a grant date value equal to $125,000 for his service as a director in fiscal year 2023. |
| 3. | Reflects compensation for Patrick White, VerifyMe’s prior Chief Executive Officer, for fiscal years ended December 31, 2023 and 2022 as reported in the Summary Compensation Table in VerifyMe’s proxy statement filed with the SEC on April 25, 2024. Mr. White served as VerifyMe’s Chief Executive Officer and as a director of the company until March 14, 2023. |
| 4. | The dollar amounts reported in this column represent the amount of “compensation actually paid,” or CAP, to the PEOs in the applicable fiscal year, as computed in accordance with the SEC’s pay versus performance disclosure rules. The dollar amounts do not necessarily reflect the actual amount of compensation earned by or paid to the PEOs during the applicable fiscal year. The following table provides additional information as to the amounts deducted from and added to the Summary Compensation Table Total for fiscal year 2025 for the PEOs pursuant to the SEC’s rules to determine CAP to the PEOs: |
| PEO Stedham | ||||
| 2025 | ||||
| Summary Compensation Table Total for PEO | $ | 347,813 | ||
| Adjustments for stock awards and option awards | ||||
| (Deduct): Aggregate value for stock awards and option awards included in SCT Total for the covered fiscal year | (32,813 | ) | ||
| Add: Fair value at year end of awards granted during the covered fiscal year that were outstanding and unvested at the covered fiscal year end | 11,265 | |||
| Add (Deduct): Year-over-year change in fair value at covered fiscal year end of awards granted in any prior fiscal year that were outstanding and unvested at the covered fiscal year end | (407,818 | ) | ||
| Add: Vesting date fair value of awards granted and vested during the covered fiscal year | ||||
| Add (Deduct): Change as of the vesting date (from the end of the prior fiscal year) in fair value of awards granted in any prior fiscal year for which vesting conditions were satisfied during the covered fiscal year | (40,945 | ) | ||
| (Deduct): Fair value at end of prior fiscal year of awards granted in any prior fiscal year that failed to meet the applicable vesting conditions during the covered fiscal year | ||||
| Add: Change in incremental fair value of awards modified during the covered fiscal year | ||||
| Add: Dividends or other earnings paid on awards in the covered fiscal year prior to vesting if not otherwise included in the SCT Total for the covered fiscal year | ||||
| Compensation “Actually Paid” to PEO | $ | (122,498 | ) | |
| 5. | Reflects the average compensation for the non-PEO NEOs in each respective year based on compensation amounts reported in the Summary Compensation Table for the applicable year above and in VerifyMe’s proxy statement filed with the SEC on September 8, 2025. The non-PEO NEOs for fiscal year ended December 31, 2025 are Jennifer Cola, VerifyMe’s Chief Financial Officer, and Fred G. Volk, III, VP of Operations, PeriShip Global. The non-PEO NEOs for the fiscal year ended December 31, 2024 are Nancy Meyers, VerifyMe’s prior Chief Financial Officer, Fred G. Volk, III, Curt Kole, VerifyMe’s prior EVP of Precision Logistics, and Paul Ryan, VerifyMe’s prior EVP, Authentication segment. The non-PEO NEOs for the fiscal year ended December 31, 2023 were Ms. Meyers and Mr. Kole. |
| 6. | The dollar amounts reported in this column represent the average amount of CAP to the non-PEO NEOs in the applicable fiscal year, as computed in accordance with the SEC’s pay versus performance disclosure rules. The dollar amounts do not necessarily reflect the actual average amount of compensation earned by or paid to the non-PEO NEOs during the applicable fiscal year. The following table provides additional information as to the amounts deducted from and added to the Average Summary Compensation Table Total for fiscal year ended December 31, 2025 for non-PEO NEOs pursuant to the SEC’s rules to determine Average CAP to non-PEO NEOs: |
| Other non-PEO NEOs (Average) | ||||
| 2025 | ||||
| Summary compensation table total for non-PEO NEOs | $ | 153,007 | ||
| Adjustments for stock awards and option awards | ||||
| (Deduct): Aggregate value for stock awards and option awards included in SCT Total for the covered fiscal year | (19,278 | ) | ||
| Add: Fair value at year end of awards granted during the covered fiscal year that were outstanding and unvested at the covered fiscal year end | 10,965 | |||
| Add (Deduct): Year-over-year change in fair value at covered fiscal year end of awards granted in any prior fiscal year that were outstanding and unvested at the covered fiscal year end | (19,866 | ) | ||
| Add: Vesting date fair value of awards granted and vested during the covered fiscal year | ||||
| Add (Deduct): Change as of the vesting date (from the end of the prior fiscal year) in fair value of awards granted in any prior fiscal year for which vesting conditions were satisfied during the covered fiscal year | (2,495 | ) | ||
| (Deduct): Fair value at end of prior fiscal year of awards granted in any prior fiscal year that failed to meet the applicable vesting conditions during the covered fiscal year | (511 | ) | ||
| Add: Change in incremental fair value of awards modified during the covered fiscal year | ||||
| Add: Dividends or other earnings paid on awards in the covered fiscal year prior to vesting if not otherwise included in the SCT Total for the covered fiscal year | ||||
| Compensation “Actually Paid” to non-PEO NEOs | $ | 121,822 | ||
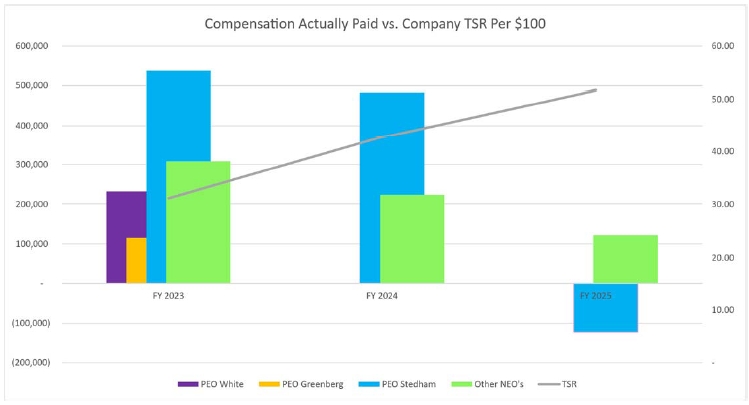
| 7. | Total Shareholder Return reflects the cumulative return of a $100 investment from the beginning of the fiscal year ended December 31, 2023 through the end of each of the fiscal years in the table, calculated in accordance with Item 201(e) of Regulation S-K. |
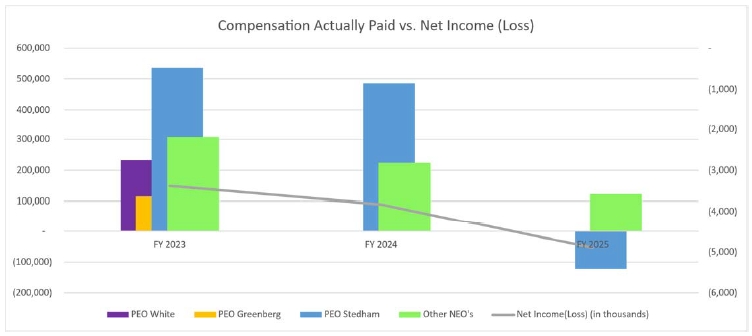
| 8. | Reflects Net Income (Loss) as reported in VerifyMe’s Consolidated Statement of Operations and Consolidated Statements of Comprehensive Income/(Loss) included in VerifyMe’s annual reports on Form 10-K for the respective fiscal years. |