Pay Versus Performance (“PVP”)
In accordance with Item 402(v) of SEC Regulation S-K, we are providing the following information regarding the relationship between executive compensation and our financial performance for each of the last five completed calendar years. In determining the Compensation Actually Paid to our principal executive officer (“PEO”) and Non-PEO NEOs reported in the table below, we are required to make various adjustments to amounts that have been previously reported in the Summary Compensation Table in previous years, as the SEC’s valuation methods for this section differ from those required in the Summary Compensation Table. The table below summarizes compensation values both previously reported in our Summary Compensation Table, as well as the adjusted values required in this section for the 2021, 2022, 2023, 2024, and 2025 calendar years. Note that for our NEOs other than our PEO, compensation is reported as an average.
|
|
|
|
|
|
|
|
|
|
Value of Initial Fixed $100 |
|
|
|
|
|
||||||||||
Year |
|
Summary |
|
Compensation |
|
Average Summary |
|
Average |
|
TSR |
|
Peer |
|
Net Income |
|
Return on |
|
||||||||
2025 |
|
|
2,558,296 |
|
|
3,354,999 |
|
|
781,017 |
|
|
945,946 |
|
|
297 |
|
|
158 |
|
|
76.1 |
|
|
0.98 |
% |
2024 |
|
|
2,268,302 |
|
|
3,084,111 |
|
|
725,173 |
|
|
895,696 |
|
|
248 |
|
|
146 |
|
|
62.2 |
|
|
0.83 |
% |
2023 |
|
|
2,073,765 |
|
|
1,383,605 |
|
|
668,792 |
|
|
560,197 |
|
|
193 |
|
|
127 |
|
|
80.0 |
|
|
1.08 |
% |
2022 |
|
|
2,213,109 |
|
|
2,543,027 |
|
|
659,563 |
|
|
694,852 |
|
|
233 |
|
|
128 |
|
|
101.4 |
|
|
1.44 |
% |
2021 |
|
|
1,869,786 |
|
|
2,927,802 |
|
|
604,668 |
|
|
750,438 |
|
|
215 |
|
|
139 |
|
|
98.7 |
|
|
1.64 |
% |
PEO Compensation
To determine the amounts in column (c) of the PVP table above, the following amounts were deducted from and added to (as applicable) the PEO’s total compensation as reported in the Summary Compensation Table (the “SCT”), in accordance with Item 402(v) of SEC Regulation S-K.
Year |
|
SCT Total for |
|
|
SCT Reported |
|
|
Equity Award |
|
|
Compensation |
|
||||
|
|
|
|
|
|
|
|
|
|
|
|
|
||||
|
|
|
|
|
|
|
|
|
|
|
|
|
||||
2025 |
|
|
2,558,296 |
|
|
|
(765,966 |
) |
|
|
1,562,669 |
|
|
|
3,354,999 |
|
|
|
|
|
|
|
|
|
|
|
|
|
|
||||
Year |
|
Year End Fair |
|
|
Year over Year |
|
|
Fair Value as |
|
|
Year over Year |
|
|
Fair Value at the |
|
|
Value of |
|
|
Total Equity |
|
|||||||
|
|
|
|
|
|
|
|
|
|
|
|
|
|
|
|
|
|
|
|
|
|
|||||||
|
|
|
|
|
|
|
|
|
|
|
|
|
|
|
|
|
|
|
|
|
|
|||||||
2025 |
|
|
838,565 |
|
|
|
726,661 |
|
|
|
— |
|
|
|
(2,557 |
) |
|
|
— |
|
|
|
— |
|
|
|
1,562,669 |
|
|
|
|
|
|
|
|
|
|
|
|
|
|
|
|
|
|
|
|
|
|
|
|||||||
In the table above, the equity values are computed in accordance with the methodologies used for financial reporting purposes, and for unvested awards subject to performance-based vesting conditions, based on the probable outcome of such performance-based vesting conditions.
Average Non-PEO NEO Compensation
To determine the amounts in column (e) in the PVP table, the following amounts were deducted from and added to (as applicable) our Non-PEO NEO’s average total compensation as reported in the SCT, in accordance with Item 402(v) of SEC Regulation S-K.
Year |
|
Average SCT Total |
|
|
Average SCT |
|
|
Average Equity |
|
|
Average |
|
||||
|
|
|
|
|
|
|
|
|
|
|
|
|
||||
|
|
|
|
|
|
|
|
|
|
|
|
|
||||
2025 |
|
|
781,017 |
|
|
|
(159,147 |
) |
|
|
324,076 |
|
|
|
945,946 |
|
|
|
|
|
|
|
|
|
|
|
|
|
|
||||
Year |
|
Year End Fair |
|
|
Year over Year |
|
|
Fair Value as |
|
|
Year over Year |
|
|
Fair Value at the |
|
|
Value of |
|
|
Total Equity |
|
|||||||
|
|
|
|
|
|
|
|
|
|
|
|
|
|
|
|
|
|
|
|
|
|
|||||||
|
|
|
|
|
|
|
|
|
|
|
|
|
|
|
|
|
|
|
|
|
|
|||||||
2025 |
|
|
174,230 |
|
|
|
150,869 |
|
|
|
— |
|
|
|
(1,023 |
) |
|
|
— |
|
|
|
— |
|
|
|
324,076 |
|
|
|
|
|
|
|
|
|
|
|
|
|
|
|
|
|
|
|
|
|
|
|
|||||||
In the table above, the equity values are computed in accordance with the methodologies used for financial reporting purposes, and for unvested awards subject to performance-based vesting conditions, based on the probable outcome of such performance-based vesting conditions.
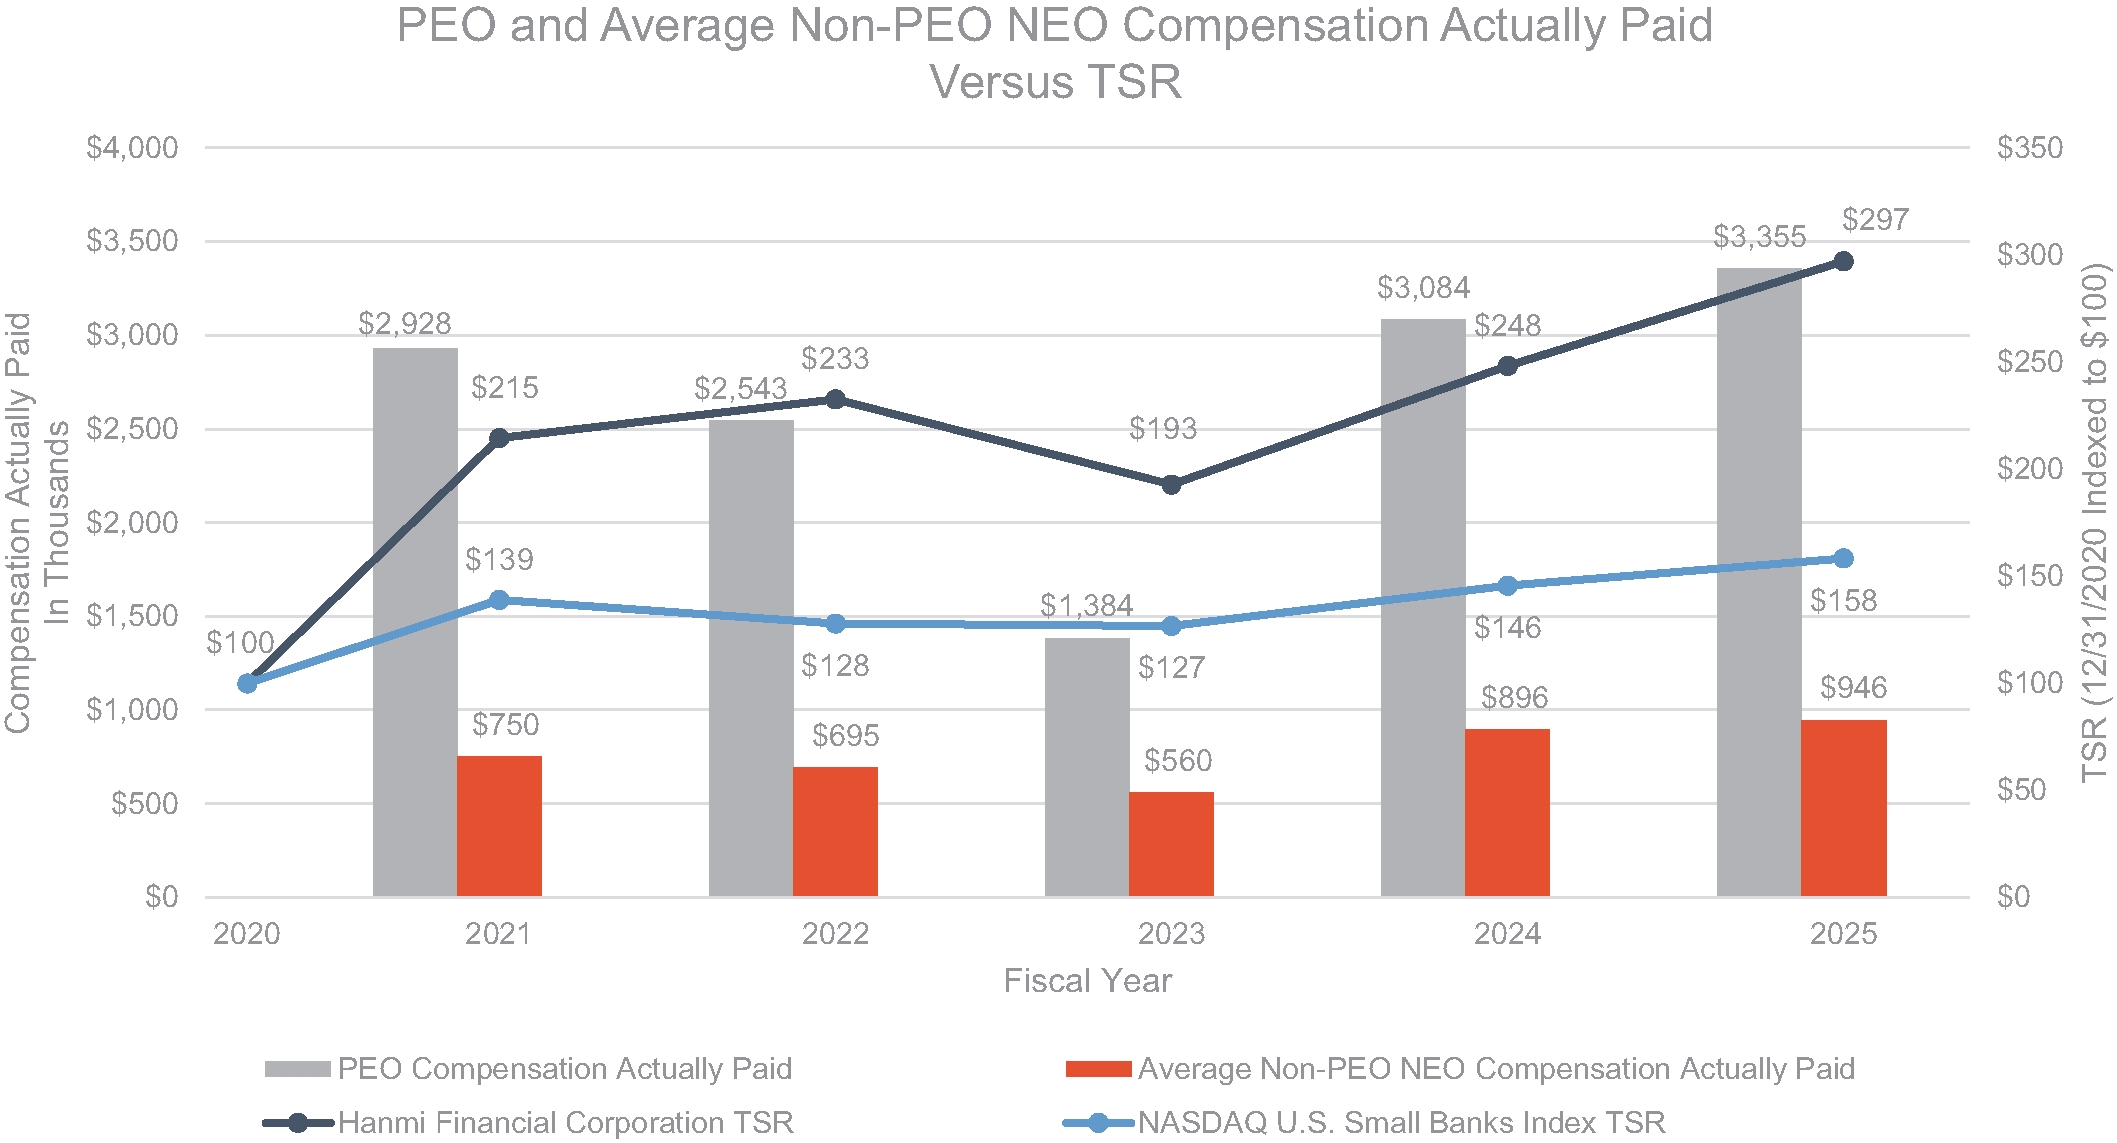
Compensation Actually Paid (CAP) vs. Hanmi Five-year Cumulative TSR vs. Peer Five-year Cumulative TSR
The chart below sets forth the relationship between Compensation Actually Paid to our PEO, the average of Compensation Actually Paid to our Non-PEO NEOs, the Company’s cumulative TSR during the five most recently completed fiscal years, and the TSR for the NASDAQ U.S. Small Cap Banks Index over the same period.
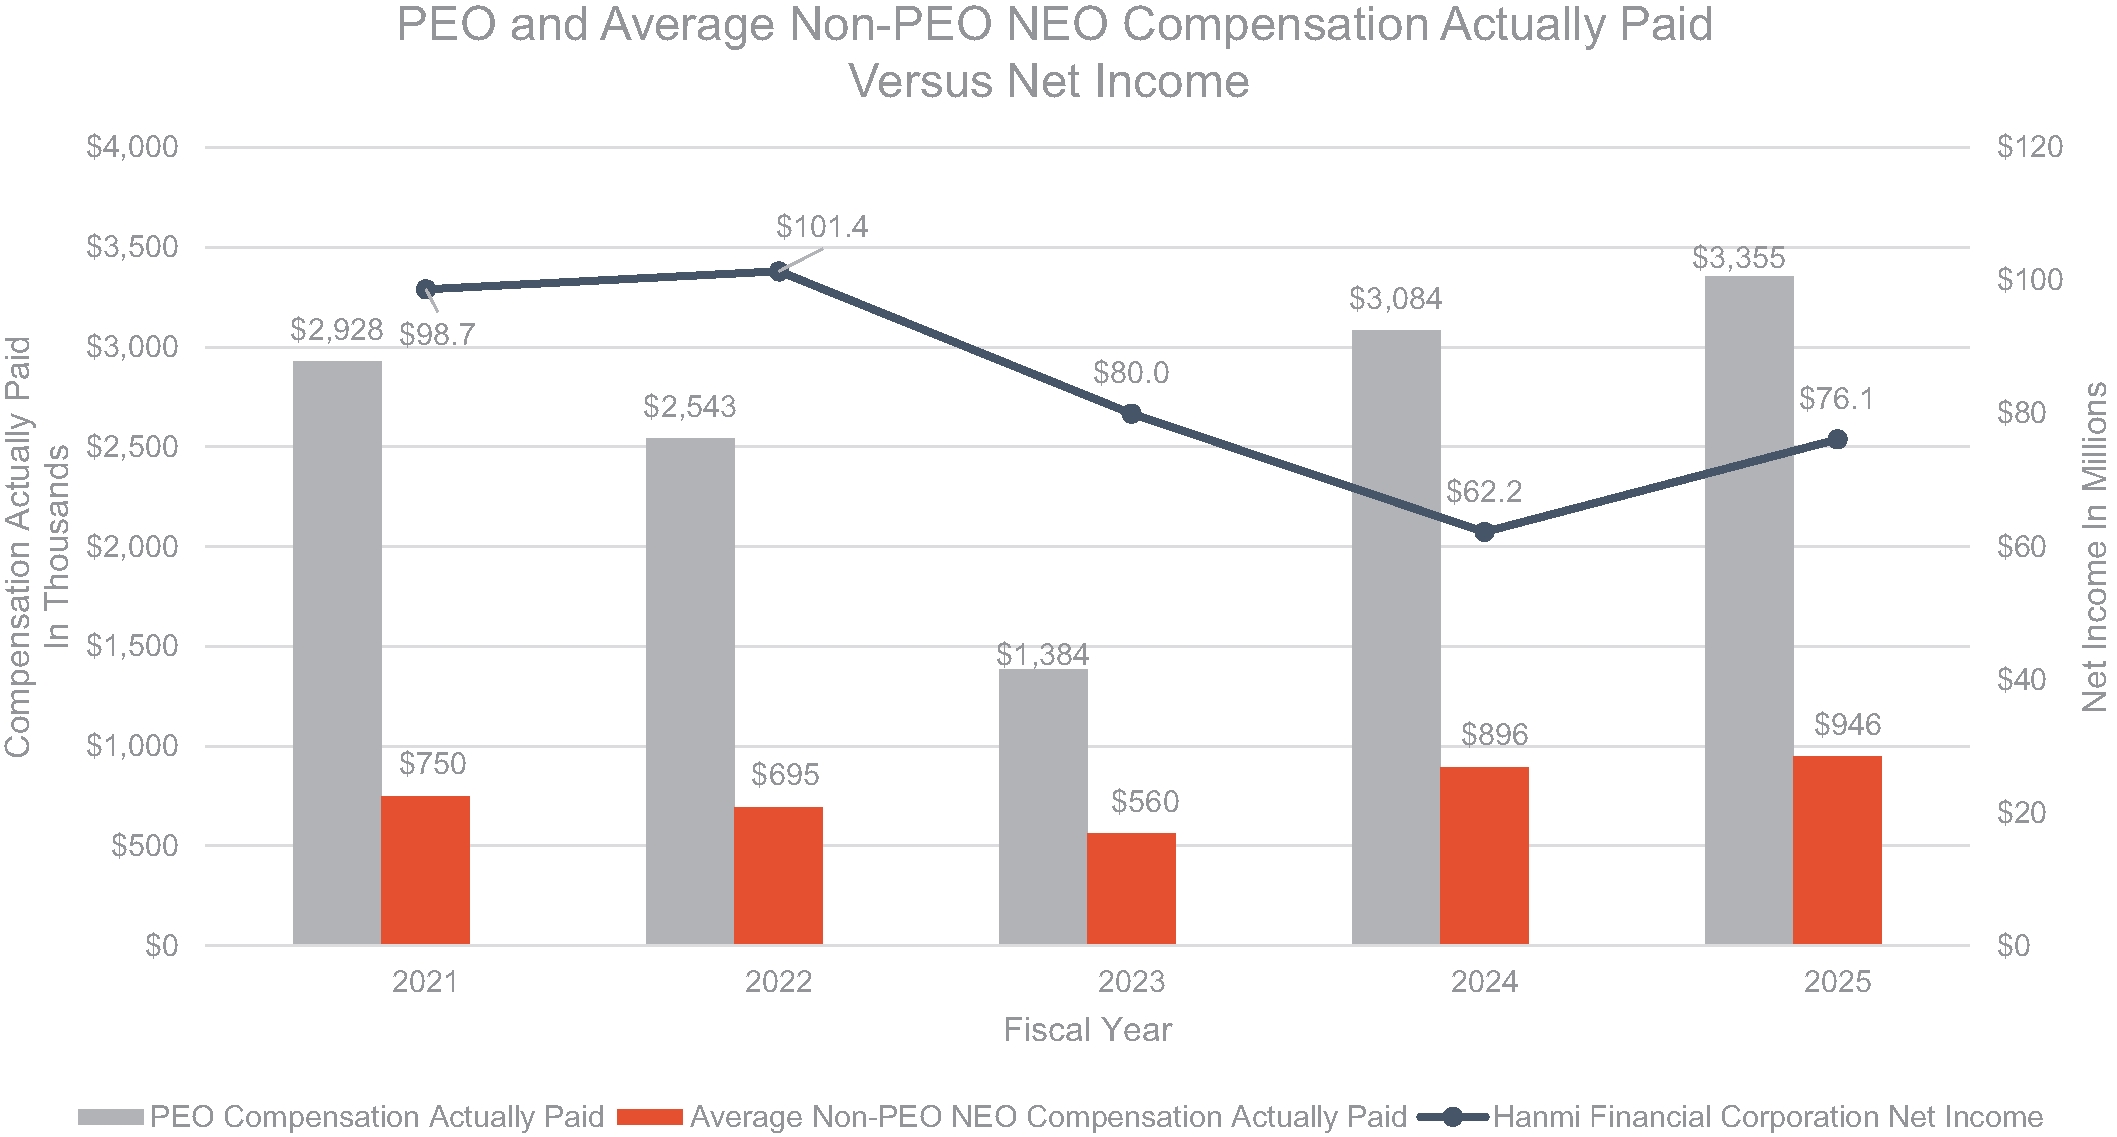
Compensation Actually Paid (CAP) vs. Net-Income
The chart below sets forth the relationship between Compensation Actually Paid to our PEO, the average of Compensation Actually Paid to our Non-PEO NEOs, and the Company’s net income during the five most recently completed fiscal years.
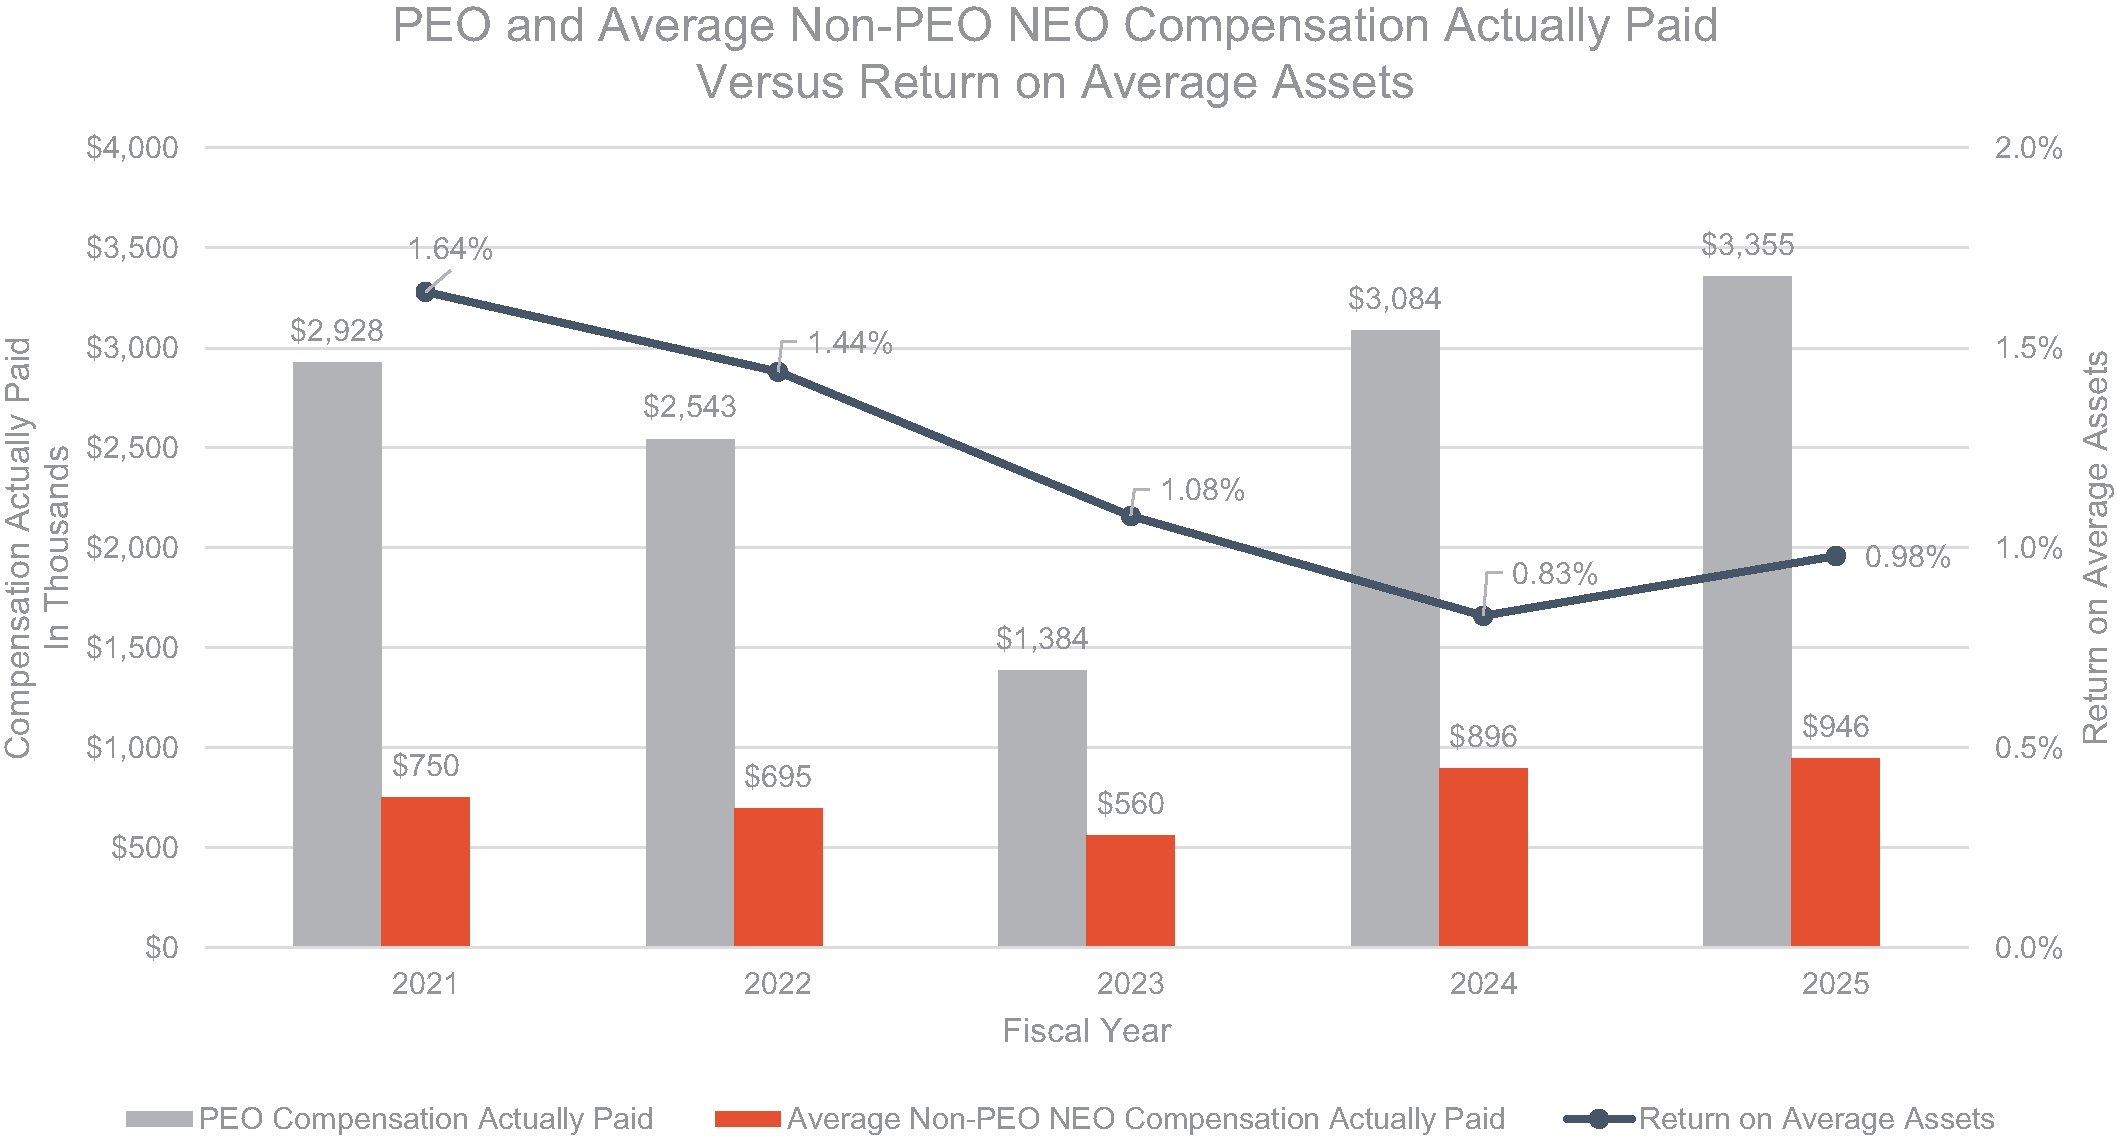
Compensation Actually Paid (CAP) vs. Company Selected Measure (CSM): Return on Average Assets
The chart below sets forth the relationship between Compensation Actually Paid to our PEO, the average of Compensation Actually Paid to our Non-PEO NEOs, and the Return on Average Assets during the five most recently completed fiscal years.
Compensation Actually Paid (CAP) vs. Hanmi Five-year Cumulative TSR vs. Peer Five-year Cumulative TSR
The chart below sets forth the relationship between Compensation Actually Paid to our PEO, the average of Compensation Actually Paid to our Non-PEO NEOs, the Company’s cumulative TSR during the five most recently completed fiscal years, and the TSR for the NASDAQ U.S. Small Cap Banks Index over the same period.
Company-Selected Measure and Other Financial Performance Measures
The following financial performance measures are used to link Compensation Actually Paid to our PEO and Non-PEO NEOs for 2025 to Company performance. The measures in this table are not ranked.
Performance Measure
|
|
Return on Average Assets |
|
Non-Performing Assets to Total Assets |
|
Efficiency Ratio |