Pay vs Performance Disclosure - USD ($)
Dec. 31, 2025
Aug. 28, 2025
Dec. 31, 2025
Dec. 31, 2024
Dec. 31, 2023
PAY VERSUS PERFORMANCE
In accordance with rules adopted by the Securities and Exchange Commission pursuant to the Dodd-Frank Wall Street Reform and Consumer Protection Act of 2010, we provide the following disclosure regarding “compensation actually paid” (as defined by such rules) for our principal executive officer (“PEO”) and Non-PEO NEOs and Company performance for the fiscal years listed below. Our Compensation Committee did not consider the pay versus performance disclosure below in making its pay decisions for any of the fiscal years shown.
Year | Summary Compensation Table Total for First PEO(1) ($) | Summary Compensation Table Total for Second PEO(1) ($) | Summary Compensation Table Total for Third PEO(1) ($) | Compensation Actually Paid to First PEO(1)(2)(3) ($) | Compensation Actually Paid to Second PEO(1)(2)(3) ($) | Compensation Actually Paid to Third PEO (1)(2)(3) ($) | Average Summary Compensation Table Total for Non-PEO NEOs(1) ($) | Average Compensation Actually Paid to Non-PEO NEOs(1)(2)(3) ($) | Value of Initial Fixed $100 Investment based on: TSR ($)(4) | Net Income ($ Thousands) | ||||||||||||||||||||
2025 | 5,052,131 | 5,613,018 | 5,326,170 | 6,026,776 | 4,098,415 | 3,674,628 | 1,653,371 | 1,711,554 | 134.36 | 41,347 | ||||||||||||||||||||
2024 | 9,556,445 | — | — | 4,323,654 | — | — | 5,768,736 | 2,391,457 | 118.72 | (27,307) | ||||||||||||||||||||
2023 | 1,719,791 | — | — | 1,504,455 | — | — | 957,760 | 877,651 | 98.60 | (56,076) | ||||||||||||||||||||
(1) | Robert Wiesenthal was our PEO until August 2025. Melissa M. Tomkiel and William A. Heyburn were our PEO 2 and PEO 3, respectively, since August 2025. The individuals comprising the Non-PEO NEOs for 2023 and 2024 were Melissa M. Tomkiel and William A. Heyburn. The individuals comprising the Non-PEO NEOs for 2025 were Amir Cohen and Scott Wunsch. |
(2) | The amounts shown for Compensation Actually Paid have been calculated in accordance with Item 402(v) of Regulation S-K and do not reflect compensation actually earned, realized, or received by the Company’s NEOs. These amounts reflect the Summary Compensation Table Total with certain adjustments as described in footnote 3 below. |
(3) | Compensation Actually Paid reflects the exclusions and inclusions of certain amounts for the First PEO, Second PEO, Third PEO, and the Non-PEO NEOs as set forth below. Equity values are calculated in accordance with FASB ASC Topic 718. Amounts in the Less Grant Date Fair Value of Stock Awards column are the totals from the Stock Awards column set forth in the Summary Compensation Table for the applicable year. |
Year | Summary Compensation Table Total for First PEO ($) | Less Grant Date Fair Value of Stock Awards for First PEO ($) | Equity Award Adjustments for First PEO(a) ($) | Compensation Actually Paid to First PEO ($) | ||||||||
2025 | 5,052,131 | (2,281,530) | 3,256,175 | 6,026,776 | ||||||||
Year | Summary Compensation Table Total for Second PEO ($) | Less Grant Date Fair Value of Stock Awards for Second PEO ($) | Equity Award Adjustments for Second PEO(a) ($) | Compensation Actually Paid to Second PEO ($) | ||||||||
2025 | 5,613,018 | (4,478,470) | 2,963,867 | 4,098,415 | ||||||||
Year | Summary Compensation Table Total for Third PEO ($) | Less Grant Date Fair Value of Stock Awards for Third PEO ($) | Equity Award Adjustments for Third PEO(a) ($) | Compensation Actually Paid to Third PEO ($) | ||||||||
2025 | 5,326,170 | (4,224,970) | 2,573,428 | 3,674,628 | ||||||||
Year | Average Summary Compensation Table Total for Non-PEO NEOs ($) | Less Average Grant Date Fair Value of Stock Awards for Non-PEO NEOs ($) | Equity Award Adjustments for Non-PEO NEOs(a) ($) | Average Compensation Actually Paid to Non-PEO NEOs ($) | ||||||||
2025 | 1,653,371 | (940,574) | 998,757 | 1,711,554 | ||||||||
a. | The amounts in Equity Award Adjustments column in the tables above include the addition (or subtraction, as applicable) of the following: (1) the year-end fair value of any equity awards granted in the applicable year that are outstanding and unvested as of the end of the year; (2) the amount of change as of the end of the applicable year (from the end of the prior fiscal year) in fair |
value of any awards granted in prior years that are outstanding and unvested as of the end of the applicable year; (3) for awards that are granted and vest in same applicable year, the fair value as of the vesting date; (4) for awards granted in prior years that vest in the applicable year, the amount equal to the change as of the vesting date (from the end of the prior fiscal year) in fair value; (5) for awards granted in prior years that are determined to fail to meet the applicable vesting conditions during the applicable year, a deduction for the amount equal to the fair value at the end of the prior fiscal year. During the periods presented, we did not sponsor a pension plan, pay dividends or have any other earnings paid on equity awards prior to the vesting date. The amounts deducted or added in calculating the equity award adjustments are set forth in the following tables:
Year | Year-End Fair Value of Equity Awards Granted During Year That Remained Unvested as of Last Day of Year for First PEO ($) | Change in Fair Value from Last Day of Prior Year to Last Day of Year of Unvested Equity Awards for First PEO ($) | Vesting-Date Fair Value of Equity Awards Granted During Year that Vested During Year for First PEO ($) | Change in Fair Value from Last Day of Prior Year to Vesting Date of Unvested Equity Awards that Vested During Year for First PEO ($) | Fair Value at Last Day of Prior Year of Equity Awards Forfeited During Year for First PEO ($) | Total Equity Award Adjustments for First PEO ($) | ||||||||||||
2025 | 195,320 | 1,652,122 | — | 1,408,733 | — | 3,256,175 | ||||||||||||
Year | Year-End Fair Value of Equity Awards Granted During Year That Remained Unvested as of Last Day of Year for Second PEO ($) | Change in Fair Value from Last Day of Prior Year to Last Day of Year of Unvested Equity Awards for Second PEO ($) | Vesting-Date Fair Value of Equity Awards Granted During Year that Vested During Year for Second PEO ($) | Change in Fair Value from Last Day of Prior Year to Vesting Date of Unvested Equity Awards that Vested During Year for Second PEO ($) | Fair Value at Last Day of Prior Year of Equity Awards Forfeited During Year for Second PEO ($) | Total Equity Award Adjustments for Second PEO ($) | ||||||||||||
2025 | — | 1,115,466 | — | 1,848,401 | — | 2,963,867 | ||||||||||||
Year | Year-End Fair Value of Equity Awards Granted During Year That Remained Unvested as of Last Day of Year for Third PEO ($) | Change in Fair Value from Last Day of Prior Year to Last Day of Year of Unvested Equity Awards for Third PEO ($) | Vesting-Date Fair Value of Equity Awards Granted During Year that Vested During Year for Third PEO ($) | Change in Fair Value from Last Day of Prior Year to Vesting Date of Unvested Equity Awards that Vested During Year for Third PEO ($) | Fair Value at Last Day of Prior Year of Equity Awards Forfeited During Year for Third PEO ($) | Total Equity Award Adjustments for Third PEO ($) | ||||||||||||
2025 | — | 981,964 | — | 1,591,464 | — | 2,573,428 | ||||||||||||
Year | Average Year- End Fair Value of Equity Awards Granted During Year That Remained Unvested as of Last Day of Year for Non- PEO NEOs ($) | Average Change in Fair Value from Last Day of Prior Year to Last Day of Year of Unvested Equity Awards for Non-PEO NEOs ($) | Average Vesting-Date Fair Value of Equity Awards Granted During Year that Vested During Year for Non- PEO NEOs ($) | Average Change in Fair Value from Last Day of Prior Year to Vesting Date of Unvested Equity Awards that Vested During Year for Non-PEO NEOs ($) | Average Fair Value at Last Day of Prior Year of Equity Awards Forfeited During Year for Non-PEO NEOs ($) | Total Equity Award Adjustments for Non-PEO NEOs ($) | ||||||||||||
2025 | 582,215 | 124,675 | 104,735 | 187,132 | — | 998,757 | ||||||||||||
(4) | Assumes $100 was invested in the Company for the period starting December 31, 2022, through the end of the listed year. Historical stock performance is not necessarily indicative of future stock performance. |
(1) | Robert Wiesenthal was our PEO until August 2025. Melissa M. Tomkiel and William A. Heyburn were our PEO 2 and PEO 3, respectively, since August 2025. The individuals comprising the Non-PEO NEOs for 2023 and 2024 were Melissa M. Tomkiel and William A. Heyburn. The individuals comprising the Non-PEO NEOs for 2025 were Amir Cohen and Scott Wunsch. |
(3) | Compensation Actually Paid reflects the exclusions and inclusions of certain amounts for the First PEO, Second PEO, Third PEO, and the Non-PEO NEOs as set forth below. Equity values are calculated in accordance with FASB ASC Topic 718. Amounts in the Less Grant Date Fair Value of Stock Awards column are the totals from the Stock Awards column set forth in the Summary Compensation Table for the applicable year. |
Year | Summary Compensation Table Total for First PEO ($) | Less Grant Date Fair Value of Stock Awards for First PEO ($) | Equity Award Adjustments for First PEO(a) ($) | Compensation Actually Paid to First PEO ($) | ||||||||
2025 | 5,052,131 | (2,281,530) | 3,256,175 | 6,026,776 | ||||||||
Year | Summary Compensation Table Total for Second PEO ($) | Less Grant Date Fair Value of Stock Awards for Second PEO ($) | Equity Award Adjustments for Second PEO(a) ($) | Compensation Actually Paid to Second PEO ($) | ||||||||
2025 | 5,613,018 | (4,478,470) | 2,963,867 | 4,098,415 | ||||||||
Year | Summary Compensation Table Total for Third PEO ($) | Less Grant Date Fair Value of Stock Awards for Third PEO ($) | Equity Award Adjustments for Third PEO(a) ($) | Compensation Actually Paid to Third PEO ($) | ||||||||
2025 | 5,326,170 | (4,224,970) | 2,573,428 | 3,674,628 | ||||||||
a. | The amounts in Equity Award Adjustments column in the tables above include the addition (or subtraction, as applicable) of the following: (1) the year-end fair value of any equity awards granted in the applicable year that are outstanding and unvested as of the end of the year; (2) the amount of change as of the end of the applicable year (from the end of the prior fiscal year) in fair |
value of any awards granted in prior years that are outstanding and unvested as of the end of the applicable year; (3) for awards that are granted and vest in same applicable year, the fair value as of the vesting date; (4) for awards granted in prior years that vest in the applicable year, the amount equal to the change as of the vesting date (from the end of the prior fiscal year) in fair value; (5) for awards granted in prior years that are determined to fail to meet the applicable vesting conditions during the applicable year, a deduction for the amount equal to the fair value at the end of the prior fiscal year. During the periods presented, we did not sponsor a pension plan, pay dividends or have any other earnings paid on equity awards prior to the vesting date. The amounts deducted or added in calculating the equity award adjustments are set forth in the following tables:
Year | Year-End Fair Value of Equity Awards Granted During Year That Remained Unvested as of Last Day of Year for First PEO ($) | Change in Fair Value from Last Day of Prior Year to Last Day of Year of Unvested Equity Awards for First PEO ($) | Vesting-Date Fair Value of Equity Awards Granted During Year that Vested During Year for First PEO ($) | Change in Fair Value from Last Day of Prior Year to Vesting Date of Unvested Equity Awards that Vested During Year for First PEO ($) | Fair Value at Last Day of Prior Year of Equity Awards Forfeited During Year for First PEO ($) | Total Equity Award Adjustments for First PEO ($) | ||||||||||||
2025 | 195,320 | 1,652,122 | — | 1,408,733 | — | 3,256,175 | ||||||||||||
Year | Year-End Fair Value of Equity Awards Granted During Year That Remained Unvested as of Last Day of Year for Second PEO ($) | Change in Fair Value from Last Day of Prior Year to Last Day of Year of Unvested Equity Awards for Second PEO ($) | Vesting-Date Fair Value of Equity Awards Granted During Year that Vested During Year for Second PEO ($) | Change in Fair Value from Last Day of Prior Year to Vesting Date of Unvested Equity Awards that Vested During Year for Second PEO ($) | Fair Value at Last Day of Prior Year of Equity Awards Forfeited During Year for Second PEO ($) | Total Equity Award Adjustments for Second PEO ($) | ||||||||||||
2025 | — | 1,115,466 | — | 1,848,401 | — | 2,963,867 | ||||||||||||
Year | Year-End Fair Value of Equity Awards Granted During Year That Remained Unvested as of Last Day of Year for Third PEO ($) | Change in Fair Value from Last Day of Prior Year to Last Day of Year of Unvested Equity Awards for Third PEO ($) | Vesting-Date Fair Value of Equity Awards Granted During Year that Vested During Year for Third PEO ($) | Change in Fair Value from Last Day of Prior Year to Vesting Date of Unvested Equity Awards that Vested During Year for Third PEO ($) | Fair Value at Last Day of Prior Year of Equity Awards Forfeited During Year for Third PEO ($) | Total Equity Award Adjustments for Third PEO ($) | ||||||||||||
2025 | — | 981,964 | — | 1,591,464 | — | 2,573,428 | ||||||||||||
(3) | Compensation Actually Paid reflects the exclusions and inclusions of certain amounts for the First PEO, Second PEO, Third PEO, and the Non-PEO NEOs as set forth below. Equity values are calculated in accordance with FASB ASC Topic 718. Amounts in the Less Grant Date Fair Value of Stock Awards column are the totals from the Stock Awards column set forth in the Summary Compensation Table for the applicable year. |
Year | Average Summary Compensation Table Total for Non-PEO NEOs ($) | Less Average Grant Date Fair Value of Stock Awards for Non-PEO NEOs ($) | Equity Award Adjustments for Non-PEO NEOs(a) ($) | Average Compensation Actually Paid to Non-PEO NEOs ($) | ||||||||
2025 | 1,653,371 | (940,574) | 998,757 | 1,711,554 | ||||||||
a. | The amounts in Equity Award Adjustments column in the tables above include the addition (or subtraction, as applicable) of the following: (1) the year-end fair value of any equity awards granted in the applicable year that are outstanding and unvested as of the end of the year; (2) the amount of change as of the end of the applicable year (from the end of the prior fiscal year) in fair |
value of any awards granted in prior years that are outstanding and unvested as of the end of the applicable year; (3) for awards that are granted and vest in same applicable year, the fair value as of the vesting date; (4) for awards granted in prior years that vest in the applicable year, the amount equal to the change as of the vesting date (from the end of the prior fiscal year) in fair value; (5) for awards granted in prior years that are determined to fail to meet the applicable vesting conditions during the applicable year, a deduction for the amount equal to the fair value at the end of the prior fiscal year. During the periods presented, we did not sponsor a pension plan, pay dividends or have any other earnings paid on equity awards prior to the vesting date. The amounts deducted or added in calculating the equity award adjustments are set forth in the following tables:
Year | Average Year- End Fair Value of Equity Awards Granted During Year That Remained Unvested as of Last Day of Year for Non- PEO NEOs ($) | Average Change in Fair Value from Last Day of Prior Year to Last Day of Year of Unvested Equity Awards for Non-PEO NEOs ($) | Average Vesting-Date Fair Value of Equity Awards Granted During Year that Vested During Year for Non- PEO NEOs ($) | Average Change in Fair Value from Last Day of Prior Year to Vesting Date of Unvested Equity Awards that Vested During Year for Non-PEO NEOs ($) | Average Fair Value at Last Day of Prior Year of Equity Awards Forfeited During Year for Non-PEO NEOs ($) | Total Equity Award Adjustments for Non-PEO NEOs ($) | ||||||||||||
2025 | 582,215 | 124,675 | 104,735 | 187,132 | — | 998,757 | ||||||||||||
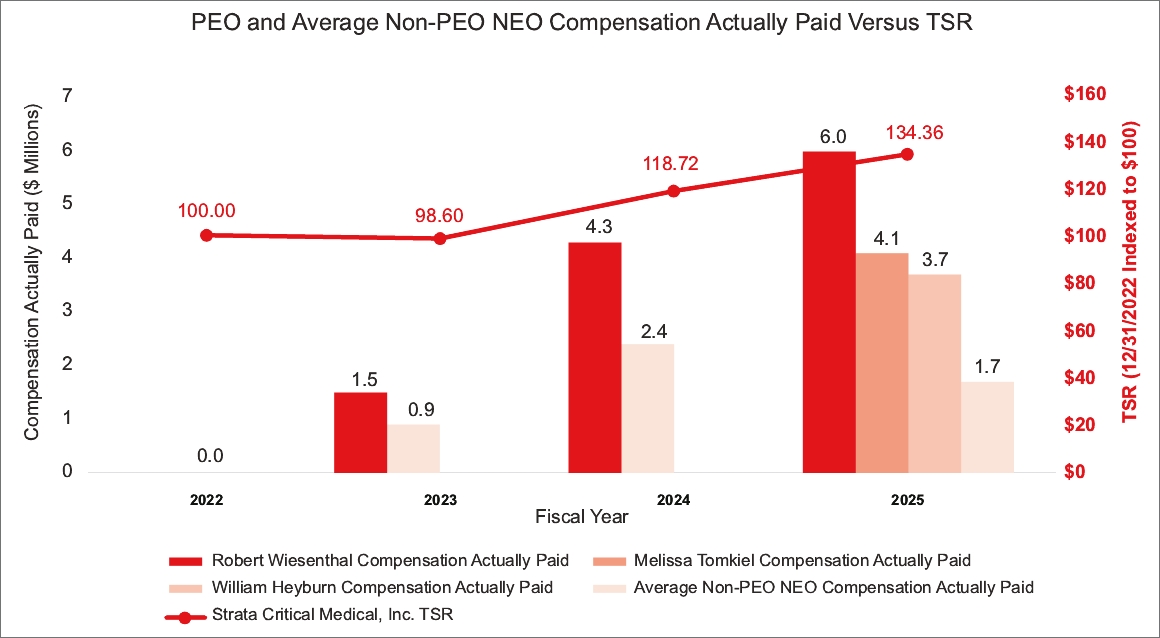
Relationship Between PEO and Non-PEO NEO Compensation Actually Paid and Total Shareholder Return (“TSR”)
The following chart sets forth the relationship between Compensation Actually Paid to our PEOs, the average of Compensation Actually Paid to our Non-PEO NEOs and the cumulative TSR over the three most recently completed fiscal years for the Company.
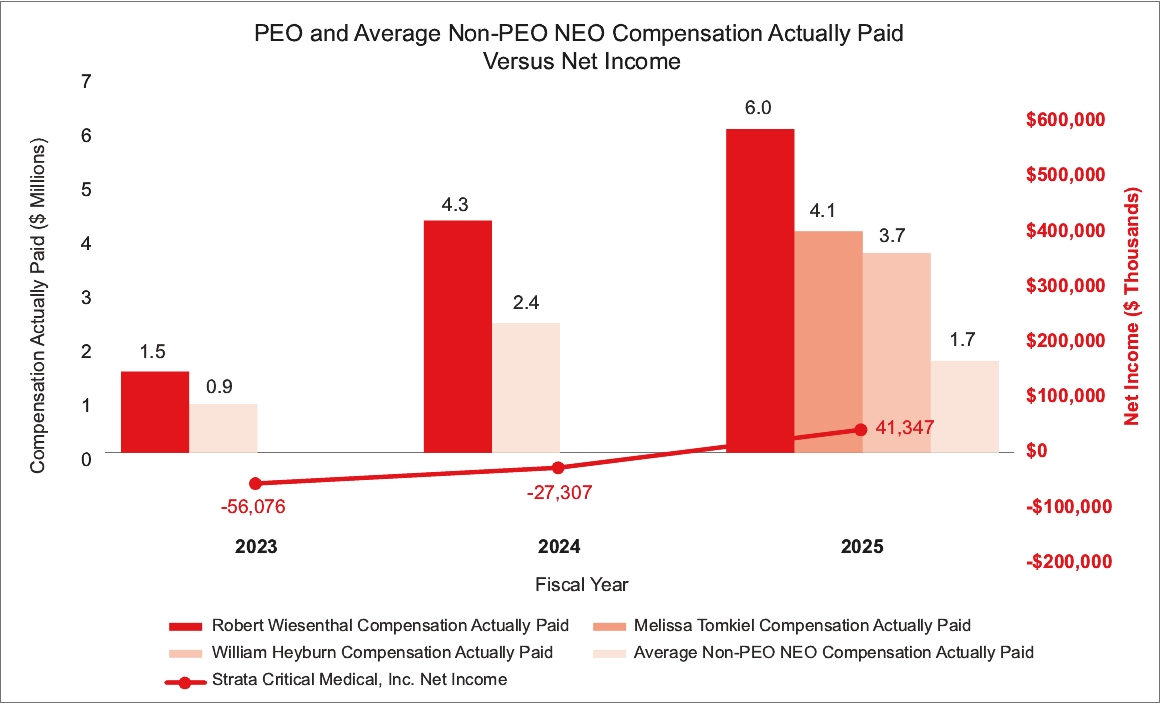
Relationship Between PEO and Non-PEO NEO Compensation Actually Paid and Net Income
The following chart sets forth the relationship between Compensation Actually Paid to our PEOs, the average of Compensation Actually Paid to our Non-PEO NEOs, and our net income during the three most recently completed fiscal years.
a. | The amounts in Equity Award Adjustments column in the tables above include the addition (or subtraction, as applicable) of the following: (1) the year-end fair value of any equity awards granted in the applicable year that are outstanding and unvested as of the end of the year; (2) the amount of change as of the end of the applicable year (from the end of the prior fiscal year) in fair |
value of any awards granted in prior years that are outstanding and unvested as of the end of the applicable year; (3) for awards that are granted and vest in same applicable year, the fair value as of the vesting date; (4) for awards granted in prior years that vest in the applicable year, the amount equal to the change as of the vesting date (from the end of the prior fiscal year) in fair value; (5) for awards granted in prior years that are determined to fail to meet the applicable vesting conditions during the applicable year, a deduction for the amount equal to the fair value at the end of the prior fiscal year. During the periods presented, we did not sponsor a pension plan, pay dividends or have any other earnings paid on equity awards prior to the vesting date. The amounts deducted or added in calculating the equity award adjustments are set forth in the following tables:
Year | Year-End Fair Value of Equity Awards Granted During Year That Remained Unvested as of Last Day of Year for First PEO ($) | Change in Fair Value from Last Day of Prior Year to Last Day of Year of Unvested Equity Awards for First PEO ($) | Vesting-Date Fair Value of Equity Awards Granted During Year that Vested During Year for First PEO ($) | Change in Fair Value from Last Day of Prior Year to Vesting Date of Unvested Equity Awards that Vested During Year for First PEO ($) | Fair Value at Last Day of Prior Year of Equity Awards Forfeited During Year for First PEO ($) | Total Equity Award Adjustments for First PEO ($) | ||||||||||||
2025 | 195,320 | 1,652,122 | — | 1,408,733 | — | 3,256,175 | ||||||||||||
Year | Year-End Fair Value of Equity Awards Granted During Year That Remained Unvested as of Last Day of Year for Second PEO ($) | Change in Fair Value from Last Day of Prior Year to Last Day of Year of Unvested Equity Awards for Second PEO ($) | Vesting-Date Fair Value of Equity Awards Granted During Year that Vested During Year for Second PEO ($) | Change in Fair Value from Last Day of Prior Year to Vesting Date of Unvested Equity Awards that Vested During Year for Second PEO ($) | Fair Value at Last Day of Prior Year of Equity Awards Forfeited During Year for Second PEO ($) | Total Equity Award Adjustments for Second PEO ($) | ||||||||||||
2025 | — | 1,115,466 | — | 1,848,401 | — | 2,963,867 | ||||||||||||
Year | Year-End Fair Value of Equity Awards Granted During Year That Remained Unvested as of Last Day of Year for Third PEO ($) | Change in Fair Value from Last Day of Prior Year to Last Day of Year of Unvested Equity Awards for Third PEO ($) | Vesting-Date Fair Value of Equity Awards Granted During Year that Vested During Year for Third PEO ($) | Change in Fair Value from Last Day of Prior Year to Vesting Date of Unvested Equity Awards that Vested During Year for Third PEO ($) | Fair Value at Last Day of Prior Year of Equity Awards Forfeited During Year for Third PEO ($) | Total Equity Award Adjustments for Third PEO ($) | ||||||||||||
2025 | — | 981,964 | — | 1,591,464 | — | 2,573,428 | ||||||||||||
Year | Average Year- End Fair Value of Equity Awards Granted During Year That Remained Unvested as of Last Day of Year for Non- PEO NEOs ($) | Average Change in Fair Value from Last Day of Prior Year to Last Day of Year of Unvested Equity Awards for Non-PEO NEOs ($) | Average Vesting-Date Fair Value of Equity Awards Granted During Year that Vested During Year for Non- PEO NEOs ($) | Average Change in Fair Value from Last Day of Prior Year to Vesting Date of Unvested Equity Awards that Vested During Year for Non-PEO NEOs ($) | Average Fair Value at Last Day of Prior Year of Equity Awards Forfeited During Year for Non-PEO NEOs ($) | Total Equity Award Adjustments for Non-PEO NEOs ($) | ||||||||||||
2025 | 582,215 | 124,675 | 104,735 | 187,132 | — | 998,757 | ||||||||||||