Pay vs Performance Disclosure - USD ($)
Dec. 31, 2025
Dec. 31, 2024
Dec. 31, 2023
Dec. 31, 2022
Dec. 31, 2021
| Year (a) | Summary Compensation Table Total for PEO (b)(1)(2) | Compensation Actually Paid to PEO (c)(3) | Average Summary Compensation Table Total for Non-PEO NEOs (d)(1)(2) | Average Compensation Actually Paid to Non-PEO NEOs (e)(4) | Value of Initial Fixed $100 Investment Based on: | Net (Loss) Income (h)(7) | Company-Selected Measure: ARR Metric (i)(8) | |||||||||||||||||||
| Total Shareholder Return (f)(5) | Peer Group Total Shareholder Return (g)(6) | |||||||||||||||||||||||||
(in thousands) | (in millions) | |||||||||||||||||||||||||
| 2025 | $7,748,106 | $4,168,052 | $2,712,625 | $1,510,950 | $60 | $170 | $(17,032) | $516.4 | ||||||||||||||||||
| 2024 | $6,395,926 | $1,096,453 | $2,404,001 | $660,431 | $75 | $144 | $30,958 | $457.7 | ||||||||||||||||||
| 2023 | $6,192,025 | $13,677,891 | $2,433,397 | $2,853,732 | $106 | $115 | $23,412 | $430.7 | ||||||||||||||||||
| 2022 | $6,261,962 | $4,823,891 | $2,678,069 | $2,245,444 | $82 | $91 | $16,707 | $408.3 | ||||||||||||||||||
| 2021 | $9,486,833 | $7,907,506 | $3,472,614 | $2,983,574 | $89 | $112 | $113 | $364.3 | ||||||||||||||||||
| PEO | |||||||||||||||||||||||||||||||||||
| 2021 | 2022 | 2023 | 2024 | 2025 | |||||||||||||||||||||||||||||||
| Summary Compensation Table - Total Compensation | (a) | $9,486,833 | $6,261,962 | $6,192,025 | $6,395,926 | $7,748,106 | |||||||||||||||||||||||||||||
| - | Grant Date Fair Value of Stock Awards and Option Awards Granted in Fiscal Year | (b) | $8,593,025 | $5,354,179 | $5,058,475 | $5,557,626 | $6,813,606 | ||||||||||||||||||||||||||||
| + | Fair Value at Fiscal Year End of Outstanding and Unvested Stock Awards and Option Awards Granted in Fiscal Year | (c) | $7,630,606 | $4,728,605 | $6,396,080 | $4,269,080 | $5,701,967 | ||||||||||||||||||||||||||||
| + | Change in Fair Value of Outstanding and Unvested Stock Awards and Option Awards Granted in Prior Fiscal Years | (d) | $(550,990) | $(436,594) | $7,829,767 | $(1,987,766) | $(1,181,316) | ||||||||||||||||||||||||||||
| + | Fair Value at Vesting of Stock Awards and Option Awards Granted in Fiscal Year That Vested During Fiscal Year | (e) | — | — | — | — | — | ||||||||||||||||||||||||||||
| + | Change in Fair Value as of Vesting Date of Stock Awards and Option Awards Granted in Prior Fiscal Years For Which Applicable Vesting Conditions Were Satisfied During Fiscal Year | (f) | $(65,918) | $(375,903) | $(970,431) | $(2,023,161) | $(825,194) | ||||||||||||||||||||||||||||
| - | Fair Value as of Prior Fiscal Year End of Stock Awards and Option Awards Granted in Prior Fiscal Years That Failed to Meet Applicable Vesting Conditions During Fiscal Year | (g) | — | — | $711,075 | — | $461,905 | ||||||||||||||||||||||||||||
| = | Compensation Actually Paid | $7,907,506 | $4,823,891 | $13,677,891 | $1,096,453 | $4,168,052 | |||||||||||||||||||||||||||||
(a) Represents Total Compensation as reported in the Summary Compensation Table for the indicated fiscal year.
(b) Represents the aggregate grant date fair value of the stock awards granted to our PEO during the indicated fiscal year, computed in accordance with FASB ASC Topic 718. Amounts shown are the amounts reported in the Summary Compensation Table.
(c)Represents the aggregate fair value as of the indicated fiscal year-end of our PEO’s outstanding and unvested stock awards granted during such fiscal year, computed in accordance with FASB ASC Topic 718.
(d) Represents the aggregate change in fair value during the indicated fiscal year (from the end of the prior fiscal year) of the outstanding and unvested stock awards held by our PEO, as of the last day of the indicated fiscal year granted in any prior fiscal year, computed in accordance with FASB ASC Topic 718.
(e) Represents the fair value as of the vesting of the stock awards granted to our PEO that were granted and vested in the same indicated fiscal year, as computed in accordance with FASB ASC Topic 718.
(f) Represents the aggregate change in fair value, measured from the prior fiscal year-end to the vesting date, of each stock award held by our PEO that was granted in a prior fiscal year and which satisfied all applicable vesting conditions during the indicated fiscal year, computed in accordance with FASB ASC Topic 718.
(g) Represents the aggregate fair value as of the last day of the prior fiscal year of each stock award held by our PEO that was granted in a prior fiscal year and which failed to meet the applicable vesting conditions in the indicated fiscal year, computed in accordance with FASB ASC Topic 718.
| Average NEOs | |||||||||||||||||||||||||||||||||||
| 2021 | 2022 | 2023 | 2024 | 2025 | |||||||||||||||||||||||||||||||
| Summary Compensation Table - Total Compensation | (a) | $3,472,614 | $2,678,069 | $2,433,397 | $2,404,001 | $2,712,625 | |||||||||||||||||||||||||||||
| - | Grant Date Fair Value of Stock Awards and Option Awards Granted in Fiscal Year | (b) | $2,864,338 | $2,034,585 | $1,681,939 | $1,818,855 | $2,069,171 | ||||||||||||||||||||||||||||
| + | Fair Value at Fiscal Year End of Outstanding and Unvested Stock Awards and Option Awards Granted in Fiscal Year | (c) | $2,543,532 | $1,796,867 | $2,146,984 | $1,397,150 | $1,676,865 | ||||||||||||||||||||||||||||
| + | Change in Fair Value of Outstanding and Unvested Stock Awards and Option Awards Granted in Prior Fiscal Years | (d) | $(144,159) | $(133,386) | $463,417 | $(670,080) | $(389,380) | ||||||||||||||||||||||||||||
| + | Fair Value at Vesting of Stock Awards and Option Awards Granted in Fiscal Year That Vested During Fiscal Year | (e) | — | — | — | — | — | ||||||||||||||||||||||||||||
| + | Change in Fair Value as of Vesting Date of Stock Awards and Option Awards Granted in Prior Fiscal Years For Which Applicable Vesting Conditions Were Satisfied During Fiscal Year | (f) | $(24,075) | $(61,521) | $(288,995) | $(651,785) | $(268,820) | ||||||||||||||||||||||||||||
| - | Fair Value as of Prior Fiscal Year End of Stock Awards and Option Awards Granted in Prior Fiscal Years That Failed to Meet Applicable Vesting Conditions During Fiscal Year | (g) | — | — | $219,132 | — | $151,169 | ||||||||||||||||||||||||||||
| = | Compensation Actually Paid | $2,983,574 | $2,245,444 | $2,853,732 | $660,431 | $1,510,950 | |||||||||||||||||||||||||||||
See note (1) above for the NEOs included in the average for each indicated fiscal year.
(a) Represents the average Total Compensation as reported in the Summary Compensation Table for our NEOs as a group (other than our PEO) in the indicated fiscal year.
(b) Represents the average aggregate grant date fair value of the stock awards and option awards granted to our NEOs as a group (other than our PEO during the indicated fiscal year, computed in accordance with FASB ASC Topic 718. Amounts shown are the amounts reported in the Summary Compensation Table.
(c) Represents the average aggregate fair value as of the indicated fiscal year-end of the outstanding and unvested stock awards and option awards of our NEOs as a group (other than our PEO) granted during such fiscal year, computed in accordance with FASB ASC Topic 718.
(d) Represents the average aggregate change in fair value during the indicated fiscal year (from the end of the prior fiscal year) of the outstanding and unvested stock awards and option awards held by our NEOs as a group (other than our PEO) as of the last day of the indicated fiscal year granted in any prior fiscal year, computed in accordance with FASB ASC Topic 718.
(e) Represents the average aggregate fair value as of the vesting of the stock awards and option awards that were granted to our NEOs as a group (other than our PEO) that were granted and vested in the same indicated fiscal year, computed in accordance with FASB ASC Topic 718.
(f) Represents the average aggregate change in fair value, measured from the prior fiscal year-end to the vesting date, of each stock award and option award held by our NEOs as a group (other than our PEO) that was granted in a prior fiscal year and which satisfied all applicable vesting conditions during the indicated fiscal year, computed in accordance with FASB ASC Topic 718.
(g) Represents the average aggregate fair value as of the last day of the prior fiscal year of the stock awards and option awards held by our NEOs as a group (other than our PEO) that were granted in a prior fiscal year and which failed to meet the applicable vesting conditions in the indicated fiscal year, computed in accordance with FASB ASC Topic 718.
We believe “compensation actually paid” over the years 2021 through 2025 are reflective of the compensation committee’s emphasis on aligning pay and performance given the movement in “compensation actually paid.” The following charts illustrate the relationship between pay and performance, in accordance with Item 402(v) of Regulation S-K.
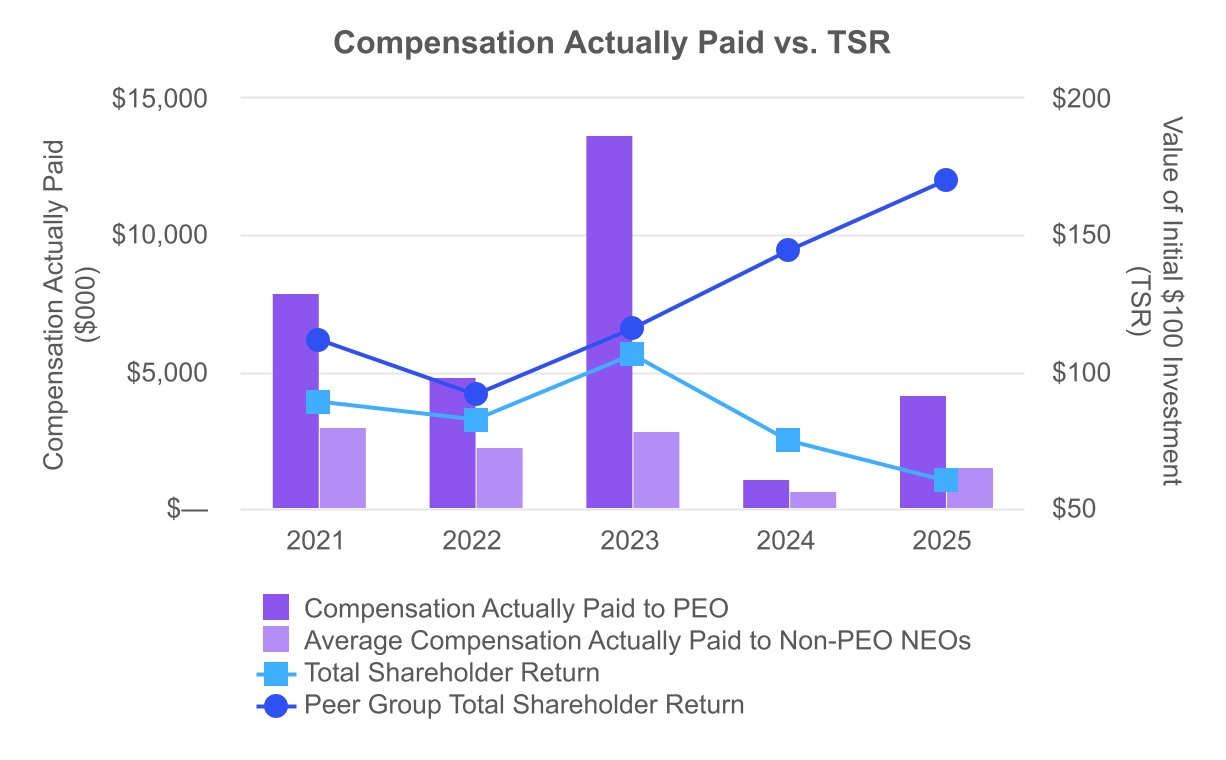
Our PEO’s “compensation actually paid” was generally impacted by our TSR performance, given the leverage of our compensation program towards equity compensation. However, “compensation actually paid” to our PEO and NEOs for 2021 was anomalously greater as a result of one-time new hire equity awards granted to Mr. Adler and one-time equity awards granted to Mr. Pagliuca and Mr. O’Brien in connection with their appointment to the positions of chief executive officer and chief financial officer, respectively. The average “compensation actually paid” for our other NEOs was also similarly impacted by our TSR performance.
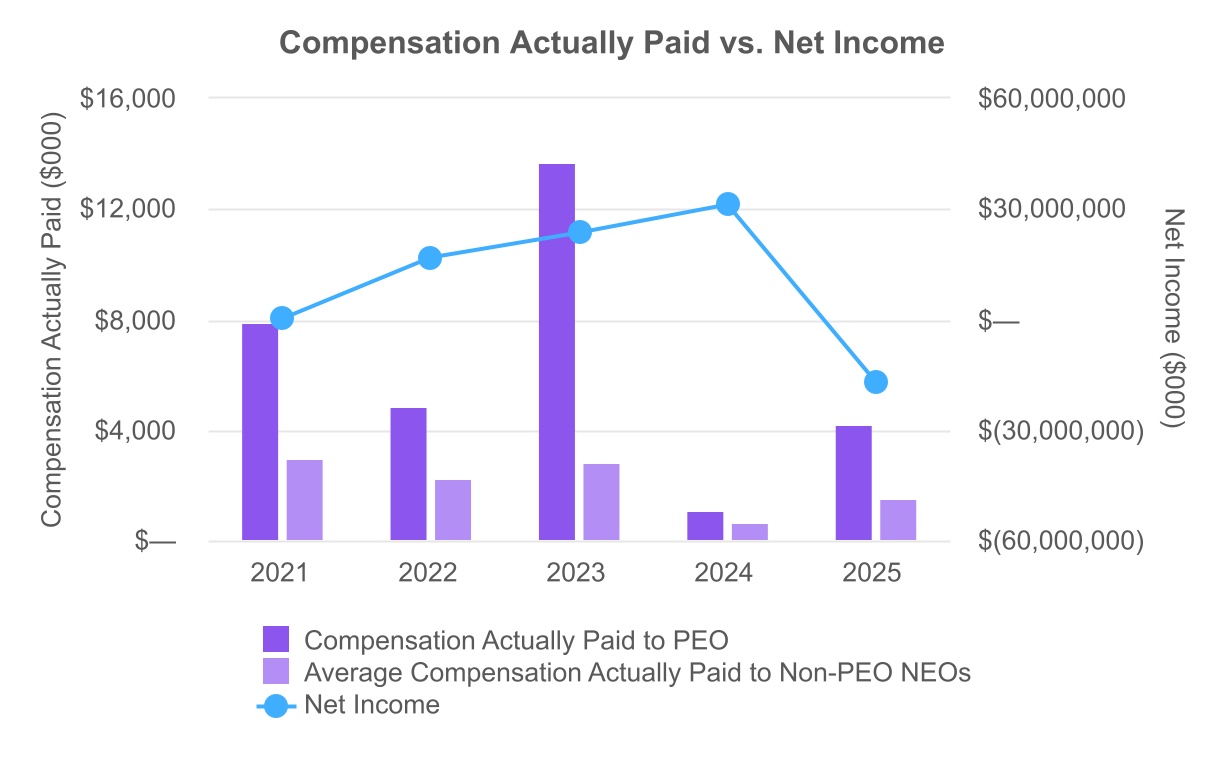
We do not use GAAP or non-GAAP net income (loss) as a financial performance measure in our overall executive compensation program. Please refer to our 2025 Annual Report for further information on our net income over the last four-year period.
We believe “compensation actually paid” over the years 2021 through 2025 are reflective of the compensation committee’s emphasis on aligning pay and performance given the movement in “compensation actually paid.” The following charts illustrate the relationship between pay and performance, in accordance with Item 402(v) of Regulation S-K.