v3.26.1
Pay vs Performance Disclosure - USD ($)
12 Months Ended
Jan. 31, 2026
Feb. 01, 2025
Feb. 03, 2024
Jan. 28, 2023
Pay vs Performance Disclosure        
Pay vs Performance Disclosure, Table

PAY VERSUS PERFORMANCE


Value of Initial Fixed $100 Investment Based on:


Summary Compensation Table Total for PEO

Compensation Actually Paid to PEO

Average Summary Compensation Table Total for Non-PEO Named

Average Compensation Actually Paid to Non-PEO Named

Total Share-

Net

Fiscal

Paul Stone

Joseph Schneider

Jon Barker

Paul Stone

Joseph Schneider

Jon Barker

Executive
Officers

Executive
Officers

holder
Return

(Loss)
Income

Year

($)(1)

($)(1)

($)(1)

($)(2)

($)(2)

($)(2)

($)(3)

($)(4)

($)(5)

($)

2025

1,767,183

-

-

1,518,303

-

-

989,408

387,380

21.14

(50,061)

2024

4,002,123

-

-

1,695,232

-

-

1,076,510

502,978

31.48

(33,059)

2023

2,741,394

914,616

250,425

2,262,753

758,706

(822,437)

1,176,874

421,503

57.10

(28,997)

(1)
The dollar amounts reported in these columns are the amounts of total compensation reported for (i) with respect to 2025 and 2024, Paul Stone, our Chief Executive Officer; and (ii) with respect to 2023, Paul Stone, our Chief Executive Officer, Joseph Schneider, our former Interim Chief Executive Officer and Jon Barker, our former Chief Executive Officer, in each corresponding year in the “Total” column of the Summary Compensation Table. Refer to "Executive Compensation Tables - Summary Compensation Table for Fiscal Years 2025 and 2024."
(2)
The dollar amounts reported in these columns are the amount of “compensation actually paid” to Messrs. Stone, Schneider and Barker for 2025, 2024, and 2023, as applicable, as computed in accordance with Item 402(v) of Regulation S-K. The dollar amounts do not reflect the actual amount of compensation earned by or paid to our former PEO during the applicable years. In accordance with the requirements of Item 402(v) of Regulation S-K, the following adjustments were made to Mr. Stone's total compensation for 2025 to determine the compensation actually paid to him for 2025 (adjustments for pension or dividend payments are not covered, as the Company does not have supplemental executive requirement plans and does not pay dividends on equity awards, and due to rounding, the calculated final value of the numbers shown in the following table may not be the precise values reported above):


Year


Paul Stone - 2025


Summary Compensation Table Total

($)


1,767,183


Less: Stock and Option Award Values Reported in Summary Compensation Table for the Covered Year

($)


(204,000

)

Plus: Year-End Fair Value for Outstanding and Unvested Stock and Option Awards Granted in the Covered Year

($)


274,000


Plus: Fair Value as of Vesting Date of Stock and Option Awards Granted and Vested in the Covered Year

($)


-


Plus: Year over Year Change in Fair Value of Outstanding Unvested Stock and Option Awards from Prior Years

($)


(310,072

)

Plus: Year over Year Change in Fair Value of Stock and Option Awards from Prior Years that Vested in the Covered Year

($)


(8,809

)

Less: Average End of Prior Year Fair Value of Stock and Option Awards Forfeited during the Covered Year

($)


-


Compensation Actually Paid

($)


1,518,303


(3)
The dollar amounts reported in this column represent the average of the amounts reported for the Company's named executive officers ("NEOs") as a group (excluding Messrs. Stone, Schneider and Barker) in the “Total” column of the Summary Compensation Table for each applicable year. The NEOs (excluding Messrs. Stone, Schneider and Barker) included for purposes of calculating the
average amounts for each applicable year are as follows: (i) for 2025, Jennifer Fall Jung, our Chief Financial Officer and Jeff White, our Former Chief Financial Officer; and (ii) for 2024 and 2023, Jeff White, our Chief Financial Officer.
(4)
The dollar amounts reported in this column represent the average amount of “compensation actually paid” to our NEOs as a group (excluding Messrs. Stone, Schneider and Barker) in each of 2025, 2024, and 2023, as computed in accordance with Item 402(v) of Regulation S-K. The dollar amounts do not reflect the actual average amount of compensation earned by or paid to our NEOs as a group (excluding Messrs. Stone, Schneider and Barker) during the applicable years. In accordance with the requirements of Item 402(v) of Regulation S-K, the following adjustments were made to the NEOs as a group (excluding Messrs. Stone, Schneider and Barker) total compensation for each year to determine the compensation actually paid (adjustments for pension or dividend payments are not covered, as the Company does not have supplemental executive requirement plans and does not pay dividends on equity awards, and due to rounding, the calculated final value of the numbers shown in the following table may not be the precise values reported above):


Year


2025


Average Summary Compensation Table Total

($)


989,408


Less: Average Stock and Option Award Values Reported in Summary Compensation Table for the Covered Year

($)


(411,100

)

Plus: Average Year-End Fair Value for Outstanding and Unvested Stock and Option Awards Granted in the Covered Year

($)


201,875


Plus: Average Year over Year Change in Fair Value of Outstanding Unvested Stock and Option Awards from Prior Years

($)


(272,964

)

Plus: Average Change in Fair Value of Stock and Option Awards from Prior Years that Vested in the Covered Year

($)


(7,131

)

Less: Average End of Prior Year Fair Value of Stock and Option Awards Forfeited during the Covered Year

($)


(112,707

)

Compensation Actually Paid

($)


387,380


(5)
Cumulative total shareholder return ("TSR") is calculated by dividing the sum of the cumulative amount of dividends for the measurement period, assuming dividend reinvestment, and the difference between the Company’s share price at the end and the beginning of the measurement period by the Company’s share price at the beginning of the measurement period.
(6)
The dollar amounts reported represent the amount of net income reflected in the Company's audited financial statements for the applicable year.

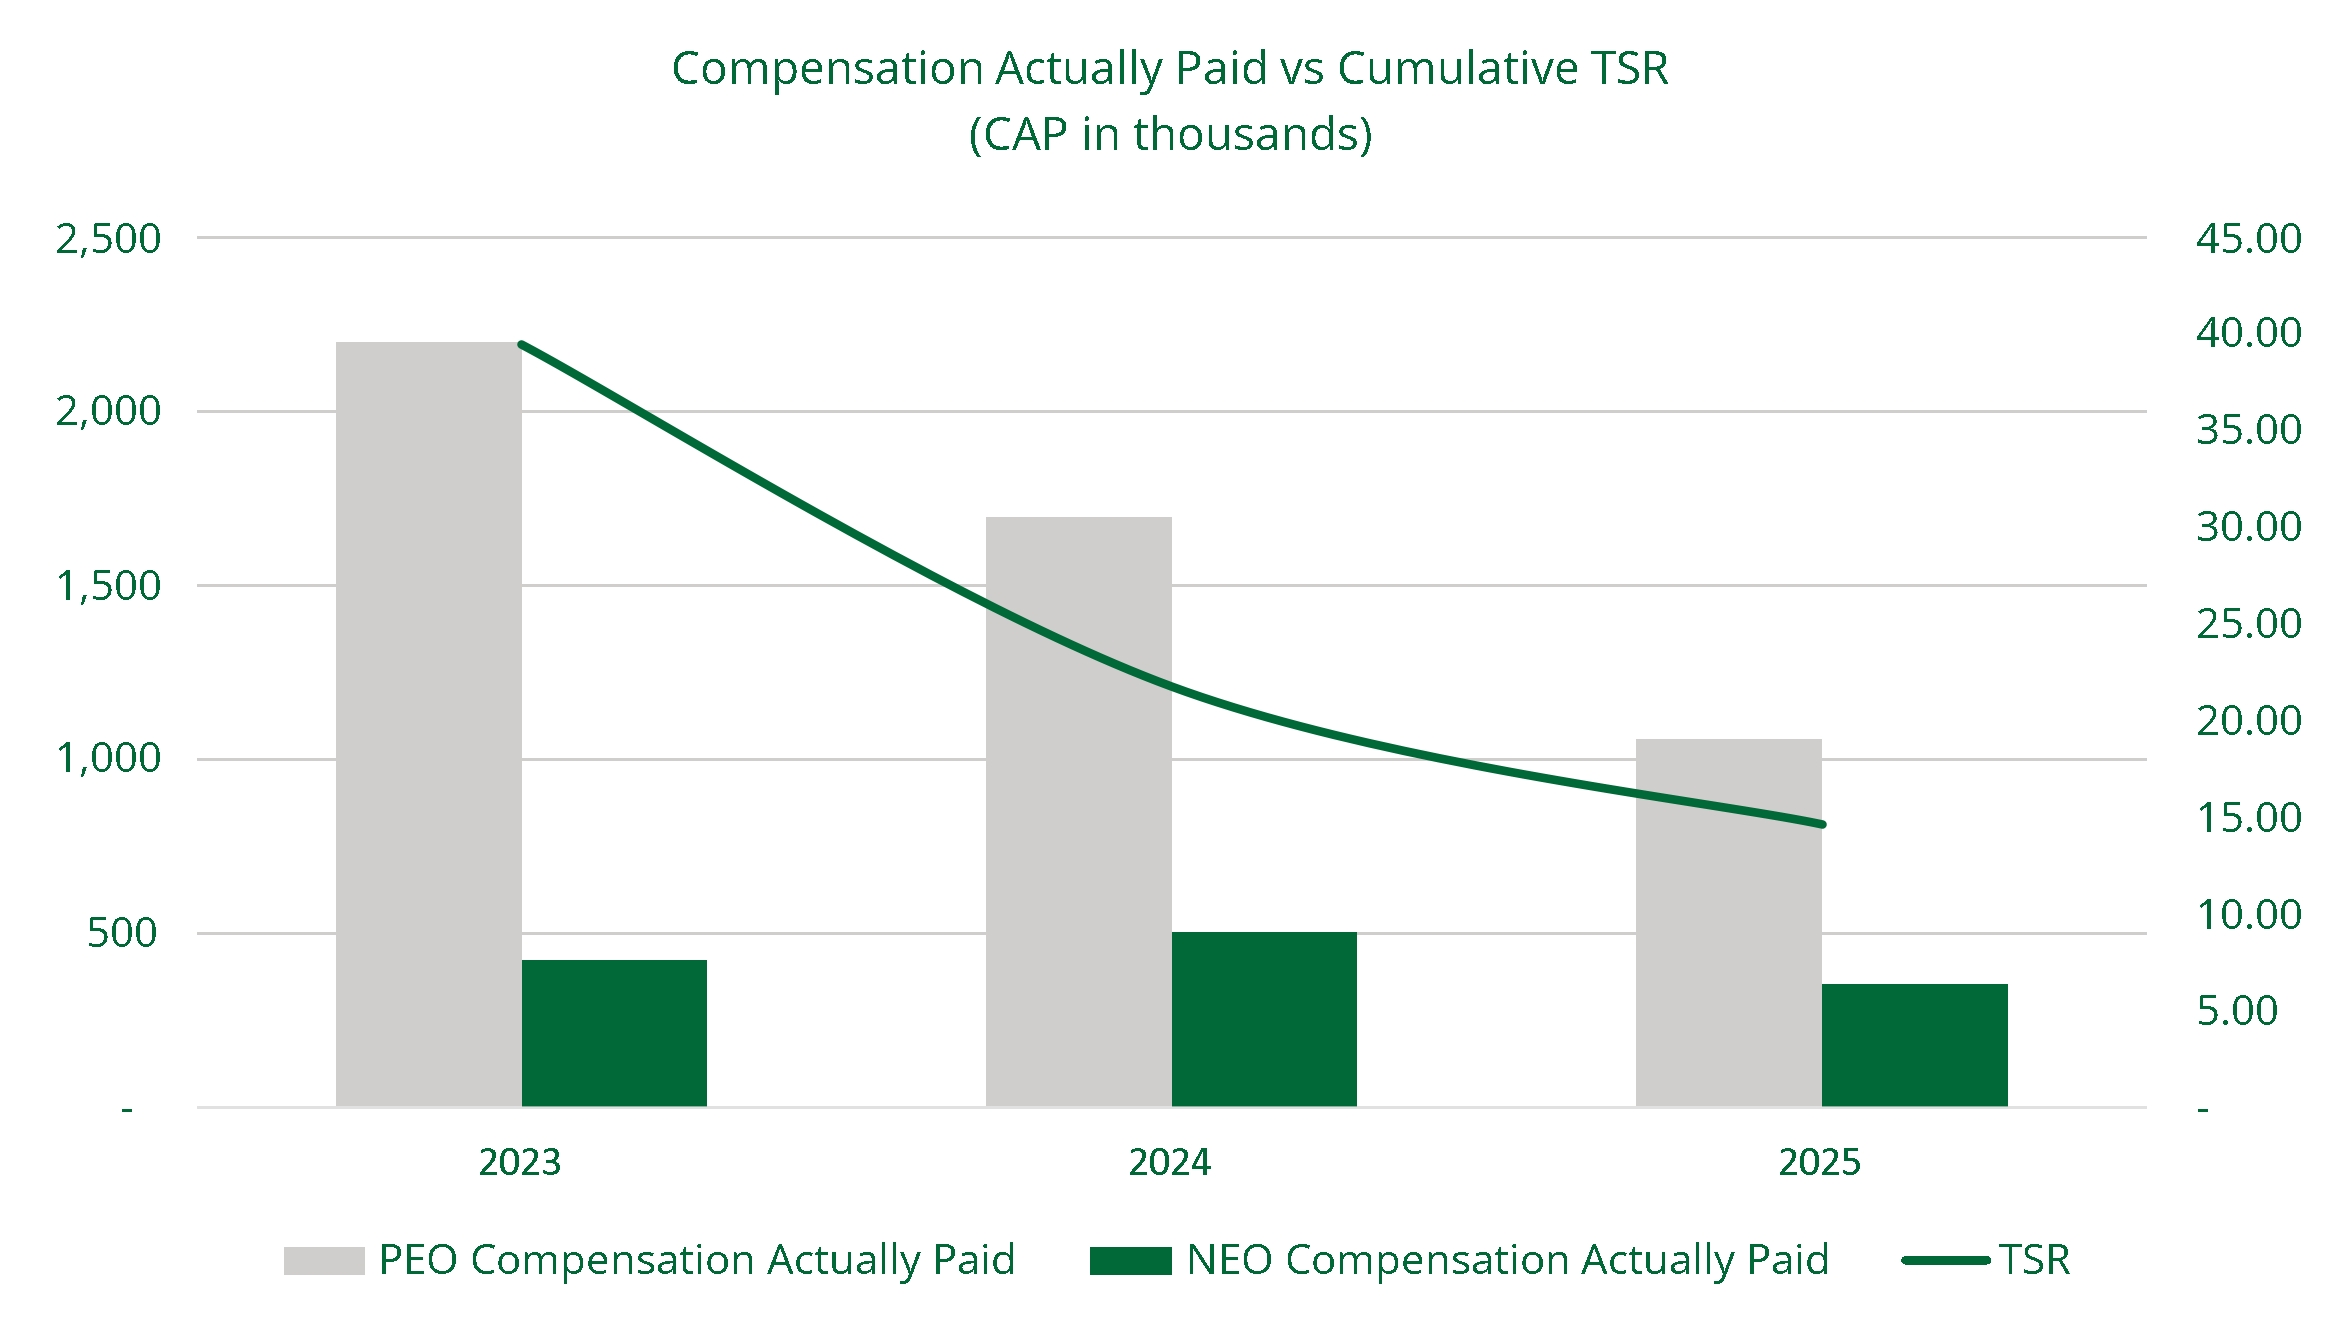
Required Disclosure of the Relationship Between Compensation Actually Paid and Financial Performance Measures

As required by Item 402(v) of Regulation S-K, we are providing the following graphs to illustrate the relationship between the pay and performance figures that are included in the pay versus performance tabular disclosure above. In addition, the second graph below further illustrates the relationship between Company total shareholder return and that of the S&P 500 Retailing Industry Group Index. As noted above, “compensation actually paid” for purposes of the tabular disclosure and the following graphs were calculated in accordance with SEC rules and do not fully represent the actual final amount of compensation earned by or actually paid to our NEOs during the applicable years.

     
Named Executive Officers, Footnote
(1)
The dollar amounts reported in these columns are the amounts of total compensation reported for (i) with respect to 2025 and 2024, Paul Stone, our Chief Executive Officer; and (ii) with respect to 2023, Paul Stone, our Chief Executive Officer, Joseph Schneider, our former Interim Chief Executive Officer and Jon Barker, our former Chief Executive Officer, in each corresponding year in the “Total” column of the Summary Compensation Table. Refer to "Executive Compensation Tables - Summary Compensation Table for Fiscal Years 2025 and 2024."
     
Adjustment To PEO Compensation, Footnote
(2)
The dollar amounts reported in these columns are the amount of “compensation actually paid” to Messrs. Stone, Schneider and Barker for 2025, 2024, and 2023, as applicable, as computed in accordance with Item 402(v) of Regulation S-K. The dollar amounts do not reflect the actual amount of compensation earned by or paid to our former PEO during the applicable years. In accordance with the requirements of Item 402(v) of Regulation S-K, the following adjustments were made to Mr. Stone's total compensation for 2025 to determine the compensation actually paid to him for 2025 (adjustments for pension or dividend payments are not covered, as the Company does not have supplemental executive requirement plans and does not pay dividends on equity awards, and due to rounding, the calculated final value of the numbers shown in the following table may not be the precise values reported above):


Year


Paul Stone - 2025


Summary Compensation Table Total

($)


1,767,183


Less: Stock and Option Award Values Reported in Summary Compensation Table for the Covered Year

($)


(204,000

)

Plus: Year-End Fair Value for Outstanding and Unvested Stock and Option Awards Granted in the Covered Year

($)


274,000


Plus: Fair Value as of Vesting Date of Stock and Option Awards Granted and Vested in the Covered Year

($)


-


Plus: Year over Year Change in Fair Value of Outstanding Unvested Stock and Option Awards from Prior Years

($)


(310,072

)

Plus: Year over Year Change in Fair Value of Stock and Option Awards from Prior Years that Vested in the Covered Year

($)


(8,809

)

Less: Average End of Prior Year Fair Value of Stock and Option Awards Forfeited during the Covered Year

($)


-


Compensation Actually Paid

($)


1,518,303


Non-PEO NEO Average Total Compensation Amount $ 989,408 $ 1,076,510 $ 1,176,874  
Non-PEO NEO Average Compensation Actually Paid Amount $ 387,380 502,978 421,503  
Adjustment to Non-PEO NEO Compensation Footnote
(3)
The dollar amounts reported in this column represent the average of the amounts reported for the Company's named executive officers ("NEOs") as a group (excluding Messrs. Stone, Schneider and Barker) in the “Total” column of the Summary Compensation Table for each applicable year. The NEOs (excluding Messrs. Stone, Schneider and Barker) included for purposes of calculating the
average amounts for each applicable year are as follows: (i) for 2025, Jennifer Fall Jung, our Chief Financial Officer and Jeff White, our Former Chief Financial Officer; and (ii) for 2024 and 2023, Jeff White, our Chief Financial Officer.
(4)
The dollar amounts reported in this column represent the average amount of “compensation actually paid” to our NEOs as a group (excluding Messrs. Stone, Schneider and Barker) in each of 2025, 2024, and 2023, as computed in accordance with Item 402(v) of Regulation S-K. The dollar amounts do not reflect the actual average amount of compensation earned by or paid to our NEOs as a group (excluding Messrs. Stone, Schneider and Barker) during the applicable years. In accordance with the requirements of Item 402(v) of Regulation S-K, the following adjustments were made to the NEOs as a group (excluding Messrs. Stone, Schneider and Barker) total compensation for each year to determine the compensation actually paid (adjustments for pension or dividend payments are not covered, as the Company does not have supplemental executive requirement plans and does not pay dividends on equity awards, and due to rounding, the calculated final value of the numbers shown in the following table may not be the precise values reported above):


Year


2025


Average Summary Compensation Table Total

($)


989,408


Less: Average Stock and Option Award Values Reported in Summary Compensation Table for the Covered Year

($)


(411,100

)

Plus: Average Year-End Fair Value for Outstanding and Unvested Stock and Option Awards Granted in the Covered Year

($)


201,875


Plus: Average Year over Year Change in Fair Value of Outstanding Unvested Stock and Option Awards from Prior Years

($)


(272,964

)

Plus: Average Change in Fair Value of Stock and Option Awards from Prior Years that Vested in the Covered Year

($)


(7,131

)

Less: Average End of Prior Year Fair Value of Stock and Option Awards Forfeited during the Covered Year

($)


(112,707

)

Compensation Actually Paid

($)


387,380


Compensation Actually Paid vs. Total Shareholder Return

img136887835_20.jpg

     
Compensation Actually Paid vs. Net Income

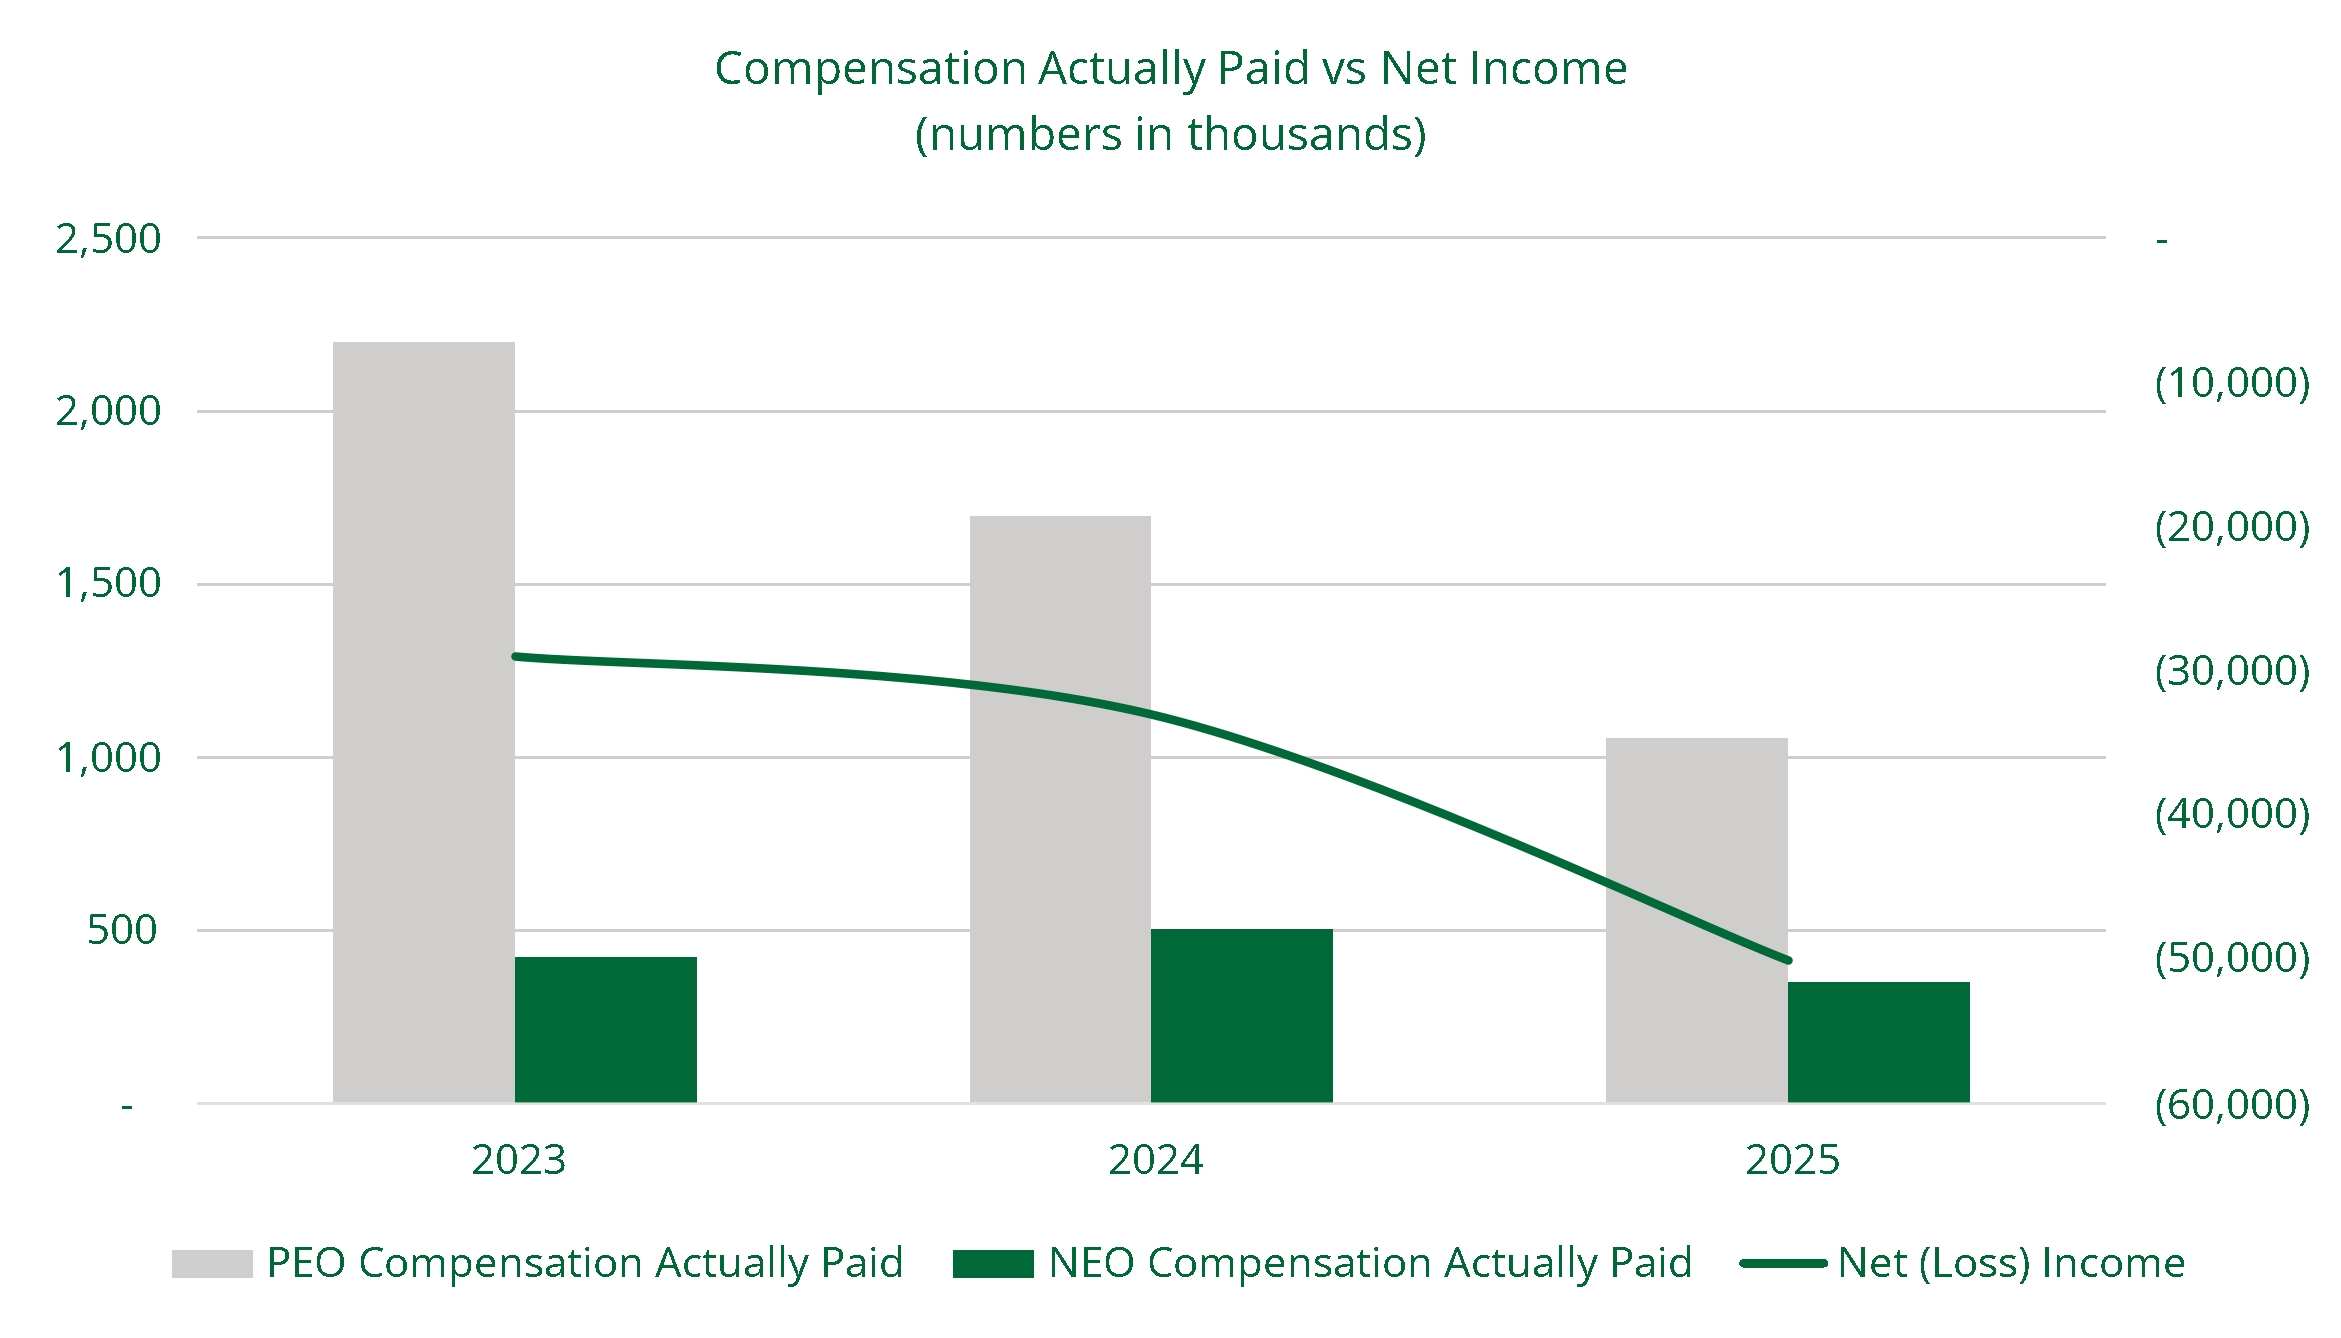
Compensation Actually Paid vs Net Income number in thousands

img136887835_19.jpg

     
Compensation Actually Paid vs. Company Selected Measure

Compensation Actually Paid vs Adjusted ESPCAP in thousands

     
Tabular List, Table

All information provided above under the “Pay Versus Performance” heading will not be deemed to be incorporated by reference into any filing of the Company under the Securities Act of 1933, as amended (the “Securities Act”), or the Exchange Act, whether made before or after the date hereof and irrespective of any general incorporation language in any such filing, except to the extent the Company specifically incorporates such information by reference.

     
Total Shareholder Return Amount $ 21.14 31.48 57.1  
Net Income (Loss) (50,061,000) (33,059,000) (28,997,000)  
Paul Stone        
Pay vs Performance Disclosure        
PEO Total Compensation Amount 1,767,183 4,002,123 2,741,394  
PEO Actually Paid Compensation Amount $ 1,518,303 $ 1,695,232 $ 2,262,753  
PEO Name Paul Stone Paul Stone Paul Stone  
Joseph Schneider        
Pay vs Performance Disclosure        
PEO Total Compensation Amount     $ 914,616  
PEO Actually Paid Compensation Amount     $ 758,706  
PEO Name     Joseph Schneider  
Jon Barker        
Pay vs Performance Disclosure        
PEO Total Compensation Amount     $ 250,425  
PEO Actually Paid Compensation Amount     $ (822,437)  
PEO Name       Jon Barker
PEO | Paul Stone | Aggregate Grant Date Fair Value of Equity Award Amounts Reported in Summary Compensation Table        
Pay vs Performance Disclosure        
Adjustment to Compensation, Amount $ (204,000)      
PEO | Paul Stone | Year-end Fair Value of Equity Awards Granted in Covered Year that are Outstanding and Unvested        
Pay vs Performance Disclosure        
Adjustment to Compensation, Amount 274,000      
PEO | Paul Stone | Year-over-Year Change in Fair Value of Equity Awards Granted in Prior Years That are Outstanding and Unvested        
Pay vs Performance Disclosure        
Adjustment to Compensation, Amount (310,072)      
PEO | Paul Stone | Change in Fair Value as of Vesting Date of Prior Year Equity Awards Vested in Covered Year        
Pay vs Performance Disclosure        
Adjustment to Compensation, Amount (8,809)      
Non-PEO NEO | Year-over-Year Change in Fair Value of Equity Awards Granted in Prior Years That are Outstanding and Unvested        
Pay vs Performance Disclosure        
Adjustment to Compensation, Amount (272,964)      
Non-PEO NEO | Less: Average Stock and Option Award Values Reported in Summary Compensation Table for the Covered Year        
Pay vs Performance Disclosure        
Adjustment to Compensation, Amount (411,100)      
Non-PEO NEO | Plus: Average Year-End Fair Value for Outstanding and Unvested Stock and Option Awards Granted in the Covered Year        
Pay vs Performance Disclosure        
Adjustment to Compensation, Amount 201,875      
Non-PEO NEO | Plus: Average Change in Fair Value of Stock and Option Awards from Prior Years that Vested in the Covered Year        
Pay vs Performance Disclosure        
Adjustment to Compensation, Amount (7,131)      
Non-PEO NEO | Less: Average End of Prior Year Fair Value of Stock and Option Awards Forfeited during the Covered Year        
Pay vs Performance Disclosure        
Adjustment to Compensation, Amount $ (112,707)