Pay vs Performance Disclosure - USD ($)
Dec. 31, 2025
Dec. 31, 2024
Dec. 31, 2023
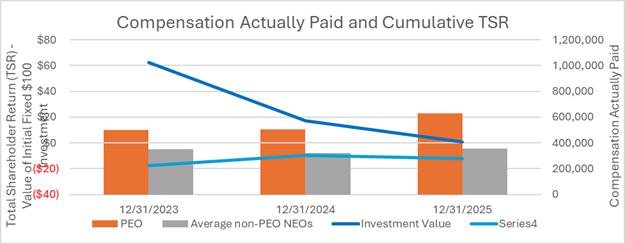
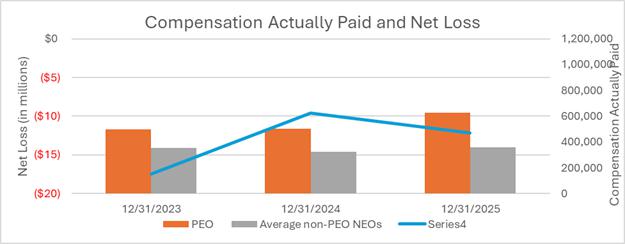
| Year | Summary Compensation Table Total for PEO ($) (1) | Compensation Actually Paid to PEO ($) (2) | Average Summary Compensation Table Total for Non-PEO NEOs ($) (3) | Average Compensation Actually Paid to Non-PEO NEOs ($) (2) | Value of Initial Fixed $100 Investment Based On Total Shareholder Return ($) (4) | Net Loss (million) ($) | ||||||||||||||||||
| 2025 | 879,541 | 628,172 | 465,808 | 352,094 | $ | 0.97 | (12.1 | ) | ||||||||||||||||
| 2024 | 611,533 | 503,726 | 376,291 | 323,665 | $ | 17.23 | (9.6 | ) | ||||||||||||||||
| 2023 | 577,094 | 498,232 | 364,099 | 352,071 | $ | 62.50 | (17.5 | ) | ||||||||||||||||
| (3) | The names of each of the NEOs (excluding our PEO) included for purposes of calculating the average amounts in each applicable year are as follows: (i) for 2025, Kevin Coveney, Chief Financial Officer and Dr. Peter Facchini, Chief Innovation Officer; (ii) for 2024, Kevin Coveney, Chief Financial Officer and Dr. Peter Facchini, Chief Innovation Officer; and (iii) for 2023, Kevin Coveney, Chief Financial Officer, Avani Kanubaddi, President and Chief Operating Officer, and Dr. Peter Facchini, Chief Innovation Officer. The amounts disclosed reflect the adjustments listed in the tables below to the amounts reported in the Summary Compensation Table for Non-PEO NEOs. |
| 2025 | 2024 | 2023 | ||||||||||||||||||||||
Current PEO |
Non-PEO NEOs (Average) |
Current PEO |
Non-PEO NEOs (Average) |
Current PEO |
Non-PEO NEOs (Average) |
|||||||||||||||||||
| Reported Summary Compensation Table total | 879,541 | $ | 465,808 | 611,533 | $ | 376,291 | 577,094 | $ | 364,099 | |||||||||||||||
| Less, value of Stock Awards reported in Summary Compensation Table | (407,142) | (156,643) | (152,893 | ) | (76,156 | ) | (126,309 | ) | (42,410 | ) | ||||||||||||||
| Plus, year-end fair value of outstanding and unvested equity awards granted in the year | 248,778 | 87,911 | 93,768 | 44,801 | 57,213 | 18,857 | ||||||||||||||||||
| Plus (less) fair value as of vesting date of equity awards that were granted and vested in the Year | 11,800 | |||||||||||||||||||||||
| Plus (less), year over year change in fair value of outstanding and unvested equity awards granted in prior years | (64,452) | (14,504) | (32,846 | ) | (1,875 | ) | (8,775 | ) | 9,947 | |||||||||||||||
| Plus (less), change in fair value from last day of prior year to vesting date of equity awards vested in the year | (28,553) | (30,479) | (6,086 | ) | (15,983 | ) | 444 | (2,048 | ) | |||||||||||||||
| Less, prior year-end fair value for equity awards forfeited in the year | 0 | 0 | (9,750 | ) | (3,413 | ) | (1,435 | ) | (8,174 | ) | ||||||||||||||
| Compensation actually paid | 628,172 | 352,094 | 503,726 | 323,665 | 498,232 | 352,071 | ||||||||||||||||||
| [1] | Compensation actually paid reported for the PEOs and the average of the non-PEO NEOs is calculated by adjusting the summary compensation totals in accordance with SEC rules and do not reflect the total compensation actually realized or received. The table below shows the additions and deductions to calculate “” in each fiscal year as compared to the total compensation reported in the Summary Compensation Table. Equity values are calculated in accordance with FASB ASC Topic 718, and the valuation assumptions used to calculate fair values did not materially differ from those disclosed at the time of the grant. |
| [2] | The names of each of the NEOs (excluding our PEO) included for purposes of calculating the average amounts in each applicable year are as follows: (i) for 2025, Kevin Coveney, Chief Financial Officer and Dr. Peter Facchini, Chief Innovation Officer; (ii) for 2024, Kevin Coveney, Chief Financial Officer and Dr. Peter Facchini, Chief Innovation Officer; and (iii) for 2023, Kevin Coveney, Chief Financial Officer, Avani Kanubaddi, President and Chief Operating Officer, and Dr. Peter Facchini, Chief Innovation Officer. The amounts disclosed reflect the adjustments listed in the tables below to the amounts reported in the Summary Compensation Table for Non-PEO NEOs. |
| [3] | The cumulative total shareholder return (“”) measures the cumulative value of $100 invested on the last trading day before the earliest fiscal year in the table, or December 31, 2022, including the reinvestment of dividends, through and including the end of the applicable fiscal year for which TSR is calculated, or December 31, 2025, 2024, and 2023. The Company did not pay dividends in the periods presented. |
| [4] | Dr. Joseph Tucker was our PEO for fiscal years 2025, 2024, and 2023. |