Pay vs Performance Disclosure - USD ($)
Feb. 24, 2025
Dec. 31, 2025
Dec. 31, 2025
Dec. 31, 2024
Dec. 31, 2023
Pay Versus Performance Disclosure
The following table sets forth information regarding the compensation actually paid to our CEO and our other Named Executive Officers compared to certain performance measures for the years ended December 31, 2025, 2024 and 2023.
The disclosure included in this section is prescribed by SEC rules and does not necessarily align with how we or our Compensation Committee views the link between Company performance and our Named Executive Officers’ pay. As a clinical-stage biotech company, our executive compensation program does not utilize the Company’s financial results as the primary indicator to determine executive compensation. We believe that the creation of sustainable long-term shareholder value depends on our ability to maximize opportunities for our hepatitis B development programs and our in-house developed LNP delivery technology. Consequently, our Compensation Committee has designed our executive compensation program to incentivize our executive officers to create that value through the clinical development of our drug candidates and through protecting and defending our intellectual property. In determining the amount of the annual incentive award for each of our executive officers, including each of our Named Executive Officers, the Compensation Committee evaluated the corporate performance objectives that had been established for the calendar year as well as other corporate and individual achievements and performance throughout the year. These performance objectives included milestones for our lead product candidates and other business objectives. Additionally, grants of equity awards, primarily stock options and restricted stock units, to our executive officers are intended to incentivize future value creation and to align the long-term interests of our executive officers with Shareholders. For further discussion of how the Company views its executive compensation structure, including alignment with Company performance, see above under “Narrative Disclosure to Summary Compensation Table”. The Compensation Committee did not consider the pay versus performance disclosure below in making its pay decisions for any of the years shown.
The “Compensation Actually Paid”, which is presented in the table below, is defined by the SEC and does not reflect amounts actually paid, earned or received by our Named Executive Officers. A significant portion of the “Compensation Actually Paid” amounts shown relate to changes in values of unvested equity awards over the course of the applicable reporting year. These unvested awards remain subject to significant risk from forfeiture conditions and possible future declines in value based on changes in our share price. The ultimate values actually realized by our Named Executive Officers from unvested equity awards, if any, cannot be determined until the awards fully vest and are exercised or settled, as the case may be.
Year | Summary Compensation Table Total for PEO1(1)(2) | Compensation Actually Paid to PEO1(3) | Summary Compensation Table Total for PEO2(1)(2) | Compensation Actually Paid to PEO2(3) | Average Summary Compensation Table Total for non-PEO NEOs(1)(2) | Average Compensation Actually Paid to non-PEO NEOs(3) | Value of Initial Fixed $100 Investment based on Total Shareholder Return | Net Income/ (Loss) | ||||||||||||||||
2025 | $3,578,150 | $1,145,629 | $1,369,013 | $1,656,748 | $2,317,678 | $1,956,318 | $206 | $(33,501,000) | ||||||||||||||||
2024 | $2,110,083 | $2,592,023 | $— | $— | $1,781,092 | $2,207,723 | $140 | $(69,920,000) | ||||||||||||||||
2023 | $3,385,984 | $3,268,381 | $— | $— | $1,692,632 | $1,594,078 | $107 | $(72,849,000) | ||||||||||||||||
(1) | For 2025, the first principal executive officer (“PEO1”) was Mr. McElhaugh, our former Interim Chief Executive Officer whose employment was terminated effective February 24, 2025, and the second principal executive officer (“PEO2”) was Ms. Androski, who was appointed Chief Executive Officer effective February 24, 2025. For 2024, PEO1 was Mr. McElhaugh. For 2023, PEO1 was William Collier, our former Chief Executive Officer who retired on December 31, 2023. There was no PEO2 in 2024 and 2023. For 2025, the other Named Executive Officers (“NEOs”) were Mr. Nguyen and Mr. Hastings. For 2024, the other NEOs were Mr. Hastings, Karen Sims, MD, PhD and Michael Sofia, PhD. For 2023, the other NEOs were Mr. McElhaugh, Dr. Sofia and Elizabeth Howard, PhD. |
(2) | The values in this column reflect the “Total” compensation set forth in the Summary Compensation Table (“SCT”) on page 31. See the footnotes to the SCT for further detail regarding the amounts in this column. |
(3) | “Compensation Actually Paid” is defined by the SEC and is computed in accordance with SEC rules by subtracting the amounts in the “Stock Awards” and “Option Awards” column of the SCT for each year from the “Total” column of the SCT and then: (i) adding the fair value as of the end of the reported year of all awards granted during the reporting year that are outstanding and unvested as of the end of the reporting year; (ii) adding the amount equal to the change as of the end of the reporting year (from the end of the prior year) in fair value (whether positive or negative) of any awards granted in any prior year that are outstanding and unvested as of the end of the reporting year; (iii) adding, for awards that are granted and vest in the reporting year, the fair value as of the vesting date; (iv) adding the amount equal to the change as of the vesting date (from the end of the prior fiscal year) in fair value (whether positive or negative) of any awards granted in any prior year for which all applicable vesting conditions were satisfied at the end of or during the reporting year; (v) subtracting, for any awards granted in any prior year |
that are forfeited during the reporting year, the amount equal to the fair value at the end of the prior year; and (vi) adding the value of any dividends (or dividend equivalents) paid in the reporting year on unvested equity awards and the value of accrued dividends (or dividend equivalents) paid on performance awards that vested in the reporting year. The valuation assumptions used to calculate fair values did not materially differ from those disclosed at the time of grant.
The following tables reflect the adjustments made to SCT total compensation to compute “Compensation Actually Paid” for our Principal Executive Officers and average for our other NEOs.
Year | PEO | SCT Total Comp | Minus SCT Stock Awards and Option Awards | Plus Value of New Unvested Awards | Plus Change in Value of Prior Years Unvested Awards | Plus Value of New Vested Awards | Plus Change in Value of Prior Years Vested Awards | Equals Compensation Actually Paid | ||||||||||||||||
2025 | Ms. Androski | $1,369,013 | $(714,751) | $1,002,486 | $— | $— | $— | $1,656,748 | ||||||||||||||||
2025 | Mr. McElhaugh | $3,578,150 | $(2,437,825) | $— | $— | $— | $5,304 | $1,145,629 | ||||||||||||||||
2024 | Mr. McElhaugh | $2,110,083 | $(1,218,583) | $1,362,697 | $22,240 | $276,178 | $39,407 | $2,592,023 | ||||||||||||||||
2023 | Mr. Collier | $3,385,984 | $(2,525,326) | $1,921,931 | $83,390 | $343,105 | $59,296 | $3,268,381 | ||||||||||||||||
Other NEOs | SCT Total Comp | Minus SCT Stock Awards and Option Awards | Plus Value of New Unvested Awards | Plus Change in Value of Prior Years Unvested Awards | Plus Value of New Vested Awards | Plus Change in Value of Prior Years Vested Awards | Equals Compensation Actually Paid | ||||||||||||||
2025 | $2,317,678 | $(1,560,294) | $1,186,295 | $— | $9,328 | $3,311 | $1,956,318 | ||||||||||||||
2024 | $1,781,092 | $(1,059,756) | $1,185,088 | $26,653 | $239,935 | $34,711 | $2,207,723 | ||||||||||||||
2023 | $1,692,632 | $(915,819) | $678,960 | $17,908 | $117,349 | $3,047 | $1,594,078 | ||||||||||||||
(1) | For 2025, the first principal executive officer (“PEO1”) was Mr. McElhaugh, our former Interim Chief Executive Officer whose employment was terminated effective February 24, 2025, and the second principal executive officer (“PEO2”) was Ms. Androski, who was appointed Chief Executive Officer effective February 24, 2025. For 2024, PEO1 was Mr. McElhaugh. For 2023, PEO1 was William Collier, our former Chief Executive Officer who retired on December 31, 2023. There was no PEO2 in 2024 and 2023. For 2025, the other Named Executive Officers (“NEOs”) were Mr. Nguyen and Mr. Hastings. For 2024, the other NEOs were Mr. Hastings, Karen Sims, MD, PhD and Michael Sofia, PhD. For 2023, the other NEOs were Mr. McElhaugh, Dr. Sofia and Elizabeth Howard, PhD. |
(3) | “Compensation Actually Paid” is defined by the SEC and is computed in accordance with SEC rules by subtracting the amounts in the “Stock Awards” and “Option Awards” column of the SCT for each year from the “Total” column of the SCT and then: (i) adding the fair value as of the end of the reported year of all awards granted during the reporting year that are outstanding and unvested as of the end of the reporting year; (ii) adding the amount equal to the change as of the end of the reporting year (from the end of the prior year) in fair value (whether positive or negative) of any awards granted in any prior year that are outstanding and unvested as of the end of the reporting year; (iii) adding, for awards that are granted and vest in the reporting year, the fair value as of the vesting date; (iv) adding the amount equal to the change as of the vesting date (from the end of the prior fiscal year) in fair value (whether positive or negative) of any awards granted in any prior year for which all applicable vesting conditions were satisfied at the end of or during the reporting year; (v) subtracting, for any awards granted in any prior year |
that are forfeited during the reporting year, the amount equal to the fair value at the end of the prior year; and (vi) adding the value of any dividends (or dividend equivalents) paid in the reporting year on unvested equity awards and the value of accrued dividends (or dividend equivalents) paid on performance awards that vested in the reporting year. The valuation assumptions used to calculate fair values did not materially differ from those disclosed at the time of grant.
The following tables reflect the adjustments made to SCT total compensation to compute “Compensation Actually Paid” for our Principal Executive Officers and average for our other NEOs.
Year | PEO | SCT Total Comp | Minus SCT Stock Awards and Option Awards | Plus Value of New Unvested Awards | Plus Change in Value of Prior Years Unvested Awards | Plus Value of New Vested Awards | Plus Change in Value of Prior Years Vested Awards | Equals Compensation Actually Paid | ||||||||||||||||
2025 | Ms. Androski | $1,369,013 | $(714,751) | $1,002,486 | $— | $— | $— | $1,656,748 | ||||||||||||||||
2025 | Mr. McElhaugh | $3,578,150 | $(2,437,825) | $— | $— | $— | $5,304 | $1,145,629 | ||||||||||||||||
2024 | Mr. McElhaugh | $2,110,083 | $(1,218,583) | $1,362,697 | $22,240 | $276,178 | $39,407 | $2,592,023 | ||||||||||||||||
2023 | Mr. Collier | $3,385,984 | $(2,525,326) | $1,921,931 | $83,390 | $343,105 | $59,296 | $3,268,381 | ||||||||||||||||
(3) | “Compensation Actually Paid” is defined by the SEC and is computed in accordance with SEC rules by subtracting the amounts in the “Stock Awards” and “Option Awards” column of the SCT for each year from the “Total” column of the SCT and then: (i) adding the fair value as of the end of the reported year of all awards granted during the reporting year that are outstanding and unvested as of the end of the reporting year; (ii) adding the amount equal to the change as of the end of the reporting year (from the end of the prior year) in fair value (whether positive or negative) of any awards granted in any prior year that are outstanding and unvested as of the end of the reporting year; (iii) adding, for awards that are granted and vest in the reporting year, the fair value as of the vesting date; (iv) adding the amount equal to the change as of the vesting date (from the end of the prior fiscal year) in fair value (whether positive or negative) of any awards granted in any prior year for which all applicable vesting conditions were satisfied at the end of or during the reporting year; (v) subtracting, for any awards granted in any prior year |
that are forfeited during the reporting year, the amount equal to the fair value at the end of the prior year; and (vi) adding the value of any dividends (or dividend equivalents) paid in the reporting year on unvested equity awards and the value of accrued dividends (or dividend equivalents) paid on performance awards that vested in the reporting year. The valuation assumptions used to calculate fair values did not materially differ from those disclosed at the time of grant.
The following tables reflect the adjustments made to SCT total compensation to compute “Compensation Actually Paid” for our Principal Executive Officers and average for our other NEOs.
Other NEOs | SCT Total Comp | Minus SCT Stock Awards and Option Awards | Plus Value of New Unvested Awards | Plus Change in Value of Prior Years Unvested Awards | Plus Value of New Vested Awards | Plus Change in Value of Prior Years Vested Awards | Equals Compensation Actually Paid | ||||||||||||||
2025 | $2,317,678 | $(1,560,294) | $1,186,295 | $— | $9,328 | $3,311 | $1,956,318 | ||||||||||||||
2024 | $1,781,092 | $(1,059,756) | $1,185,088 | $26,653 | $239,935 | $34,711 | $2,207,723 | ||||||||||||||
2023 | $1,692,632 | $(915,819) | $678,960 | $17,908 | $117,349 | $3,047 | $1,594,078 | ||||||||||||||
Compensation Actually Paid and Cumulative Total Shareholder Return
The graph below compares the compensation actually paid to our Principal Executive Officers (“PEOs”) and the average of the compensation actually paid to our remaining NEOs, with our cumulative Total Shareholder Return for the fiscal years ended December 31, 2025, 2024 and 2023. Total Shareholder Return amounts reported in the graph assume an initial fixed investment of $100 on December 31, 2022.
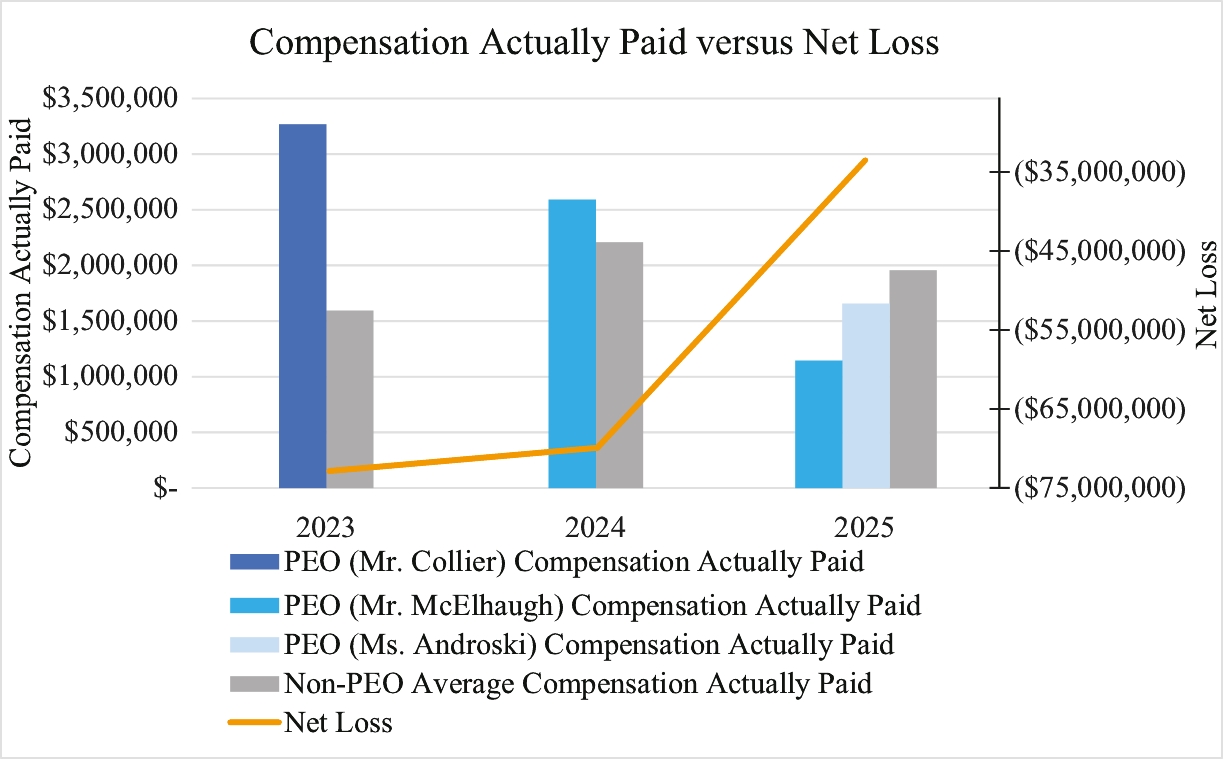
Compensation Actually Paid and Net Loss
The graph below compares the compensation actually paid to our PEOs and the average of the compensation actually paid to our remaining NEOs, with our net loss for the fiscal years ended December 31, 2025, 2024 and 2023.