| Year | Summary Compensation Table Total for Principal Executive Officer (“PEO”)(1) | Compensation Actually Paid to PEO(2) | Average Summary Compensation Table Total for Non-PEO Named Executive Officers (“NEOs”)(3) | Average Compensation Actually Paid to Non- PEO NEOs(4) | Value of Initial Fixed $100 Investment Based on Total Shareholder Return (“TSR”)(5) | Net Income (Loss) (millions)(6) | ||||||||||||||||||
| (a) | (b) | (c) | (d) | (e) | (f) | (g) | ||||||||||||||||||
| 2025 | $ | 390,000 | $ | 390,000 | $ | 284,000 | $ | 284,000 | $ | 42.32 | $ | (7.92 | ) | |||||||||||
| 2024 | $ | 993,375 | $ | 641,500 | $ | 313,289 | $ | 231,194 | $ | 73.86 | $ | (8.93 | ) | |||||||||||
| 2023 | $ | 585,368 | $ | 585,368 | $ | 287,132 | $ | 256,572 | $ | 16.03 | $ | (18.50 | ) | |||||||||||
| (1) | The dollar amounts reported in column (b) for the year ended December 31, 2025, are the amounts of total compensation reported for Thomas J. DeRosa (our current Chief Executive Officer). The dollar amounts reported in column (b) for the years 2024 and 2023 are the amounts of total compensation reported for Luke D’Angelo (our former Chief Executive Officer) for each corresponding year in the “Total” column of the Summary Compensation Table. Refer to “Executive Compensation—Summary Compensation Table.” |
| (5) | Cumulative TSR is calculated by dividing the sum of the cumulative amount of dividends for the measurement period, assuming dividend reinvestment, and the difference between our company’s share price at the end and the beginning of the measurement period by our company’s share price at the beginning of the measurement period. No dividends were paid on stock or option awards in any years. |
| (6) | The dollar amounts reported represent the amount of net income (loss) reflected in our consolidated audited financial statements for the applicable year. |
| (2) | The dollar amounts reported in column (c) represent the amount of “compensation actually paid” to Thomas J. DeRosa (2025) and Luke D’Angelo (2024 and 2023), as computed in accordance with Item 402(v) of Regulation S-K. The dollar amounts do not reflect the actual amount of compensation earned by or paid to Mr. D’Angelo during the applicable year. In accordance with the requirements of Item 402(v) of Regulation S-K, the following adjustments were made to Mr. D’Angelo’s total compensation for each year to determine the compensation actually paid, and provided in the table below: |
| Year | Reported Summary Compensation Table Total for PEO | Reported Value of Equity Awards (a) | Equity Award Adjustments (b) | Compensation Actually Paid to PEO | ||||||||||||
| 2025 | $ | 390,000 | $ | – | $ | – | $ | 390,000 | ||||||||
| 2024 | $ | 993,375 | $ | (718,375 | ) | $ | 366,500 | $ | 641,500 | |||||||
| 2023 | $ | 585,368 | $ | (271,500 | ) | $ | 271,500 | $ | 585,368 | |||||||
| (a) | The grant date fair value of equity awards represents the total of the amounts reported in the “Option Awards” columns in the Summary Compensation Table for the applicable year. | |
| (b) | The equity award adjustments for each applicable year include the addition (or subtraction, as applicable) of the following: (i) the year-end fair value of any equity awards granted in the applicable year that are outstanding and unvested as of the end of the year; (ii) the amount of change as of the end of the applicable year (from the end of the prior fiscal year) in fair value of any awards granted in prior years that are outstanding and unvested as of the end of the applicable year; (iii) for awards that are granted and vest in same applicable year, the fair value as of the vesting date; (iv) for awards granted in prior years that vest in the applicable year, the amount equal to the change as of the vesting date (from the end of the prior fiscal year) in fair value; (v) for awards granted in prior years that are determined to fail to meet the applicable vesting conditions during the applicable year, a deduction for the amount equal to the fair value at the end of the prior fiscal year; and (vi) the dollar value of any dividends or other earnings paid on stock or option awards in the applicable year prior to the vesting date that are not otherwise reflected in the fair value of such award or included in any other component of total compensation for the applicable year. The valuation assumptions used to calculate fair values did not materially differ from those disclosed at the time of grant. The amounts deducted or added in calculating the equity award adjustments are as follows: |
| Year | Year End Fair Value of Outstanding and Unvested Equity Awards Granted in the Year | Year over Year Change in Fair Value of Outstanding and Unvested Equity Awards Granted in Prior Years | Fair Value as of Vesting Date of Equity Awards Granted and Vested in the Year | Year over Year Change in Fair Value of Equity Awards Granted in Prior Years that Vested in the Year | Fair Value at the End of the Prior Year of Equity Awards that Failed to Meet Vesting Conditions in the Year | Value of Dividends or other Earnings Paid on Stock or Option Awards not Otherwise Reflected in Fair Value or Total Compensation | Total Equity Award Adjustments | |||||||||||||||||||||
| 2025 | $ | – | $ | – | $ | – | $ | – | $ | – | $ | – | $ | – | ||||||||||||||
| 2024 | $ | 276,250 | $ | – | $ | 90,250 | $ | – | $ | – | $ | – | $ | 366,500 | ||||||||||||||
| 2023 | $ | – | $ | – | $ | 271,500 | $ | – | $ | – | $ | – | $ | 271,500 | ||||||||||||||
| (3) | The dollar amounts reported in column (d) represent the average of the amounts reported for our company’s named executive officers as a group (excluding Thomas J. DeRosa and Luke D’Angelo) in the “Total” column of the Summary Compensation Table in each applicable year. The names of each of the named executive officers (excluding Mr. DeRosa and Mr. D’Angelo) included for purposes of calculating the average amounts in each applicable year are as follows: for 2025, Felipe A. Corrado IV, and for 2024 and 2023, Meilin Yu and Virgilio Llapitan. |
| (4) | The dollar amounts reported in column (e) represent the average amount of “compensation actually paid” to the named executive officers as a group (excluding Thomas J. DeRosa and Luke D’Angelo), as computed in accordance with Item 402(v) of Regulation S-K. The dollar amounts do not reflect the actual average amount of compensation earned by or paid to the named executive officers as a group (excluding Mr. DeRosa and Mr. D’Angelo) during the applicable year. In accordance with the requirements of Item 402(v) of Regulation S-K, the following adjustments were made to average total compensation for the named executive officers as a group (excluding Mr. DeRosa and Mr. D’Angelo) for each year to determine the compensation actually paid, using the same methodology described above in Note (2): |
| Year | Average Reported Summary Compensation Table Total for Non-PEO NEOs | Average Reported Value of Equity Awards | Average Equity Award Adjustments(a) | Average Compensation Actually Paid to Non- PEO NEOs | ||||||||||||
| 2025 | $ | 284,000 | $ | – | $ | – | $ | 284,000 | ||||||||
| 2024 | $ | 313,289 | $ | (92,721 | ) | $ | 10,625 | $ | 231,194 | |||||||
| 2023 | $ | 287,132 | $ | (109,184 | ) | $ | 78,625 | $ | 256,572 | |||||||
| (a) | The amounts deducted or added in calculating the total average equity award adjustments are as follows: |
| Year | Year End Fair Value of Outstanding and Unvested Equity Awards Granted in the Year | Year over Year Change in Fair Value of Outstanding and Unvested Equity Awards Granted in Prior Years | Fair Value as of Vesting Date of Equity Awards Granted and Vested in the Year | Year over Year Change in Fair Value of Equity Awards Granted in Prior Years that Vested in the Year | Fair Value at the End of the Prior Year of Equity Awards that Failed to Meet Vesting Conditions in the Year | Value of Dividends or other Earnings Paid on Stock or Option Awards not Otherwise Reflected in Fair Value or Total Compensation | Total Equity Award Adjustments | |||||||||||||||||||||
| 2025 | $ | – | $ | – | $ | – | $ | – | $ | – | $ | – | $ | – | ||||||||||||||
| 2024 | $ | 93,925 | $ | (115,600 | ) | $ | 32,300 | $ | – | $ | – | $ | – | $ | 10,625 | |||||||||||||
| 2023 | $ | – | $ | (2,391 | ) | $ | 81,016 | $ | – | $ | – | $ | – | $ | 78,625 | |||||||||||||
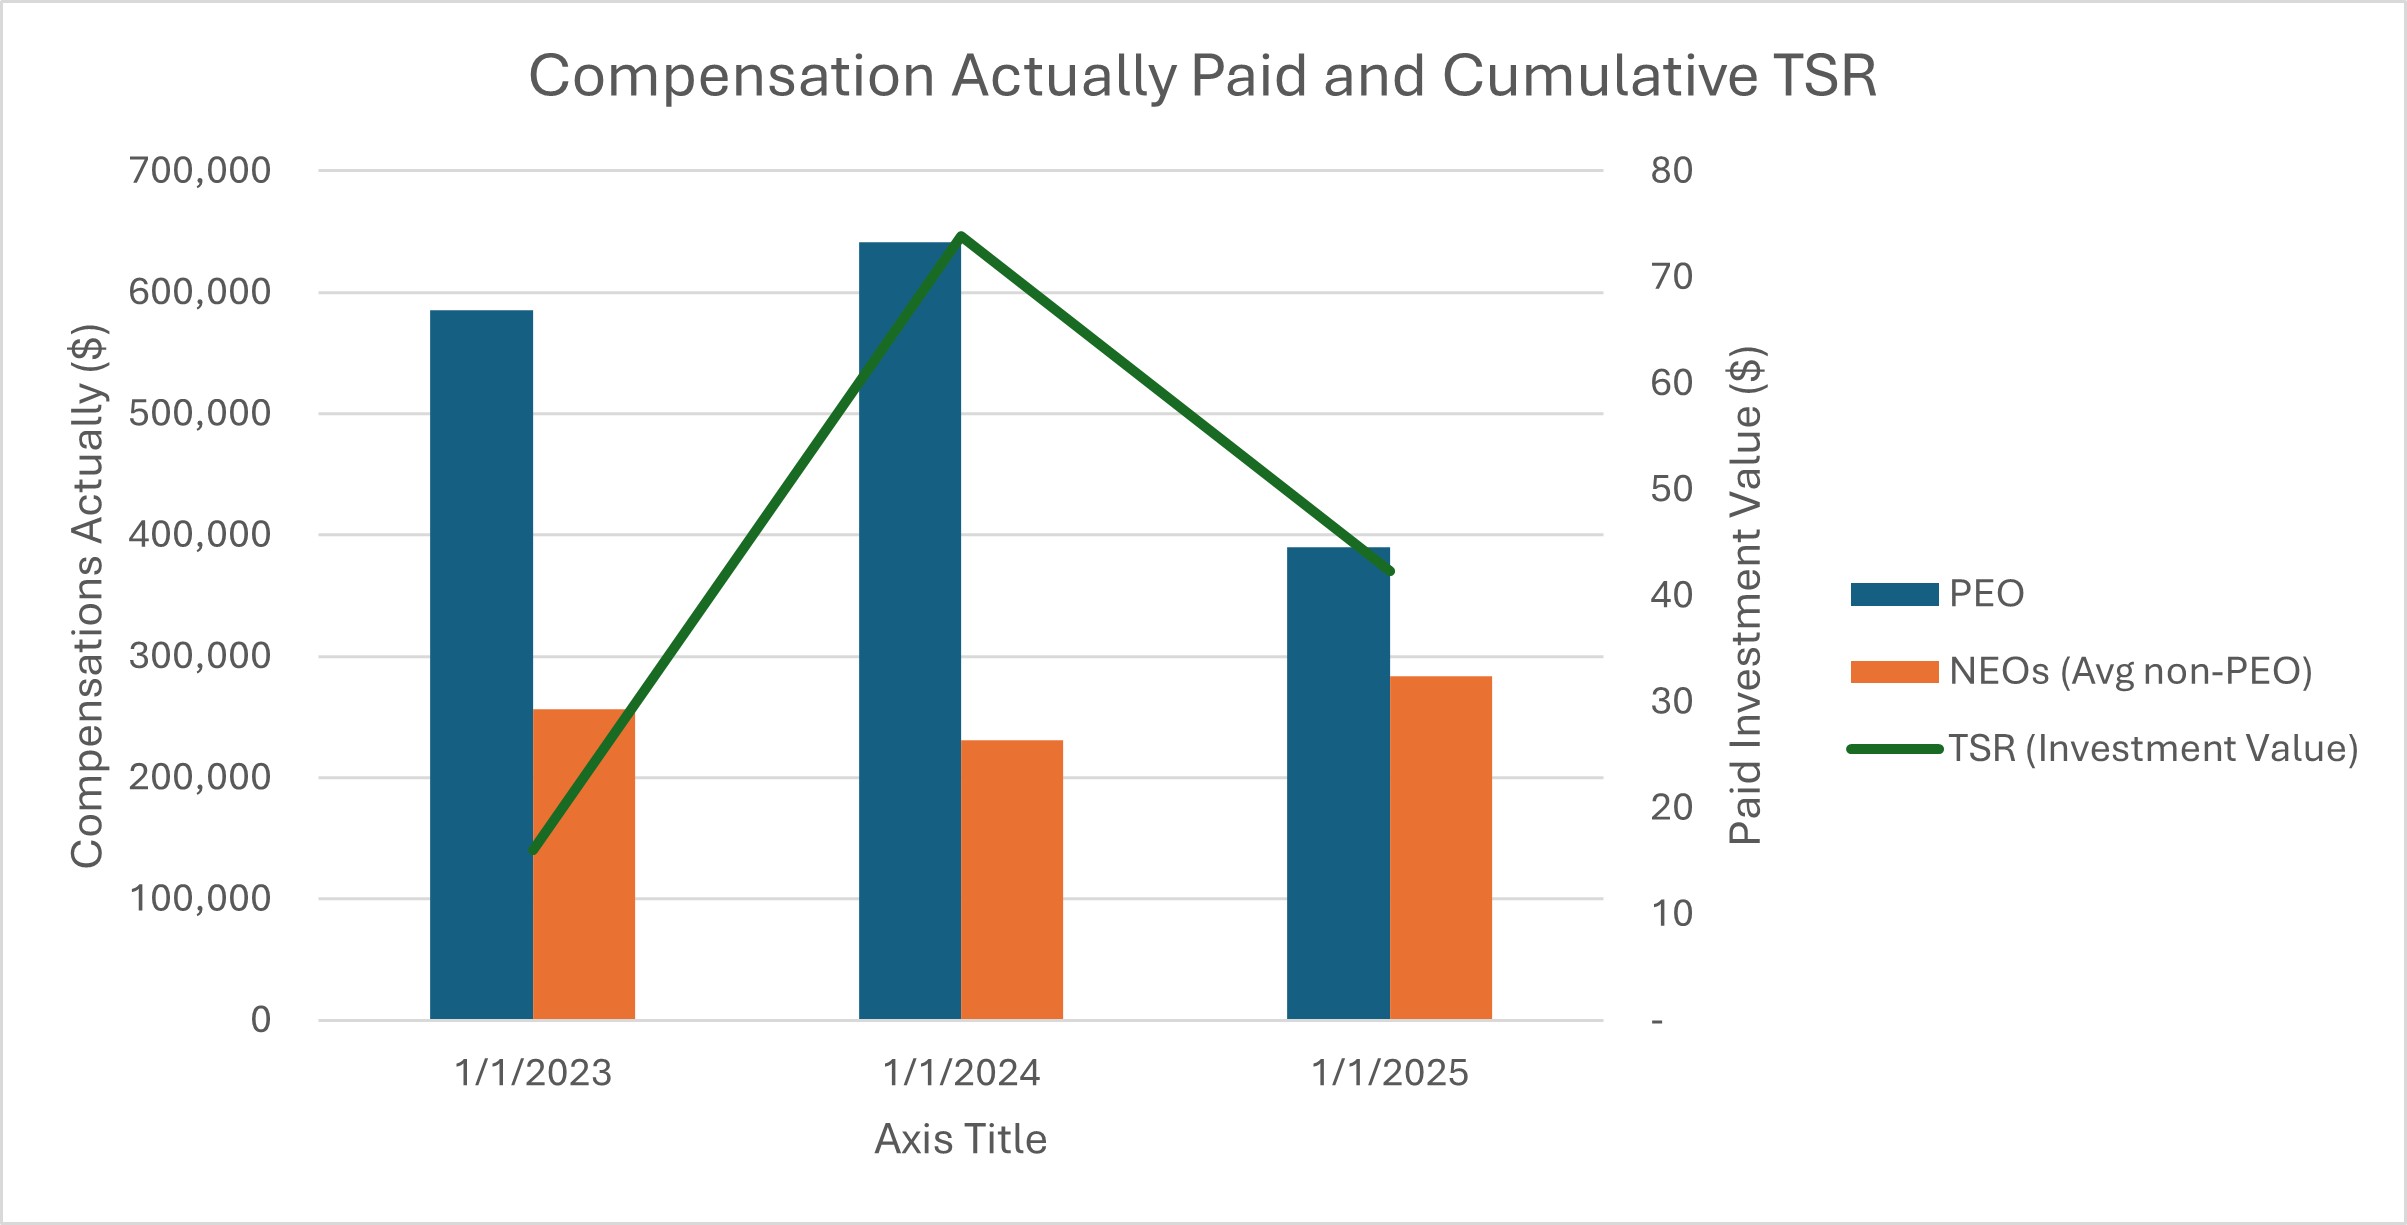
As shown in the following graph, the compensation actually paid to Luke D’Angelo and the average amount of compensation actually paid to our named executive officers as a group (excluding Mr. DeRosa and Mr. D’Angelo) during the periods presented are negatively correlated. We do utilize several performance measures to align executive compensation with our performance, but those tend not to be financial performance measures, such as the total shareholder return “TSR”. For example, as described in more detail above in the section “Executive Compensation – Annual Performance-Based Bonus Opportunity,” part of the compensation our named executive officers are eligible to receive consists of annual performance-based cash bonuses which are designed to provide appropriate incentives to our executives to achieve defined annual corporate goals and to reward our executives for individual achievement towards these goals, subject to certain employment criteria as described above under “—Agreements with our Named Executive Officers.” Additionally, we view stock options, which are an integral part of our executive compensation program, as related to company performance, although not directly tied to TSR, because they provide value only if the market price of our common stock increases and if the executive officer continues in our employment over the vesting period. These stock option awards strongly align our executive officers’ interests with those of our stockholders by providing a continuing financial incentive to maximize long-term value for our stockholders and by encouraging our executive officers to continue in our employment for the long term.
Compensation Actually Paid and Net Income (Loss)
Our platform is commercially viable and ready to board accounts. We operate in the fintech industry and had merchant processing revenue during the periods presented. Our company has not historically looked to net income (loss) as a performance measure for our executive compensation program. Our net income (loss) decreased significantly between 2023 and 2022, and the compensation actually paid for both our PEO and non-PEO NEOs also decreased significantly between 2023 and 2022.