Pay Versus Performance
As required by Section 953(a) of the Dodd-Frank Wall Street Reform and Consumer Protection Act, and Item 402(v) of Regulation S-K, the Company is providing the following information about the relationship between executive compensation actually paid and certain financial performance of the Company. The disclosure provided in the tables below is prescribed by SEC rules and does not necessarily align with how the Company or the Compensation Committee views the link between the Company’s performance and its named executive officer (NEO) compensation. In particular, the Company does not use any specific financial performance measure to link executive compensation actually paid to the Company’s financial performance. For further information concerning the Company’s compensation philosophy and how the Company’s aligns executive compensation with the Company’s performance, refer to “Executive Compensation and Other Information – Compensation Discussion and Analysis.”
|
|
|
|
Average |
|
Value of Initial Fixed $100 Investment Based On: |
|
|||||||||||||||
| Year |
Summary Compensation Table Total for PEO(1) |
Compensation Actually Paid to PEO(2) |
Summary Compensation Table Total for Non-PEO NEOs(3) |
Average Compensation Actually Paid to Non-PEO NEOs(4) |
Total Shareholder Return(5) |
Peer Group Total Shareholder Return(6) |
Net Income (in thousands)(7) |
||||||||||||||
|
(a) |
(b) |
(c) |
(d) |
(e) |
(f) |
(g) |
(h) |
||||||||||||||
|
2025 |
754,299 | 799,071 | 347,935 | 361,533 | $152.68 | $43.80 | 33,083 | ||||||||||||||
|
2024 |
658,422 | 751,048 | 331,591 | 364,228 | $139.34 | $44.47 | 41,460 | ||||||||||||||
|
2023 |
653,625 | 732,485 | 294,814 | 316,948 | $107.23 | $51.87 | 34,559 | ||||||||||||||
|
2022 |
784,410 | 709,683 | 343,584 | 320,209 | $86.61 | $55.52 | 20,699 | ||||||||||||||
|
2021 |
755,904 | 743,709 | 340,587 | 333,585 | $98.18 | $103.56 | 25,654 | ||||||||||||||
|
(1) |
The PEO in each of the applicable years is Ms. Cohen (who has served as CEO since 1994). The dollar amounts reported in column (b) are the amounts of total compensation reported for Ms. Cohen for each corresponding year in the “Total” column of the Summary Compensation Table. Refer to “Executive Compensation and Other Information – Summary Compensation Table.” |
|
(2) |
The dollar amounts reported in column (c) represent the amount of “compensation actually paid” to Ms. Cohen, as computed in accordance with Item 402(v) of Regulation S-K and do not reflect the actual amount of compensation earned by or paid to Ms. Cohen during the applicable year. The analysis requires the need to deduct the grant date fair value of stock awards from the amount disclosed in the Summary Compensation Table and add back the year-end fair value of any stock awards granted during the fiscal year that are outstanding and unvested as of the end of the fiscal year. Since the Company's stock awards were historically awarded on 12/31 (i.e. the Grant Date was 12/31), this deduction and addback were the same amount for 2021 and 2022. Ms. Cohen did not receive a stock award based on 2023 performance. The grant date for stock awards based on 2024 performance was January 2, 2025, and therefore no stock awards are reported for fiscal 2024. Thus, no amounts were deducted and added back for the years 2023 and 2024. For the five years disclosed herein, the amount was $98,166 in 2025, $0 in 2024, $0 in 2023, $124,940 in 2022, and $99,995 in 2021. |
|
(3) |
The dollar amounts reported in column (d) represent the average of the amounts reported for the Company’s non-PEO named executive officers (NEOs) as a group in the “Total” column of the Summary Compensation Table in each applicable year. Our non-PEO NEOs for the applicable years were as follows: David Peuse, Douglas Frederick, John MacKenzie, and Jeffery Morgan for 2025, 2024 and 2023 and David Peuse, Douglas Frederick, Richard Jeffers, and Jeffery Morgan for each of 2022 and 2021. |
|
(4) |
The dollar amounts reported in column (e) represent the average amount of “compensation actually paid” to the non-PEO NEOs as a group, as computed in accordance with Item 402(v) of Regulation S-K and do not reflect the actual average amount of compensation earned by or paid to the non-PEO NEOs as a group during the applicable year. The analysis requires the need to deduct the grant date fair value of stock awards from the amount disclosed in the Summary Compensation Table and add back the year-end fair value of any awards granted during the fiscal year that are outstanding and unvested as of the end of the fiscal year. Since the Company's stock awards were historically awarded on 12/31 (i.e. the Grant Date was 12/31), this deduction and addback were the same amount for 2021 and 2022. The grant date for awards based on 2023 performance was January 2, 2024, and therefore, no stock awards are reported for fiscal 2023. Thus, no amounts were deducted and added back for the year 2023. The grant date for stock awards based on 2024 performance was January 2, 2025. For the non-PEO NEOs as a group during the five years disclosed herein, the average amount per non-PEO NEO was $31,855 in 2025, $22,562 in 2024, $0 in 2023, $41,042 in 2022, and $44,932 in 2021. |
|
(5) |
Cumulative total shareholder return (TSR) assumes $100 invested on December 31, 2020, in National Presto Industries, Inc. common stock. Total return assumes reinvestment of dividends. |
|
(6) |
Represents the weighted peer group TSR and assumes $100 invested on December 31, 2020, in the peer group companies with similar market capitalization. Total return assumes reinvestment of dividends. The peer group used for this purpose is the same peer group utilized for the stock performance graph in the applicable year’s annual report. The Company’s performance graph compares companies with a December 31 market capitalization similar to the Company. The Company adopted this approach because it was unable to reasonably identify a peer group based on its industries or lines of business. The companies represented in the peer group for each year are set forth below.
For 2025 the peer group consisted of American Axle & Manufacturing Holdings, Inc., Arvinas, Inc., Ballard Power Systems, Inc., Douglas Dynamics, Inc., Grid Dynamics Holdings, Inc., Lincoln Educational Services Corporation, Replimune Group, Inc., Scholastic Corporation, Seneca Foods Corporation, Teekay Corporation Ltd., The Real Brokerage, Inc., Valneva SE.
For 2024 the peer group consisted of Avanos Medical, Inc., Cantaloupe, Inc., EverQuote, Inc., Evolus, Inc., Funko, Inc., Gannett Co., Inc., HUYA, Inc., Iradimed Corporation, Inronwood Pharmaceuticals, Inc., JELD-WEN Holding, Inc., OneSpan, Inc., Shenandoah Telecommunications Company.
For 2023 the peer group consisted of AudioCodes, Ltd., Blink Charging Co., bluebird bio, Inc., Community Health Systems, Inc., Ennis, Inc., Haynes International, Inc., Heidrick & Struggles International, Inc. i3 Verticals, Inc., Interface, Inc., Kimball Electronics, Inc., P.A.M. Transportation Services, Inc., Sleep Number Corporation.
For 2022 the peer group consisted of CIRCOR International, Inc., Haverty Furniture Companies, Inc., Kezar Life Sciences, Inc., Lightwave Logic, Inc., MorphoSys AG, Nine Energy Service, Inc., Novonix Limited, Similarweb Ltd., Surmodics, Inc., trivago N.V., Tsakaos Energy Navigation Limited.
For 2021 the peer group consisted of Adaptimmune Therapeutics plc, Bioceres Crop Solutions Corp., Deciphera Pharmaceuticals, Inc., Earthstone Energy, Inc., Entravision Communications Corporation, IRadimed Corporation, Loop Industries, Inc., Pharming Group N.V., ProQR Therapeutics, N.V., RE/MAX Holdings, Inc., Taseko Mines Limited, The RMR Group, Inc. |
|
(7) |
The dollar amounts reported represent the amount of net income reflected in the Company’s audited financial statements for the applicable year. |
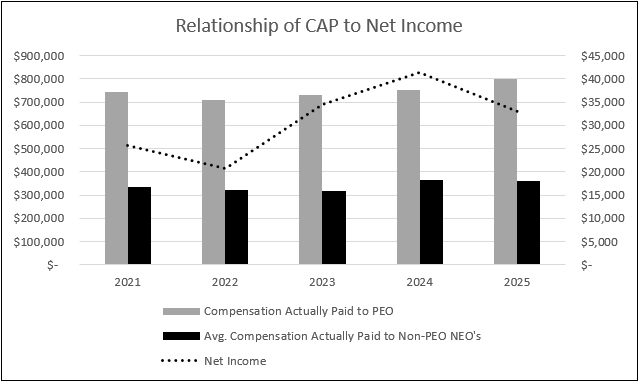
Relationship Between Compensation Actually Paid (CAP) and Performance
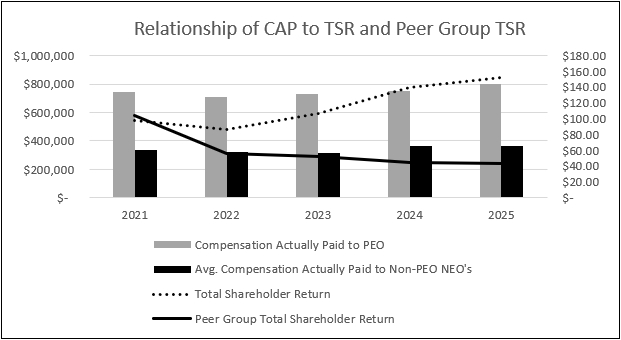
As described in greater detail in “Executive Compensation and Other Information – Compensation Discussion and Analysis,” the Company’s executive compensation program considers a variety of attributes. The factors that the Compensation Committee deems relevant for both our long-term and short-term incentive awards are selected based on objectives of providing a competitive total compensation program that enables the Company to attract, retain and motivate executive management employees, align the interests of the named executive officers with the interests of our stockholders, and reward individual performance. However, the Company does not use net income or any other financial performance measure as a proxy for the overall performance of the Company and, it does not base any specific element of executive compensation on TSR, net income or any other specific financial performance measure.