| Highly Confidential & Proprietary December 1, 2025 Project Jewel Discussion Materials Goldman Sachs & Co. DRAFT Preliminary – Subject to Refinement |
| 2 DRAFT Preliminary – Subject to Refinement Disclaimer These materials have been prepared by Goldman Sachs on a confidential basis for presentation solely to the special committee (the “Special Committee”) of Jewel (the “Company”) in connection with an informational presentation which Goldman Sachs is making to the Special Committee. These materials and Goldman Sachs’ presentation relating to these materials (collectively, the “Presentation”) may not be disclosed to any third party or circulated or referred to publicly or used for or relied upon for any other purpose without the written consent of Goldman Sachs. The Presentation was not prepared with a view to public disclosure or to conform to any disclosure standards under any state, federal or international securities laws or other laws, rules or regulations, and Goldman Sachs does not take any responsibility for the use of the Presentation by persons other than those set forth above. Notwithstanding anything in this Presentation to the contrary, the Company may disclose to any person the US federal income and state income tax treatment and tax structure of any transaction described herein and all materials of any kind (including tax opinions and other tax analyses) that are provided to the Company relating to such tax treatment and tax structure, without Goldman Sachs imposing any limitation of any kind. The Presentation has been prepared by the Investment Banking Division of Goldman Sachs and is not a product of its research department. Goldman Sachs and its affiliates are engaged in advisory, underwriting and financing, principal investing, sales and trading, research, investment management and other financial and non-financial activities and services for various persons and entities. Goldman Sachs and its affiliates and employees, and funds or other entities they manage or in which they invest or have other economic interest or with which they co-invest, may at any time purchase, sell, hold or vote long or short positions and investments in securities, derivatives, loans, commodities, currencies, credit default swaps and other financial instruments of the Company, any other party to any transaction and any of their respective affiliates or any currency or commodity that may be involved in any transaction. The firm’s clients and counterparties may now or in the future include persons and entities that are the subject of the Presentation and the firm may be, may have been or may become involved in other transactions and assignments with or involving these clients and counterparties and/or may have confidential information relating to these clients or counterparties. The Presentation is neither an expressed nor an implied commitment by Goldman Sachs to act in any capacity with respect to the Special Committee or the Company, which commitment shall only be set forth in an engagement letter to be executed between the Special Committee, the Company and Goldman Sachs, and does not restrict Goldman Sachs from being engaged by, or otherwise acting with, any other party in any capacity. Nothing contained herein shall be deemed to create a fiduciary, advisory, agency or other relationship between Goldman Sachs and the Special Committee, the Company or its stockholders, directors, officers, employees or creditors, nor shall any of the foregoing persons rely on this document or the presentation thereof. The Presentation has been prepared based on historical financial information, forecasts and other information obtained by Goldman Sachs from publicly available sources (other than information regarding the Company, which may have been obtained from the management of the Company). In preparing the Presentation, Goldman Sachs has relied upon and assumed, without assuming any responsibility for independent verification, the accuracy and completeness of all of the financial, legal, regulatory, tax, accounting and other information provided to, discussed with or reviewed by us, and Goldman Sachs does not assume any liability for any such information. Goldman Sachs does not provide accounting, tax, legal or regulatory advice. Goldman Sachs has not made an independent evaluation or appraisal of the assets and liabilities (including any contingent, derivative or off-balance sheet assets and liabilities) of the Company or any other party to any transaction or any of their respective affiliates and has no obligation to evaluate the solvency of the Company or any other party to any transaction under any state or federal laws relating to bankruptcy, insolvency or similar matters. The analyses contained in the Presentation do not purport to be appraisals nor do they necessarily reflect the prices at which businesses or securities actually may be sold or purchased. Any indications of value or synergies in the Presentation are based solely on public information, are for illustrative purposes only, and do not reflect actual values or synergies that may be achieved or realized by the Company or any views of Goldman Sachs with respect to any such values or synergies. The Presentation does not address the underlying business decision of the Special Committee or the Company to engage in any transaction, or the relative merits of any transaction or strategic alternative as compared to any other transaction or alternative that may be available to the Company. The Presentation is necessarily based on economic, monetary, market and other conditions as in effect on, and the information made available to Goldman Sachs as of, the date of such Presentation and Goldman Sachs assumes no responsibility for updating or revising the Presentation based on circumstances, developments or events occurring after such date. The Presentation does not constitute any opinion, nor does the Presentation constitute a recommendation to the Special Committee, the Company, any security holder of the Company or any other person as to how to vote or act with respect to any transaction or any other matter. The Presentation, including this disclaimer, are subject to, and governed by, any written agreement between the Special Committee, the Company and Goldman Sachs. |
| 3 DRAFT Preliminary – Subject to Refinement Topics for Discussion I. Feedback from management presentation with Trian and General Catalyst II. Update on outreach process and discussion with Victory's advisors III. Review of preliminary standalone JHG valuation analysis IV. Trian / General Catalyst engagement plan and next steps |
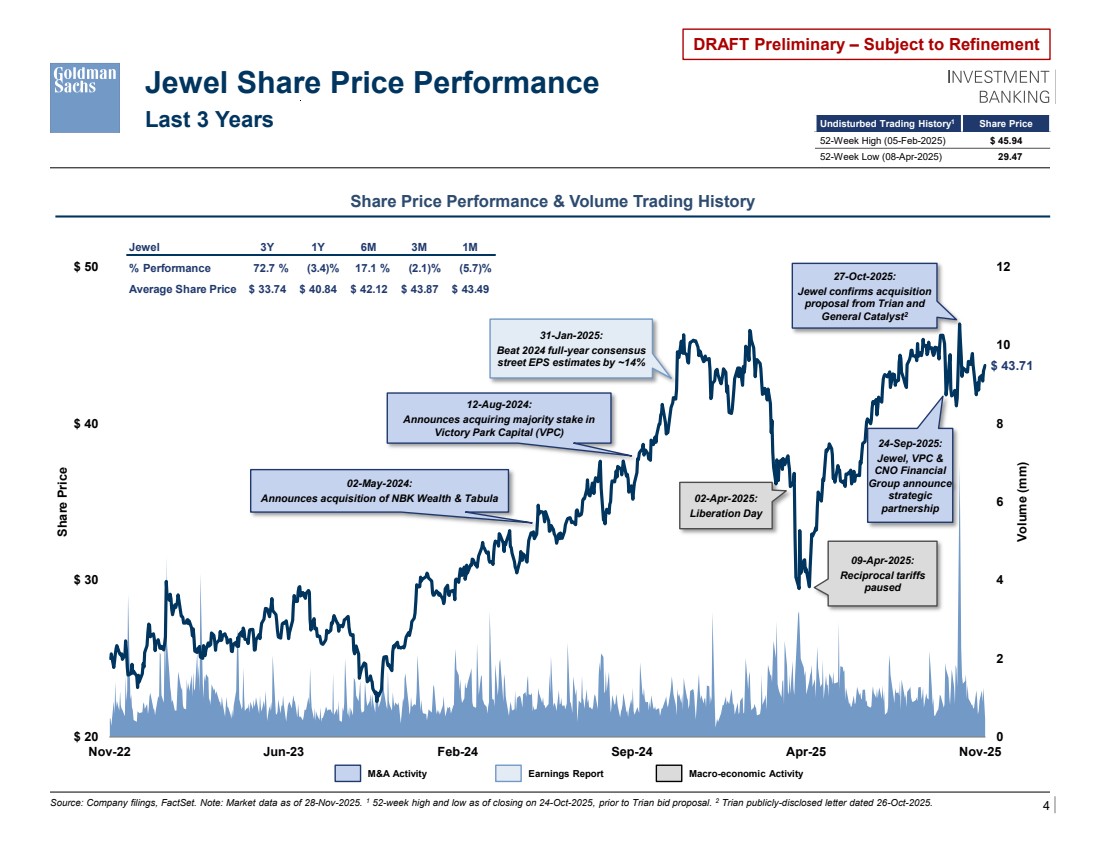
| 4 DRAFT Preliminary – Subject to Refinement $ 43.71 0 2 4 6 8 10 12 $ 20 $ 30 $ 40 $ 50 Nov-22 Jun-23 Feb-24 Sep-24 Apr-25 Nov-25 Volume (mm) Share Price Jewel Share Price Performance Source: Company filings, FactSet. Note: Market data as of 28-Nov-2025. 1 52-week high and low as of closing on 24-Oct-2025, prior to Trian bid proposal. 2 Trian publicly-disclosed letter dated 26-Oct-2025. 27-Oct-2025: Jewel confirms acquisition proposal from Trian and General Catalyst2 Last 3 Years Share Price Performance & Volume Trading History 02-Apr-2025: Liberation Day 31-Jan-2025: Beat 2024 full-year consensus street EPS estimates by ~14% 09-Apr-2025: Reciprocal tariffs paused 12-Aug-2024: Announces acquiring majority stake in Victory Park Capital (VPC) 24-Sep-2025: Jewel, VPC & CNO Financial Group announce strategic partnership 02-May-2024: Announces acquisition of NBK Wealth & Tabula M&A Activity Earnings Report Macro-economic Activity Undisturbed Trading History1 Share Price 52-Week High (05-Feb-2025) $ 45.94 52-Week Low (08-Apr-2025) $ 29.47 Jewel 3Y 1Y 6M 3M 1M % Performance 72.7 % (3.4)% 17.1 % (2.1)% (5.7)% Average Share Price $ 33.74 $ 40.84 $ 42.12 $ 43.87 $ 43.49 |
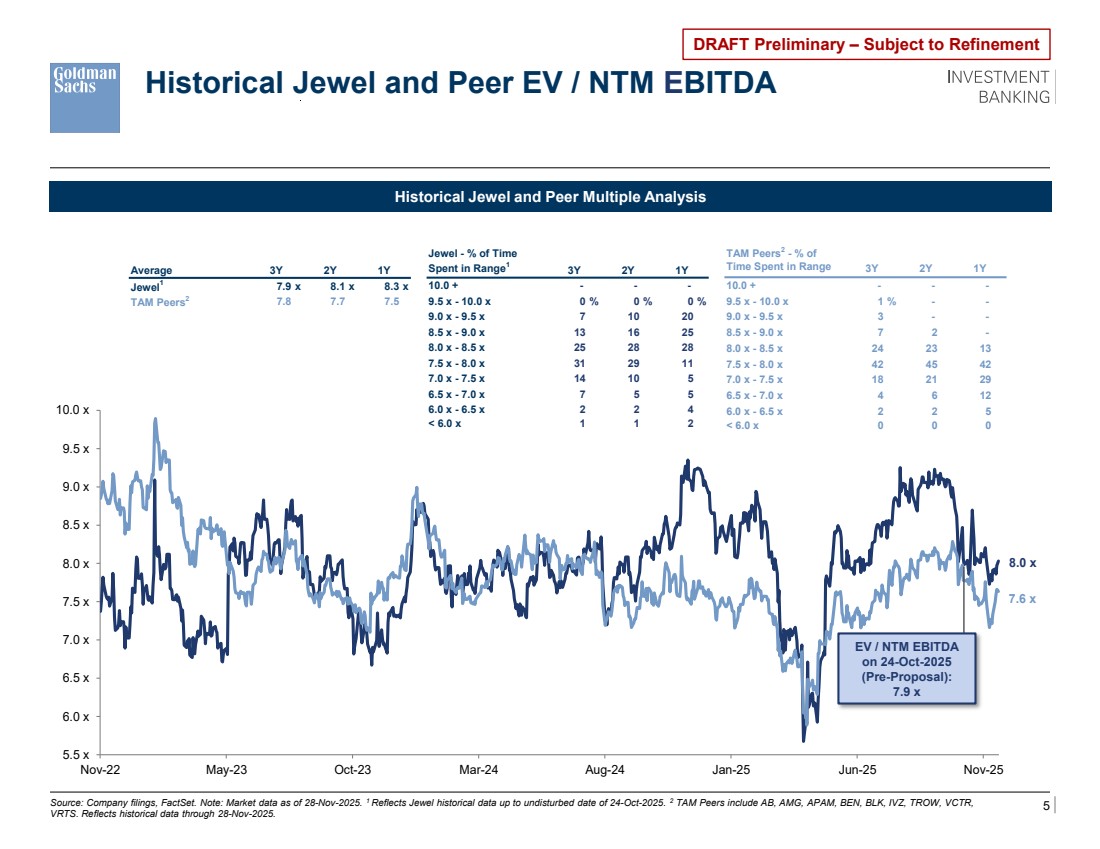
| 5 DRAFT Preliminary – Subject to Refinement 8.0 x 7.6 x 5.5 x 6.0 x 6.5 x 7.0 x 7.5 x 8.0 x 8.5 x 9.0 x 9.5 x 10.0 x Nov-22 May-23 Oct-23 Mar-24 Aug-24 Jan-25 Jun-25 Nov-25 EV / NTM EBITDA on 24-Oct-2025 (Pre-Proposal): 7.9 x Historical Jewel and Peer EV / NTM EBITDA Historical Jewel and Peer Multiple Analysis Source: Company filings, FactSet. Note: Market data as of 28-Nov-2025. 1 Reflects Jewel historical data up to undisturbed date of 24-Oct-2025. 2 TAM Peers include AB, AMG, APAM, BEN, BLK, IVZ, TROW, VCTR, VRTS. Reflects historical data through 28-Nov-2025. Average 3Y 2Y 1Y Jewel1 7.9 x 8.1 x 8.3 x TAM Peers2 7.8 7.7 7.5 Jewel - % of Time Spent in Range1 3Y 2Y 1Y 10.0 + - - - 9.5 x - 10.0 x 0 % 0 % 0 % 9.0 x - 9.5 x 7 10 20 8.5 x - 9.0 x 13 16 25 8.0 x - 8.5 x 25 28 28 7.5 x - 8.0 x 31 29 11 7.0 x - 7.5 x 14 10 5 6.5 x - 7.0 x 7 5 5 6.0 x - 6.5 x 2 2 4 < 6.0 x 1 1 2 TAM Peers2 - % of Time Spent in Range 3Y 2Y 1Y 10.0 + - - - 9.5 x - 10.0 x 1 % - - 9.0 x - 9.5 x 3 - - 8.5 x - 9.0 x 7 2 - 8.0 x - 8.5 x 24 23 13 7.5 x - 8.0 x 42 45 42 7.0 x - 7.5 x 18 21 29 6.5 x - 7.0 x 4 6 12 6.0 x - 6.5 x 2 2 5 < 6.0 x 0 0 0 |
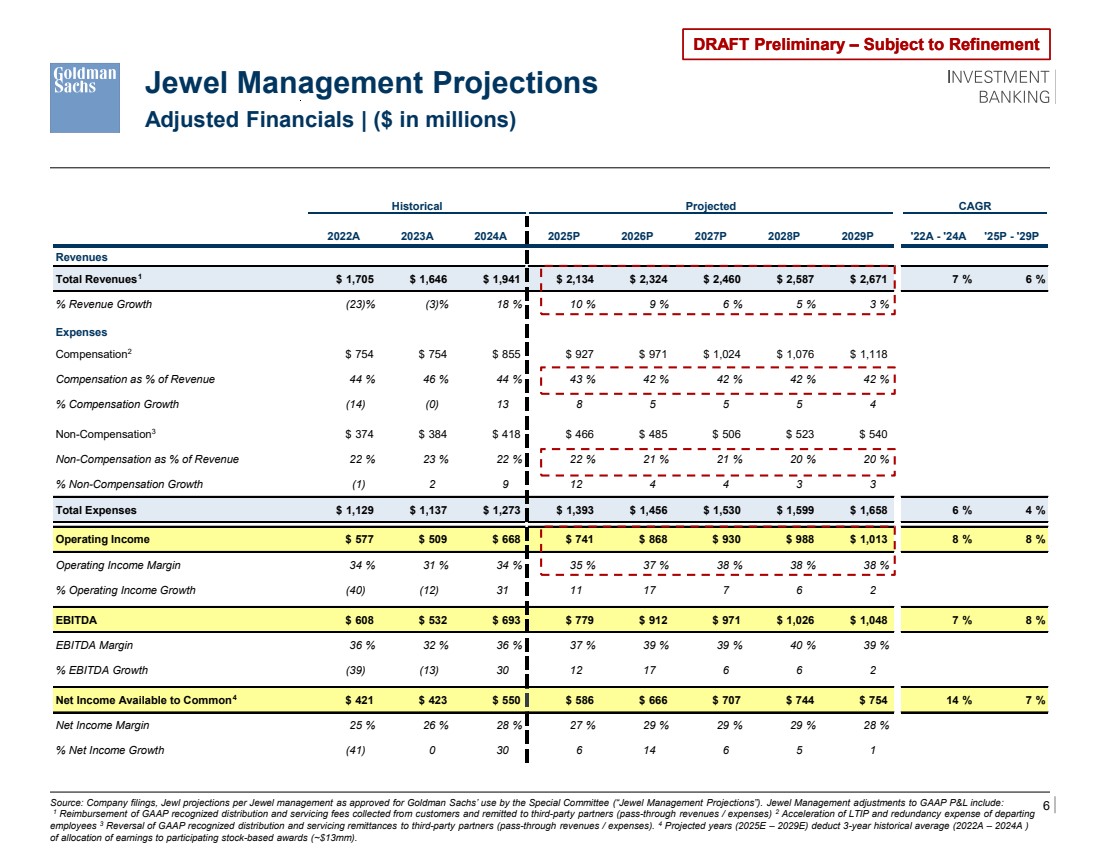
| 6 DRAFT Preliminary – Subject to Refinement Historical Projected CAGR 2022A 2023A 2024A 2025P 2026P 2027P 2028P 2029P '22A - '24A '25P - '29P Revenues Total Revenues $ 1,705 $ 1,646 $ 1,941 $ 2,134 $ 2,324 $ 2,460 $ 2,587 $ 2,671 7 % 6 % % Revenue Growth (23)% (3)% 18 % 10 % 9 % 6 % 5 % 3 % Expenses Compensation $ 754 $ 754 $ 855 $ 927 $ 971 $ 1,024 $ 1,076 $ 1,118 Compensation as % of Revenue 44 % 46 % 44 % 43 % 42 % 42 % 42 % 42 % % Compensation Growth (14) (0) 13 8 5 5 5 4 Non-Compensation $ 374 $ 384 $ 418 $ 466 $ 485 $ 506 $ 523 $ 540 Non-Compensation as % of Revenue 22 % 23 % 22 % 22 % 21 % 21 % 20 % 20 % % Non-Compensation Growth (1) 2 9 12 4 4 3 3 Total Expenses $ 1,129 $ 1,137 $ 1,273 $ 1,393 $ 1,456 $ 1,530 $ 1,599 $ 1,658 6 % 4 % Operating Income $ 577 $ 509 $ 668 $ 741 $ 868 $ 930 $ 988 $ 1,013 8 % 8 % Operating Income Margin 34 % 31 % 34 % 35 % 37 % 38 % 38 % 38 % % Operating Income Growth (40) (12) 31 11 17 7 6 2 EBITDA $ 608 $ 532 $ 693 $ 779 $ 912 $ 971 $ 1,026 $ 1,048 7 % 8 % EBITDA Margin 36 % 32 % 36 % 37 % 39 % 39 % 40 % 39 % % EBITDA Growth (39) (13) 30 12 17 6 6 2 Net Income Available to Common $ 421 $ 423 $ 550 $ 586 $ 666 $ 707 $ 744 $ 754 14 % 7 % Net Income Margin 25 % 26 % 28 % 27 % 29 % 29 % 29 % 28 % % Net Income Growth (41) 0 30 6 14 6 5 1 Jewel Management Projections Adjusted Financials | ($ in millions) Source: Company filings, Jewl projections per Jewel management as approved for Goldman Sachs’ use by the Special Committee (“Jewel Management Projections”). Jewel Management adjustments to GAAP P&L include: 1 Reimbursement of GAAP recognized distribution and servicing fees collected from customers and remitted to third-party partners (pass-through revenues / expenses) 2 Acceleration of LTIP and redundancy expense of departing employees 3 Reversal of GAAP recognized distribution and servicing remittances to third-party partners (pass-through revenues / expenses). 4 Projected years (2025E – 2029E) deduct 3-year historical average (2022A – 2024A ) of allocation of earnings to participating stock-based awards (~$13mm). 1 2 3 4 |
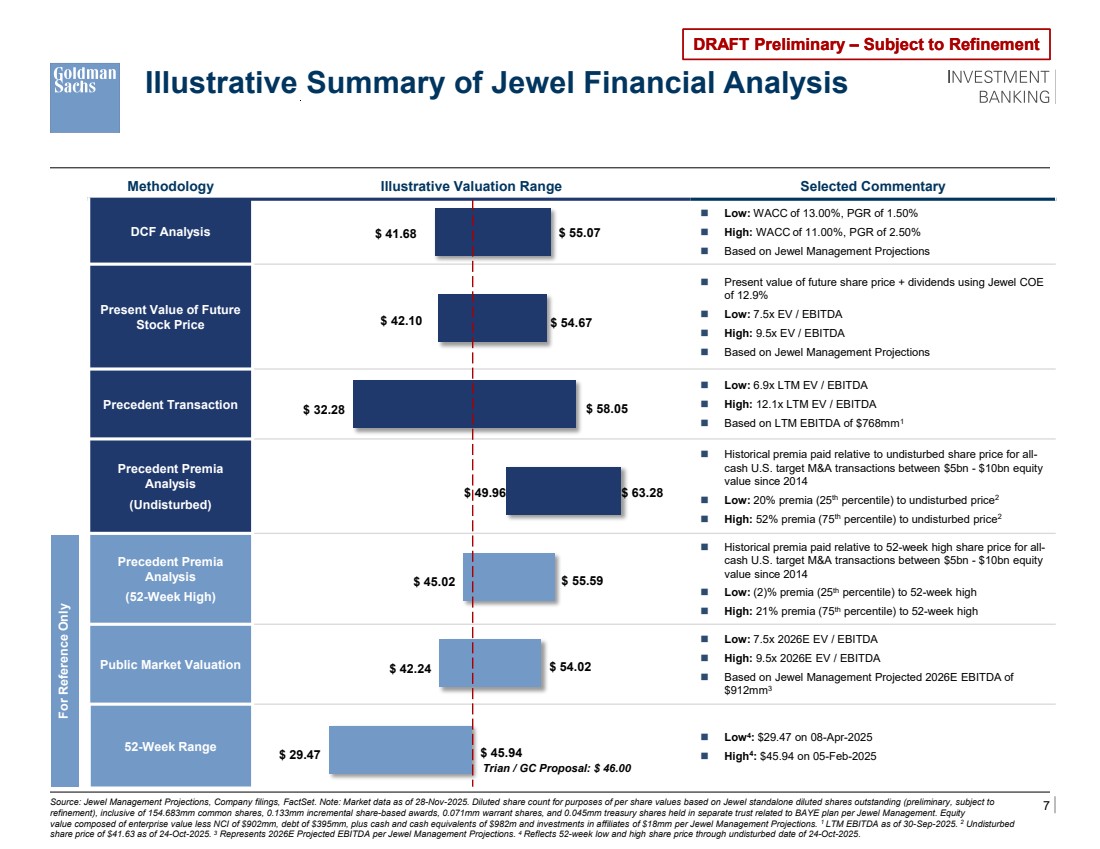
| 7 DRAFT Preliminary – Subject to Refinement $ 29.47 $ 42.24 $ 45.02 $ 49.96 $ 32.28 $ 42.10 $ 41.68 $ 45.94 $ 54.02 $ 55.59 $ 63.28 $ 58.05 $ 54.67 $ 55.07 Methodology Illustrative Valuation Range Selected Commentary DCF Analysis ◼ Low: WACC of 13.00%, PGR of 1.50% ◼ High: WACC of 11.00%, PGR of 2.50% ◼ Based on Jewel Management Projections Present Value of Future Stock Price ◼ Present value of future share price + dividends using Jewel COE of 12.9% ◼ Low: 7.5x EV / EBITDA ◼ High: 9.5x EV / EBITDA ◼ Based on Jewel Management Projections Precedent Transaction ◼ Low: 6.9x LTM EV / EBITDA ◼ High: 12.1x LTM EV / EBITDA ◼ Based on LTM EBITDA of $768mm1 Precedent Premia Analysis (Undisturbed) ◼ Historical premia paid relative to undisturbed share price for all-cash U.S. target M&A transactions between $5bn - $10bn equity value since 2014 ◼ Low: 20% premia (25th percentile) to undisturbed price2 ◼ High: 52% premia (75th percentile) to undisturbed price2 Precedent Premia Analysis (52-Week High) ◼ Historical premia paid relative to 52-week high share price for all-cash U.S. target M&A transactions between $5bn - $10bn equity value since 2014 ◼ Low: (2)% premia (25th percentile) to 52-week high ◼ High: 21% premia (75th percentile) to 52-week high Public Market Valuation ◼ Low: 7.5x 2026E EV / EBITDA ◼ High: 9.5x 2026E EV / EBITDA ◼ Based on Jewel Management Projected 2026E EBITDA of $912mm3 52-Week Range ◼ Low4 : $29.47 on 08-Apr-2025 ◼ High4 : $45.94 on 05-Feb-2025 For Reference Only Illustrative Summary of Jewel Financial Analysis Trian / GC Proposal: $ 46.00 Source: Jewel Management Projections, Company filings, FactSet. Note: Market data as of 28-Nov-2025. Diluted share count for purposes of per share values based on Jewel standalone diluted shares outstanding (preliminary, subject to refinement), inclusive of 154.683mm common shares, 0.133mm incremental share-based awards, 0.071mm warrant shares, and 0.045mm treasury shares held in separate trust related to BAYE plan per Jewel Management. Equity value composed of enterprise value less NCI of $902mm, debt of $395mm, plus cash and cash equivalents of $982m and investments in affiliates of $18mm per Jewel Management Projections. 1 LTM EBITDA as of 30-Sep-2025. 2 Undisturbed share price of $41.63 as of 24-Oct-2025. 3 Represents 2026E Projected EBITDA per Jewel Management Projections. 4 Reflects 52-week low and high share price through undisturbed date of 24-Oct-2025. |
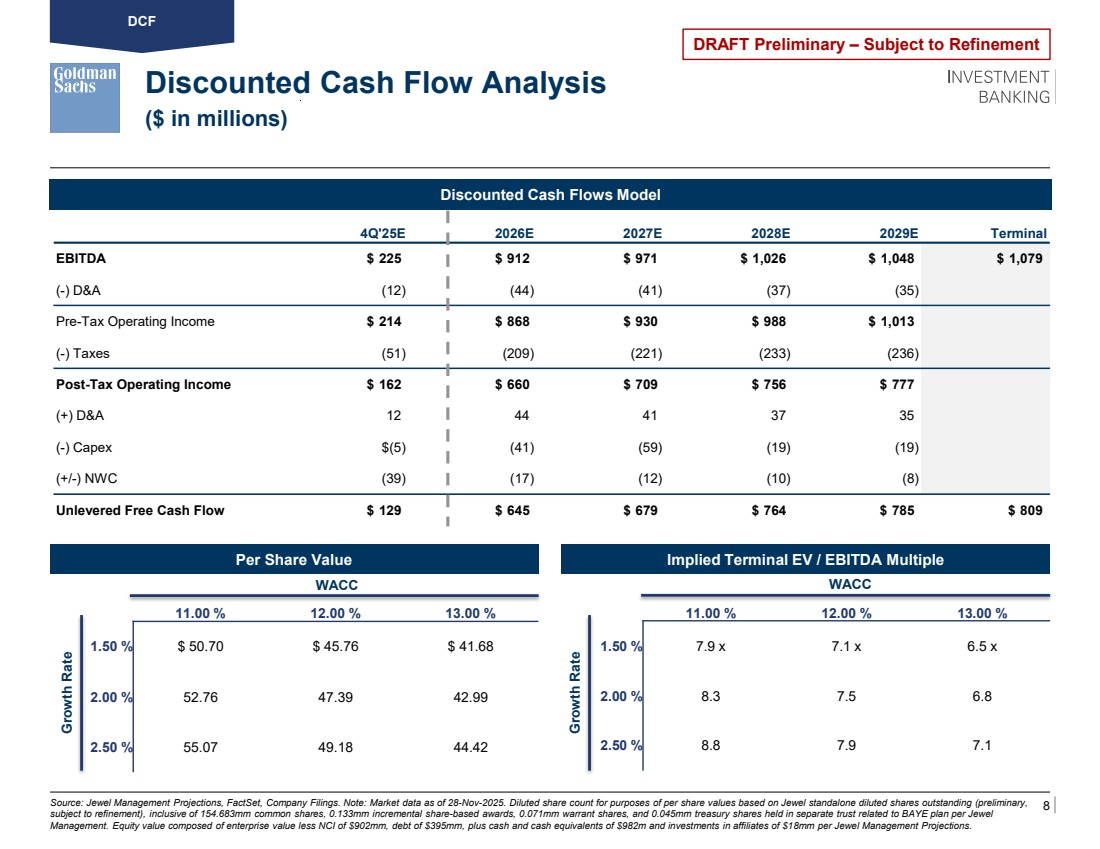
| 8 DRAFT Preliminary – Subject to Refinement 4Q'25E 2026E 2027E 2028E 2029E Terminal EBITDA $ 225 $ 912 $ 971 $ 1,026 $ 1,048 $ 1,079 (-) D&A (12) (44) (41) (37) (35) Pre-Tax Operating Income $ 214 $ 868 $ 930 $ 988 $ 1,013 (-) Taxes (51) (209) (221) (233) (236) Post-Tax Operating Income $ 162 $ 660 $ 709 $ 756 $ 777 (+) D&A 12 44 41 37 35 (-) Capex $(5) (41) (59) (19) (19) (+/-) NWC (39) (17) (12) (10) (8) Unlevered Free Cash Flow $ 129 $ 645 $ 679 $ 764 $ 785 $ 809 $ 7 11.00 % 12.00 % 13.00 % 1.50 % 7.9 x 7.1 x 6.5 x 2.00 % 8.3 7.5 6.8 2.50 % 8.8 7.9 7.1 $ 47 11.00 % 12.00 % 13.00 % 1.50 % $ 50.70 $ 45.76 $ 41.68 2.00 % 52.76 47.39 42.99 2.50 % 55.07 49.18 44.42 Discounted Cash Flow Analysis ($ in millions) Alternative Asset Management Market Update Source: Jewel Management Projections, FactSet, Company Filings. Note: Market data as of 28-Nov-2025. Diluted share count for purposes of per share values based on Jewel standalone diluted shares outstanding (preliminary, subject to refinement), inclusive of 154.683mm common shares, 0.133mm incremental share-based awards, 0.071mm warrant shares, and 0.045mm treasury shares held in separate trust related to BAYE plan per Jewel Management. Equity value composed of enterprise value less NCI of $902mm, debt of $395mm, plus cash and cash equivalents of $982m and investments in affiliates of $18mm per Jewel Management Projections. Per Share Value Discounted Cash Flows Model Implied Terminal EV / EBITDA Multiple WACC WACC Growth Rate Growth Rate DCF |
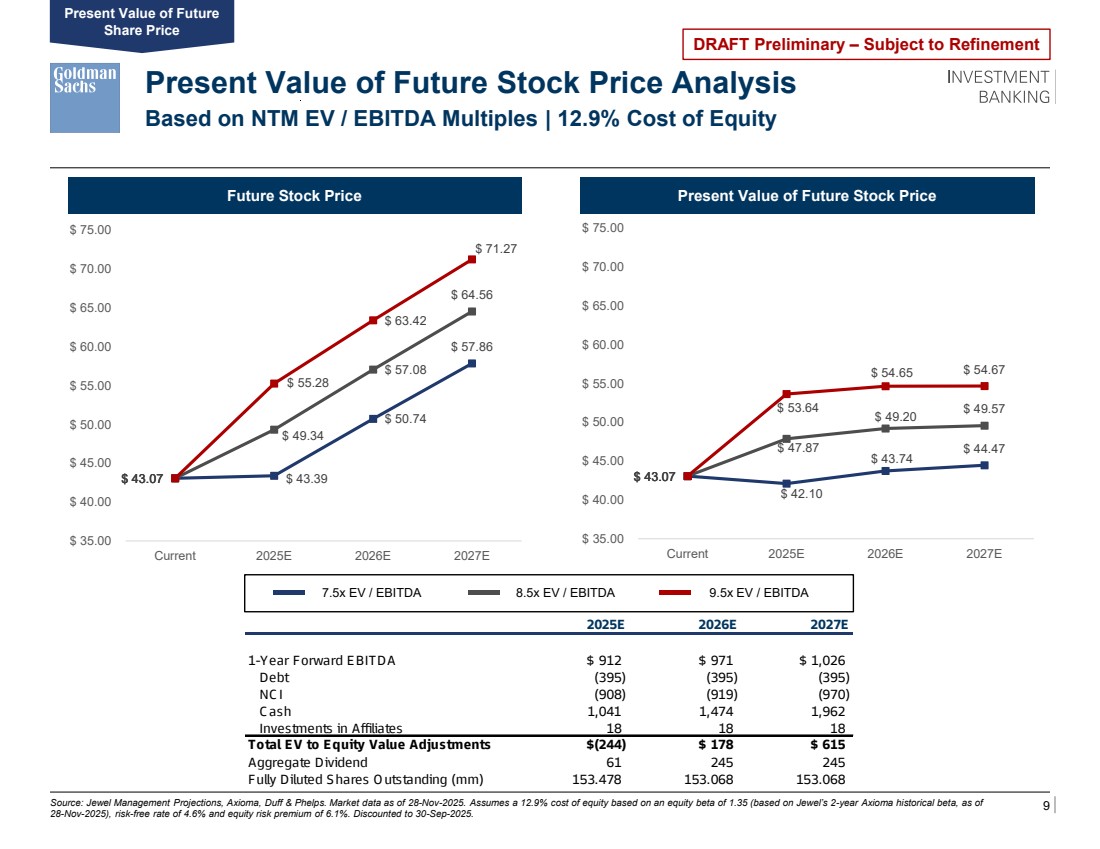
| 9 DRAFT Preliminary – Subject to Refinement 7.5x EV / EBITDA Present Value of Future Stock Price Analysis Source: Jewel Management Projections, Axioma, Duff & Phelps. Market data as of 28-Nov-2025. Assumes a 12.9% cost of equity based on an equity beta of 1.35 (based on Jewel’s 2-year Axioma historical beta, as of 28-Nov-2025), risk-free rate of 4.6% and equity risk premium of 6.1%. Discounted to 30-Sep-2025. Future Stock Price Based on NTM EV / EBITDA Multiples | 12.9% Cost of Equity Present Value of Future Stock Price 8.5x EV / EBITDA 9.5x EV / EBITDA Present Value of Future Share Price 2025E 2026E 2027E 1-Year Forward EBITDA $ 912 $ 971 $ 1,026 Debt (395) (395) (395) NC I (908) (919) (970) C ash 1,041 1,474 1,962 Investments in Affiliates 18 18 18 Total EV to Equity Value Adjustments $(244) $ 178 $ 615 Aggregate Dividend 61 245 245 Fully Diluted Shares Outstanding (mm) 153.478 153.068 153.068 $ 43.07 $ 43.39 $ 50.74 $ 57.86 $ 49.34 $ 57.08 $ 64.56 $ 55.28 $ 63.42 $ 71.27 $ 35.00 $ 40.00 $ 45.00 $ 50.00 $ 55.00 $ 60.00 $ 65.00 $ 70.00 $ 75.00 Current 2025E 2026E 2027E $ 43.07 $ 42.10 $ 43.74 $ 47.87 $ 44.47 $ 49.20 $ 53.64 $ 49.57 $ 54.65 $ 54.67 $ 35.00 $ 40.00 $ 45.00 $ 50.00 $ 55.00 $ 60.00 $ 65.00 $ 70.00 $ 75.00 Current 2025E 2026E 2027E |
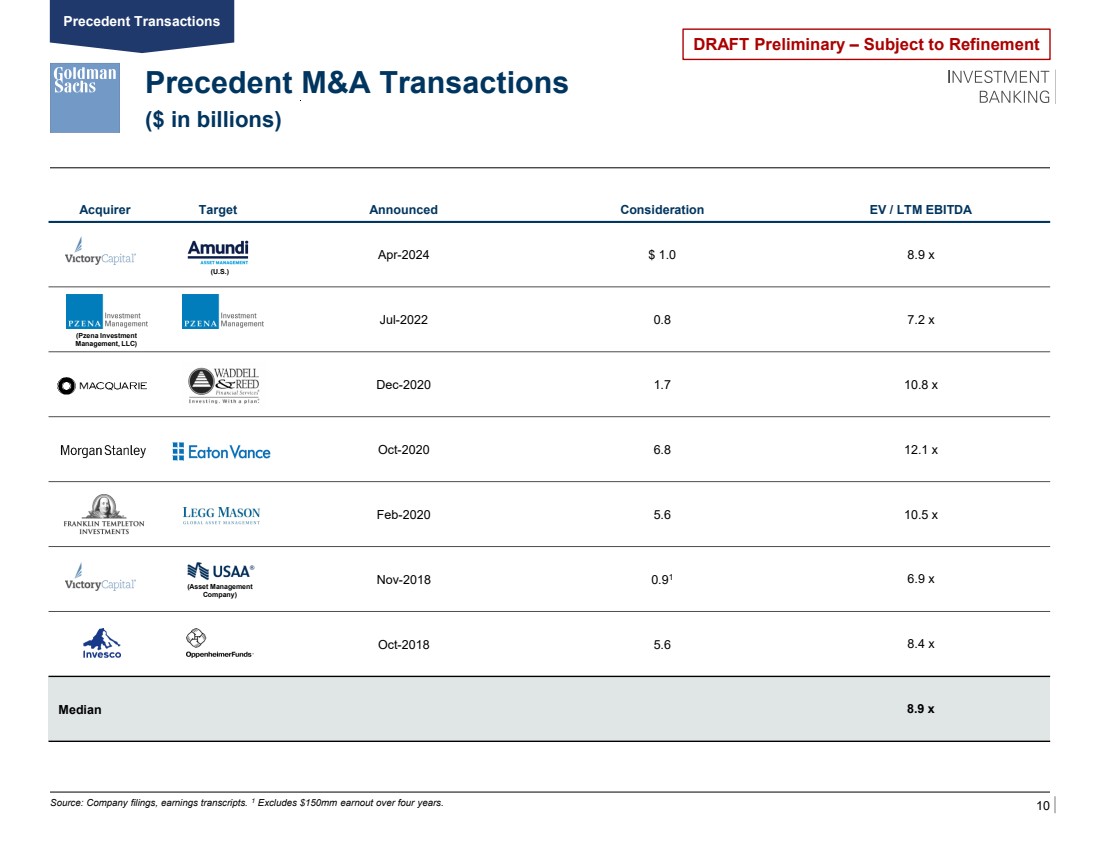
| 10 DRAFT Preliminary – Subject to Refinement Acquirer Target Announced Consideration EV / LTM EBITDA Apr-2024 $ 1.0 8.9 x Jul-2022 0.8 7.2 x Dec-2020 1.7 10.8 x Oct-2020 6.8 12.1 x Feb-2020 5.6 10.5 x Nov-2018 0.91 6.9 x Oct-2018 5.6 8.4 x Median 8.9 x Precedent M&A Transactions Source: Company filings, earnings transcripts. 1 Excludes $150mm earnout over four years. ($ in billions) (Asset Management Company) Precedent Transactions (Pzena Investment Management, LLC) (U.S.) |
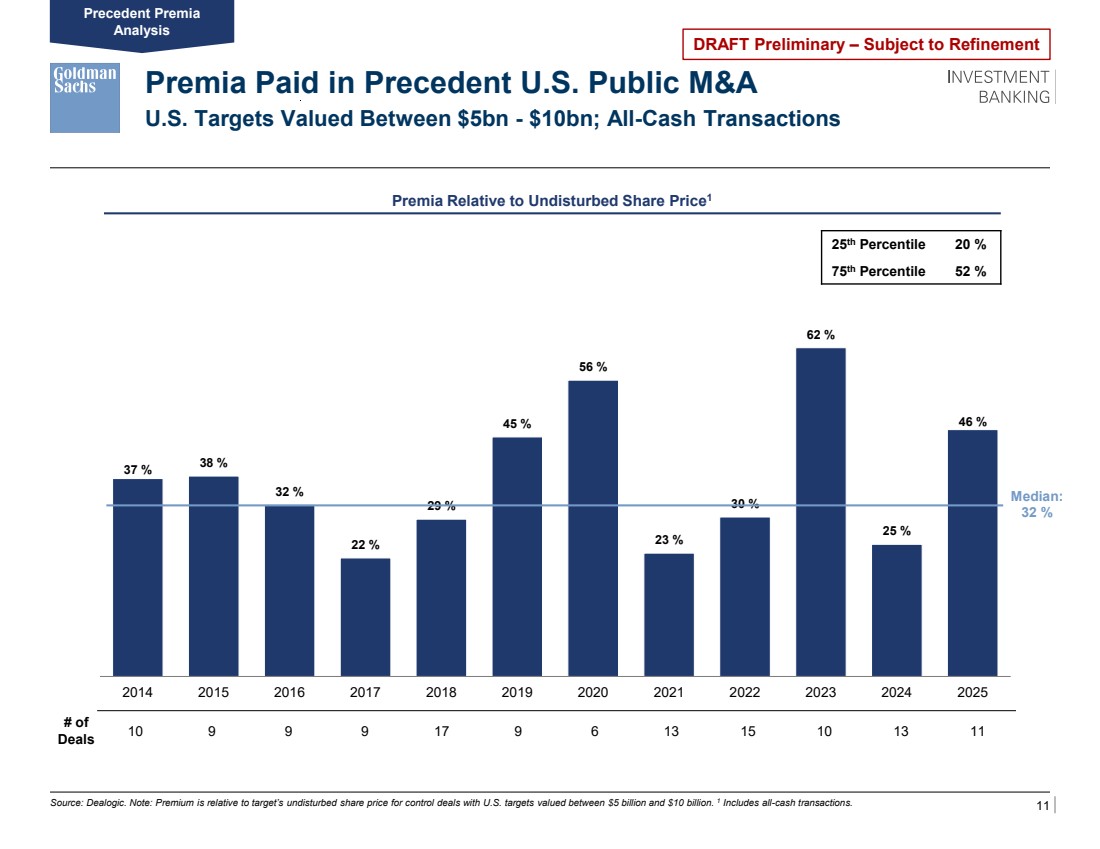
| 11 DRAFT Preliminary – Subject to Refinement 37 % 38 % 32 % 22 % 29 % 45 % 56 % 23 % 30 % 62 % 25 % 46 % 2014 2015 2016 2017 2018 2019 2020 2021 2022 2023 2024 2025 Premia Paid in Precedent U.S. Public M&A U.S. Targets Valued Between $5bn - $10bn; All-Cash Transactions Source: Dealogic. Note: Premium is relative to target’s undisturbed share price for control deals with U.S. targets valued between $5 billion and $10 billion. 1 Includes all-cash transactions. 10 9 9 9 17 9 6 13 15 10 13 11 Premia Relative to Undisturbed Share Price1 # of Deals 25th Percentile 20 % 75th Percentile 52 % Median: 32 % Precedent Premia Analysis |
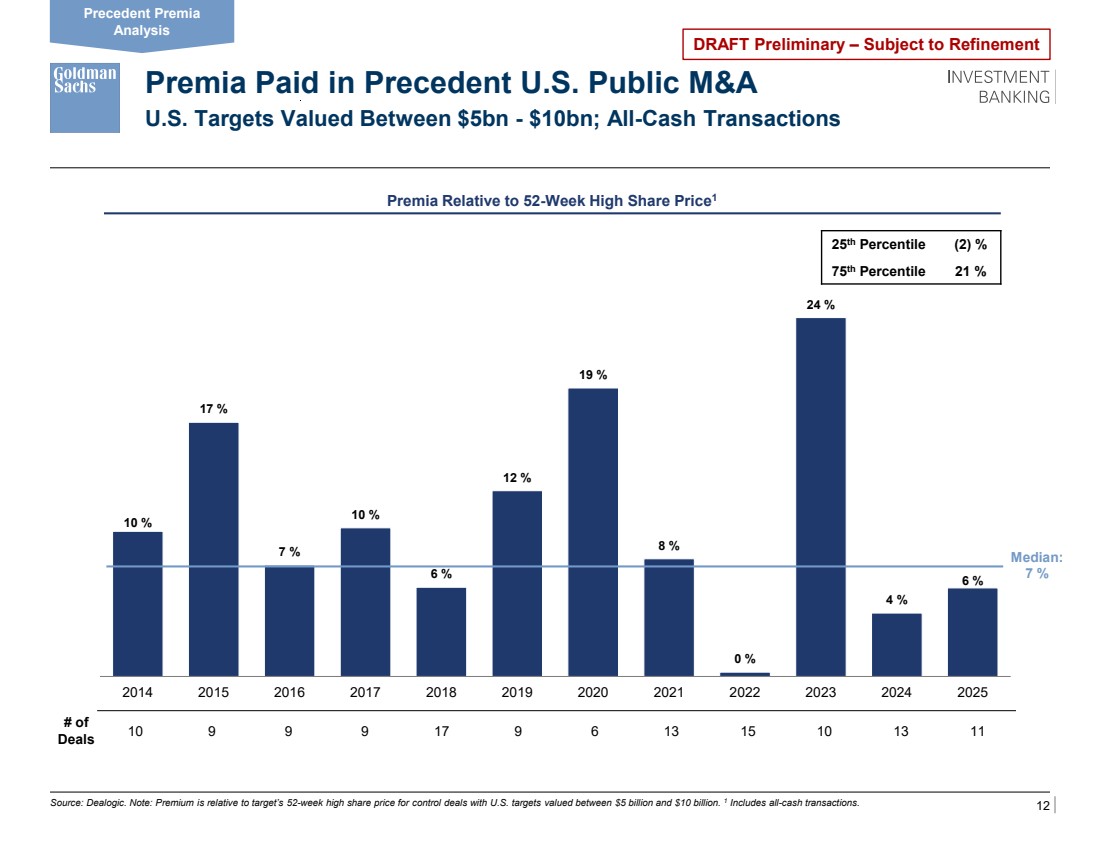
| 12 DRAFT Preliminary – Subject to Refinement 10 % 17 % 7 % 10 % 6 % 12 % 19 % 8 % 0 % 24 % 4 % 6 % 2014 2015 2016 2017 2018 2019 2020 2021 2022 2023 2024 2025 Premia Paid in Precedent U.S. Public M&A U.S. Targets Valued Between $5bn - $10bn; All-Cash Transactions Source: Dealogic. Note: Premium is relative to target’s 52-week high share price for control deals with U.S. targets valued between $5 billion and $10 billion. 1 Includes all-cash transactions. 10 9 9 9 17 9 6 13 15 10 13 11 Premia Relative to 52-Week High Share Price1 # of Deals 25th Percentile (2) % 75th Percentile 21 % Median: 7 % Precedent Premia Analysis |
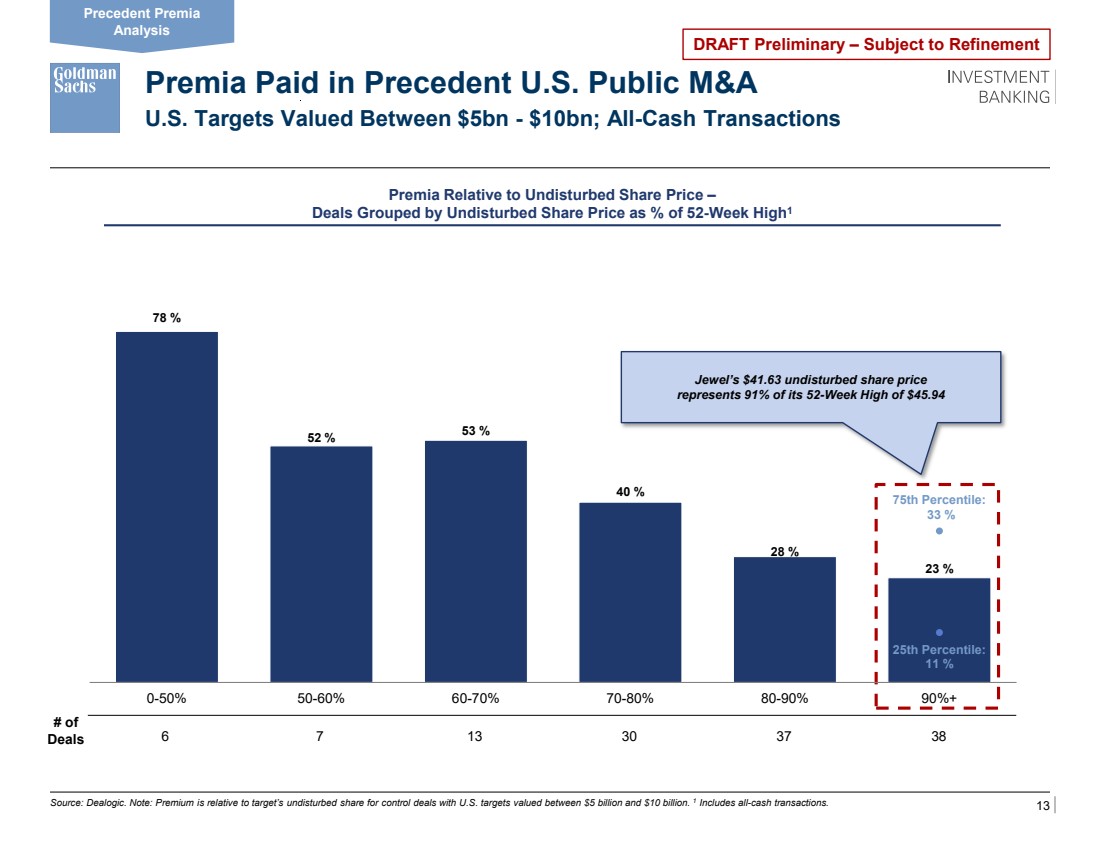
| 13 DRAFT Preliminary – Subject to Refinement Premia Paid in Precedent U.S. Public M&A U.S. Targets Valued Between $5bn - $10bn; All-Cash Transactions Source: Dealogic. Note: Premium is relative to target’s undisturbed share for control deals with U.S. targets valued between $5 billion and $10 billion. 1 Includes all-cash transactions. 6 7 13 30 37 38 Premia Relative to Undisturbed Share Price – Deals Grouped by Undisturbed Share Price as % of 52-Week High1 # of Deals Precedent Premia Analysis Jewel’s $41.63 undisturbed share price represents 91% of its 52-Week High of $45.94 78 % 52 % 53 % 40 % 28 % 23 % 25th Percentile: 11 % 75th Percentile: 33 % 0-50% 50-60% 60-70% 70-80% 80-90% 90%+ |
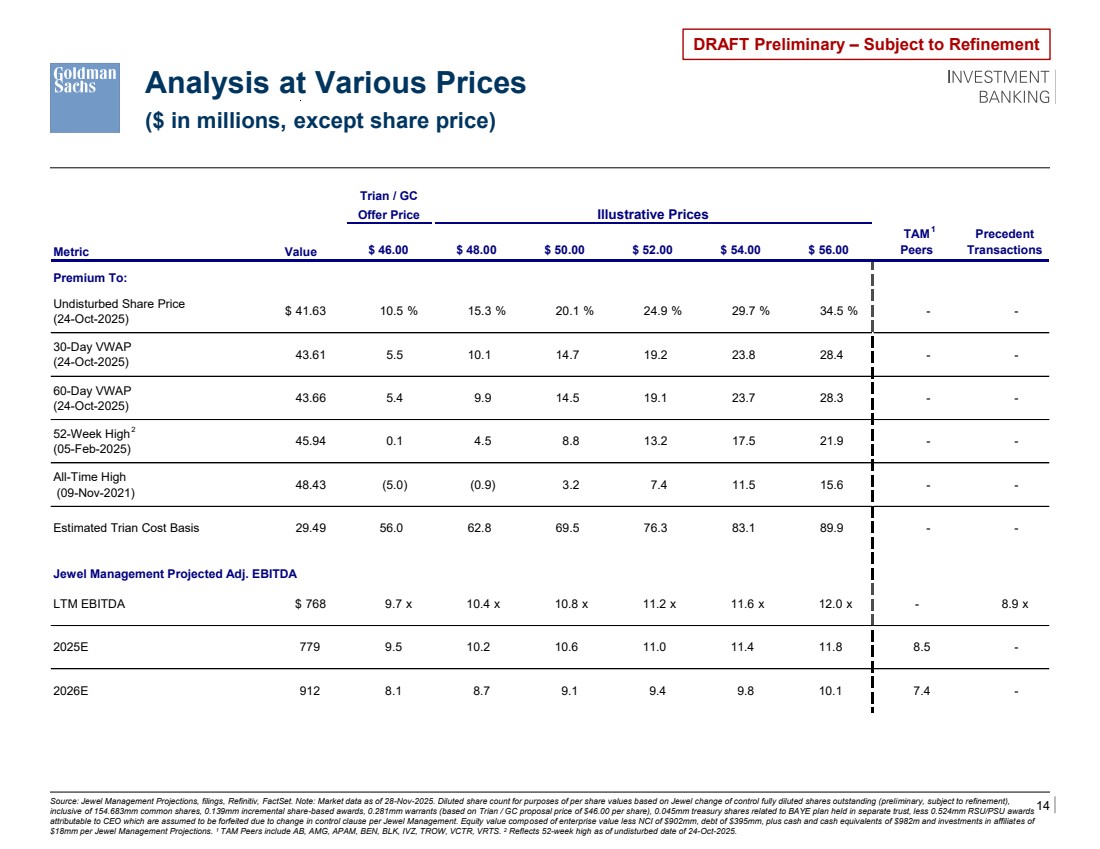
| 14 DRAFT Preliminary – Subject to Refinement Analysis at Various Prices Source: Jewel Management Projections, filings, Refinitiv, FactSet. Note: Market data as of 28-Nov-2025. Diluted share count for purposes of per share values based on Jewel change of control fully diluted shares outstanding (preliminary, subject to refinement), inclusive of 154.683mm common shares, 0.139mm incremental share-based awards, 0.281mm warrants (based on Trian / GC proposal price of $46.00 per share), 0.045mm treasury shares related to BAYE plan held in separate trust, less 0.524mm RSU/PSU awards attributable to CEO which are assumed to be forfeited due to change in control clause per Jewel Management. Equity value composed of enterprise value less NCI of $902mm, debt of $395mm, plus cash and cash equivalents of $982m and investments in affiliates of $18mm per Jewel Management Projections. 1 TAM Peers include AB, AMG, APAM, BEN, BLK, IVZ, TROW, VCTR, VRTS. 2 Reflects 52-week high as of undisturbed date of 24-Oct-2025. 1 ($ in millions, except share price) 2 Trian / GC Offer Price Illustrative Prices Metric Value $ 46.00 $ 48.00 $ 50.00 $ 52.00 $ 54.00 $ 56.00 TAM Peers Precedent Transactions Premium To: Undisturbed Share Price (24-Oct-2025) $ 41.63 10.5 % 15.3 % 20.1 % 24.9 % 29.7 % 34.5 % - - 30-Day VWAP (24-Oct-2025) 43.61 5.5 10.1 14.7 19.2 23.8 28.4 - - 60-Day VWAP (24-Oct-2025) 43.66 5.4 9.9 14.5 19.1 23.7 28.3 - - 52-Week High (05-Feb-2025) 45.94 0.1 4.5 8.8 13.2 17.5 21.9 - - All-Time High (09-Nov-2021) 48.43 (5.0) (0.9) 3.2 7.4 11.5 15.6 - - Estimated Trian Cost Basis 29.49 56.0 62.8 69.5 76.3 83.1 89.9 - - Jewel Management Projected Adj. EBITDA LTM EBITDA $ 768 9.7 x 10.4 x 10.8 x 11.2 x 11.6 x 12.0 x - 8.9 x 2025E 779 9.5 10.2 10.6 11.0 11.4 11.8 8.5 - 2026E 912 8.1 8.7 9.1 9.4 9.8 10.1 7.4 - |
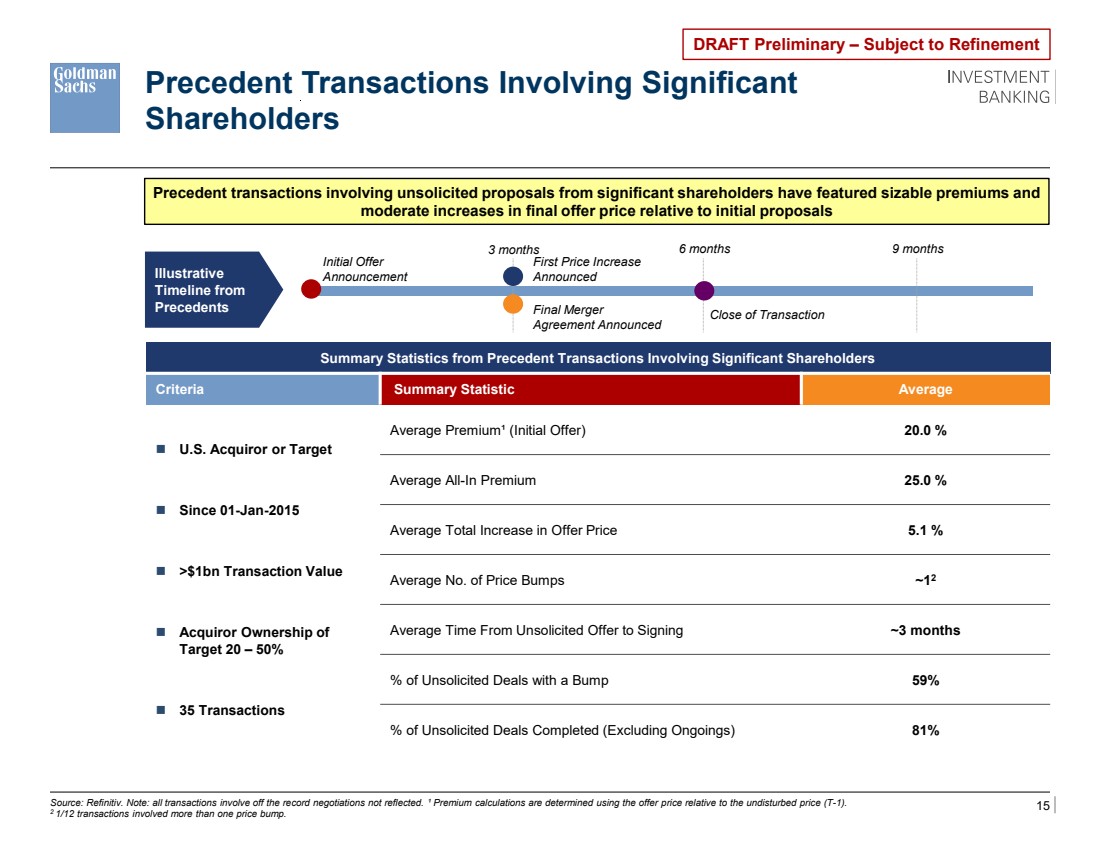
| 15 DRAFT Preliminary – Subject to Refinement Source: Refinitiv. Note: all transactions involve off the record negotiations not reflected. ¹ Premium calculations are determined using the offer price relative to the undisturbed price (T-1). 2 1/12 transactions involved more than one price bump. Summary Statistics from Precedent Transactions Involving Significant Shareholders Criteria Summary Statistic Average ◼ U.S. Acquiror or Target ◼ Since 01-Jan-2015 ◼ >$1bn Transaction Value ◼ Acquiror Ownership of Target 20 – 50% ◼ 35 Transactions Average Premium¹ (Initial Offer) 20.0 % Average All-In Premium 25.0 % Average Total Increase in Offer Price 5.1 % Average No. of Price Bumps ~12 Average Time From Unsolicited Offer to Signing ~3 months % of Unsolicited Deals with a Bump 59% % of Unsolicited Deals Completed (Excluding Ongoings) 81% Illustrative Timeline from Precedents 3 months 6 months 9 months Close of Transaction Final Merger Agreement Announced First Price Increase Announced Initial Offer Announcement Precedent Transactions Involving Significant Shareholders Precedent transactions involving unsolicited proposals from significant shareholders have featured sizable premiums and moderate increases in final offer price relative to initial proposals |
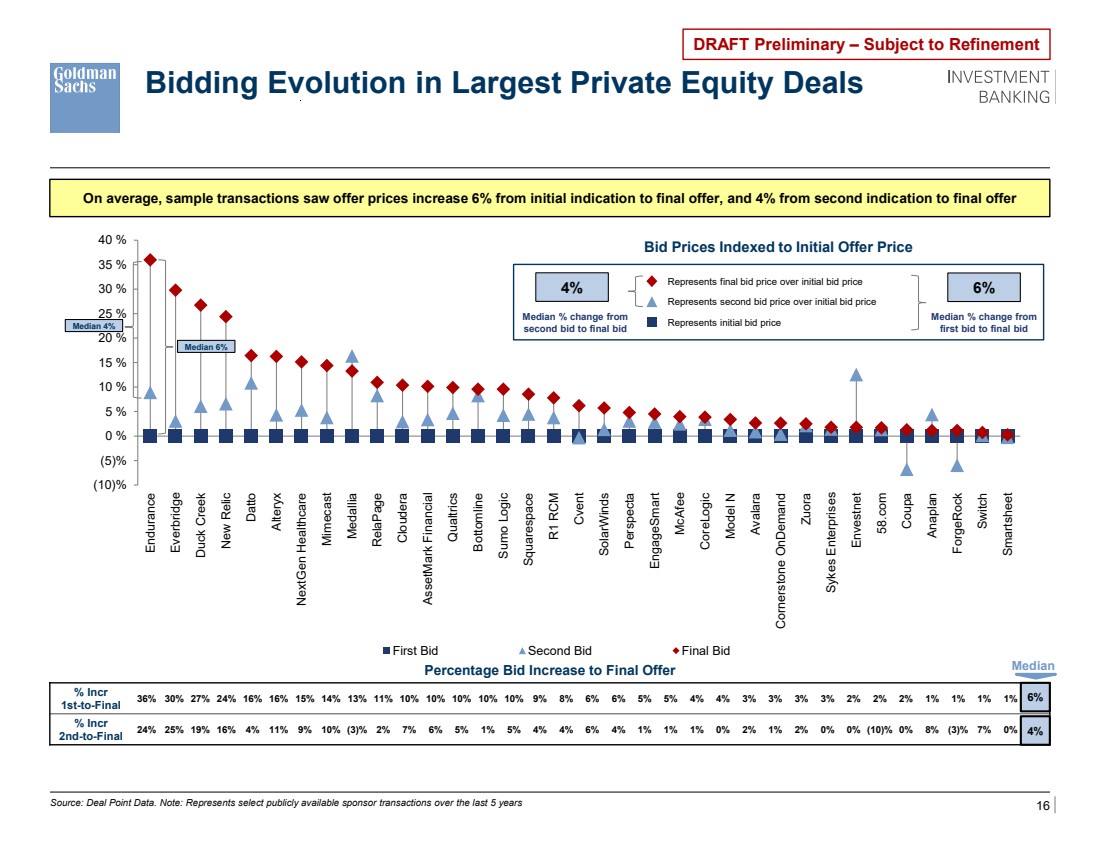
| 16 DRAFT Preliminary – Subject to Refinement Bidding Evolution in Largest Private Equity Deals Source: Deal Point Data. Note: Represents select publicly available sponsor transactions over the last 5 years On average, sample transactions saw offer prices increase 6% from initial indication to final offer, and 4% from second indication to final offer % Incr 1st-to-Final 36% 30% 27% 24% 16% 16% 15% 14% 13% 11% 10% 10% 10% 10% 10% 9% 8% 6% 6% 5% 5% 4% 4% 3% 3% 3% 3% 2% 2% 2% 1% 1% 1% 1% 0% % Incr 2nd-to-Final 24% 25% 19% 16% 4% 11% 9% 10% (3)% 2% 7% 6% 5% 1% 5% 4% 4% 6% 4% 1% 1% 1% 0% 2% 1% 2% 0% 0% (10)% 0% 8% (3)% 7% 0% 0% Median Percentage Bid Increase to Final Offer 4% 6% (10)% (5)% 0 % 5 % 10 % 15 % 20 % 25 % 30 % 35 % 40 % Endurance Everbridge Duck Creek New Relic Datto Alteryx NextGen Healthcare Mimecast Medallia RelaPage Cloudera AssetMark Financial Qualtrics Bottomline Sumo Logic Squarespace R1 RCM Cvent SolarWinds Perspecta EngageSmart McAfee CoreLogic Model N Avalara Cornerstone OnDemand Zuora Sykes Enterprises Envestnet 58.com Coupa Anaplan ForgeRock Switch Smartsheet First Bid Second Bid Final Bid Bid Prices Indexed to Initial Offer Price Represents final bid price over initial bid price Represents second bid price over initial bid price Represents initial bid price Median % change from second bid to final bid 4% Median 4% Median 6% Median % change from first bid to final bid 6% |
| DRAFT Preliminary – Subject to Refinement Appendix A: Valuation Support |
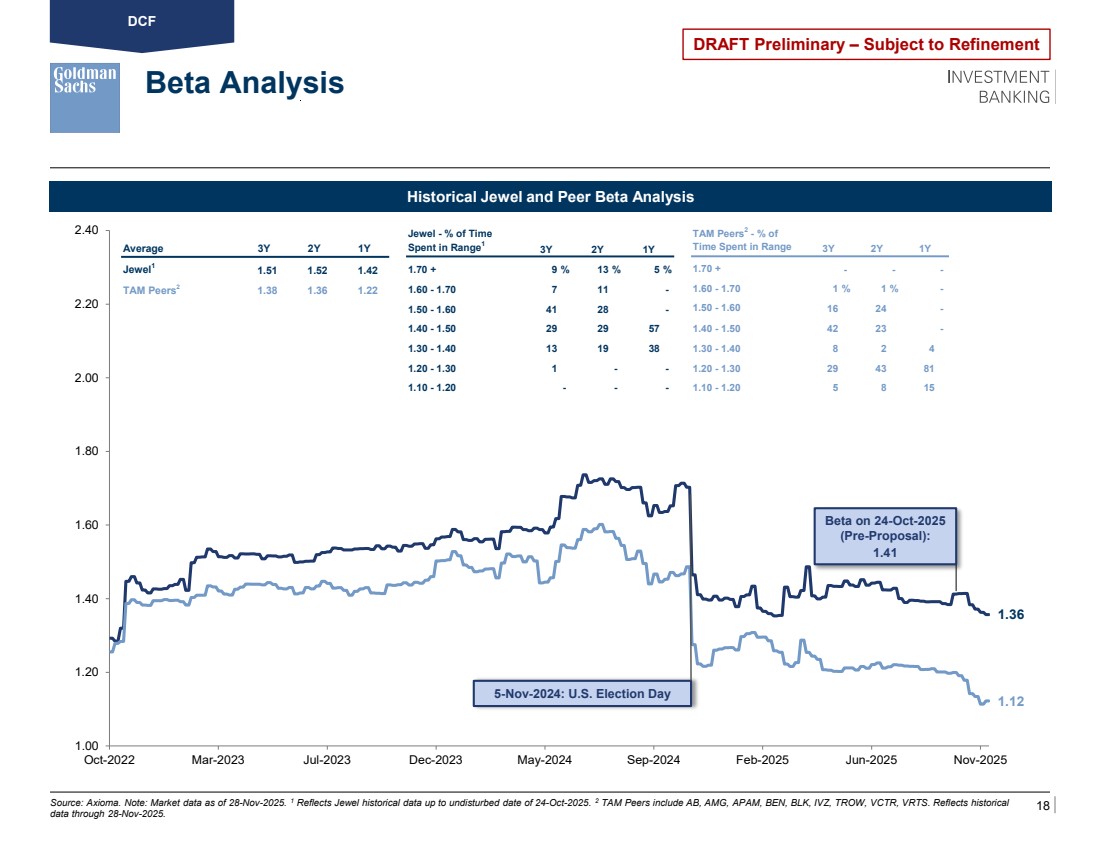
| 18 DRAFT Preliminary – Subject to Refinement 1.36 1.12 1.00 1.20 1.40 1.60 1.80 2.00 2.20 2.40 Oct-2022 Mar-2023 Jul-2023 Dec-2023 May-2024 Sep-2024 Feb-2025 Jun-2025 Nov-2025 Beta Analysis Source: Axioma. Note: Market data as of 28-Nov-2025. 1 Reflects Jewel historical data up to undisturbed date of 24-Oct-2025. 2 TAM Peers include AB, AMG, APAM, BEN, BLK, IVZ, TROW, VCTR, VRTS. Reflects historical data through 28-Nov-2025. Beta on 24-Oct-2025 (Pre-Proposal): 1.41 5-Nov-2024: U.S. Election Day Historical Jewel and Peer Beta Analysis DCF Jewel - % of Time Spent in Range1 3Y 2Y 1Y 1.70 + 9 % 13 % 5 % 1.60 - 1.70 7 11 - 1.50 - 1.60 41 28 - 1.40 - 1.50 29 29 57 1.30 - 1.40 13 19 38 1.20 - 1.30 1 - - 1.10 - 1.20 - - - Average 3Y 2Y 1Y Jewel1 1.51 1.52 1.42 TAM Peers2 1.38 1.36 1.22 TAM Peers2 - % of Time Spent in Range 3Y 2Y 1Y 1.70 + - - - 1.60 - 1.70 1 % 1 % - 1.50 - 1.60 16 24 - 1.40 - 1.50 42 23 - 1.30 - 1.40 8 2 4 1.20 - 1.30 29 43 81 1.10 - 1.20 5 8 15 |
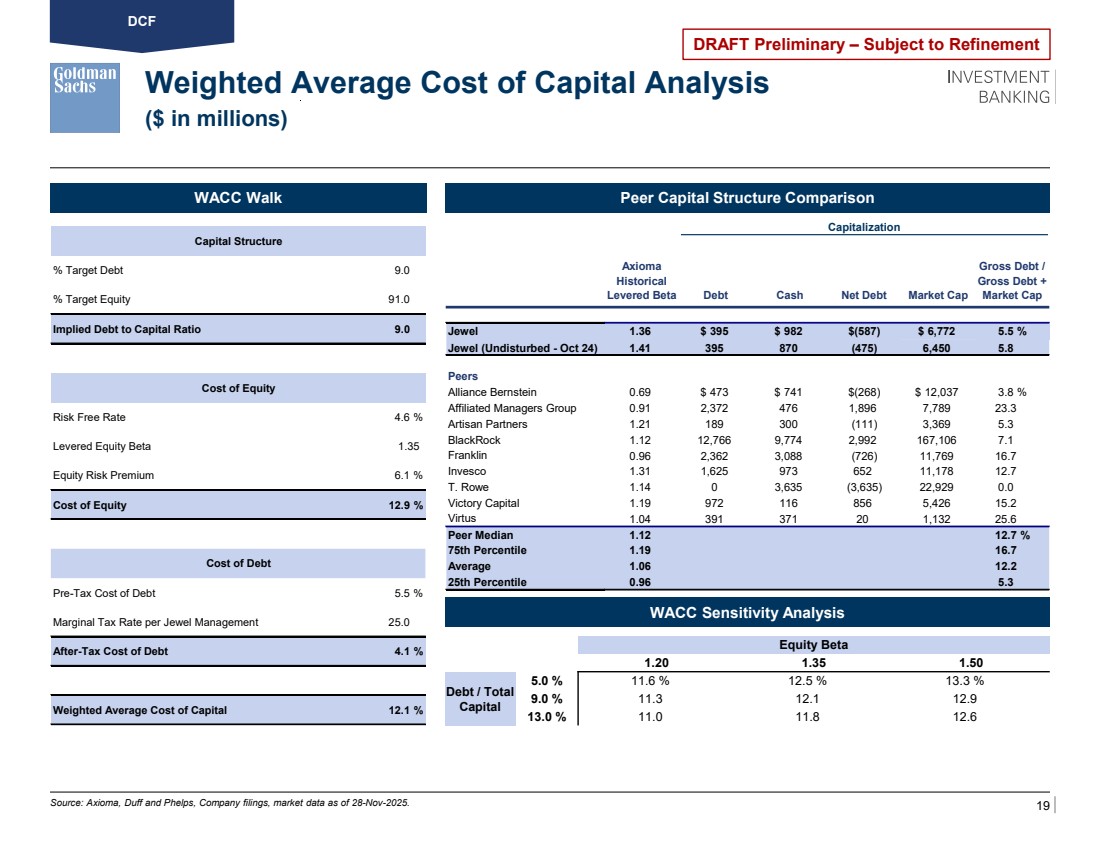
| 19 DRAFT Preliminary – Subject to Refinement Axioma Historical Levered Beta Debt Cash Net Debt Market Cap Gross Debt / Gross Debt + Market Cap Jewel 1.36 $ 395 $ 982 $(587) $ 6,772 5.5 % Jewel (Undisturbed - Oct 24) 1.41 395 870 (475) 6,450 5.8 Peers Alliance Bernstein 0.69 $ 473 $ 741 $(268) $ 12,037 3.8 % Affiliated Managers Group 0.91 2,372 476 1,896 7,789 23.3 Artisan Partners 1.21 189 300 (111) 3,369 5.3 BlackRock 1.12 12,766 9,774 2,992 167,106 7.1 Franklin 0.96 2,362 3,088 (726) 11,769 16.7 Invesco 1.31 1,625 973 652 11,178 12.7 T. Rowe 1.14 0 3,635 (3,635) 22,929 0.0 Victory Capital 1.19 972 116 856 5,426 15.2 Virtus 1.04 391 371 20 1,132 25.6 Peer Median 1.12 12.7 % 75th Percentile 1.19 16.7 Average 1.06 12.2 25th Percentile 0.96 5.3 Capitalization Weighted Average Cost of Capital Analysis ($ in millions) Source: Axioma, Duff and Phelps, Company filings, market data as of 28-Nov-2025. WACC Walk WACC Sensitivity Analysis Peer Capital Structure Comparison DCF Equity Beta 1.20 1.35 1.50 Debt / Total Capital 5.0 % 11.6 % 12.5 % 13.3 % 9.0 % 11.3 12.1 12.9 13.0 % 11.0 11.8 12.6 Capital Structure % Target Debt 9.0 % Target Equity 91.0 Implied Debt to Capital Ratio 9.0 Cost of Equity Risk Free Rate 4.6 % Levered Equity Beta 1.35 Equity Risk Premium 6.1 % Cost of Equity 12.9 % Cost of Debt Pre-Tax Cost of Debt 5.5 % Marginal Tax Rate per Jewel Management 25.0 After-Tax Cost of Debt 4.1 % Weighted Average Cost of Capital 12.1 % |
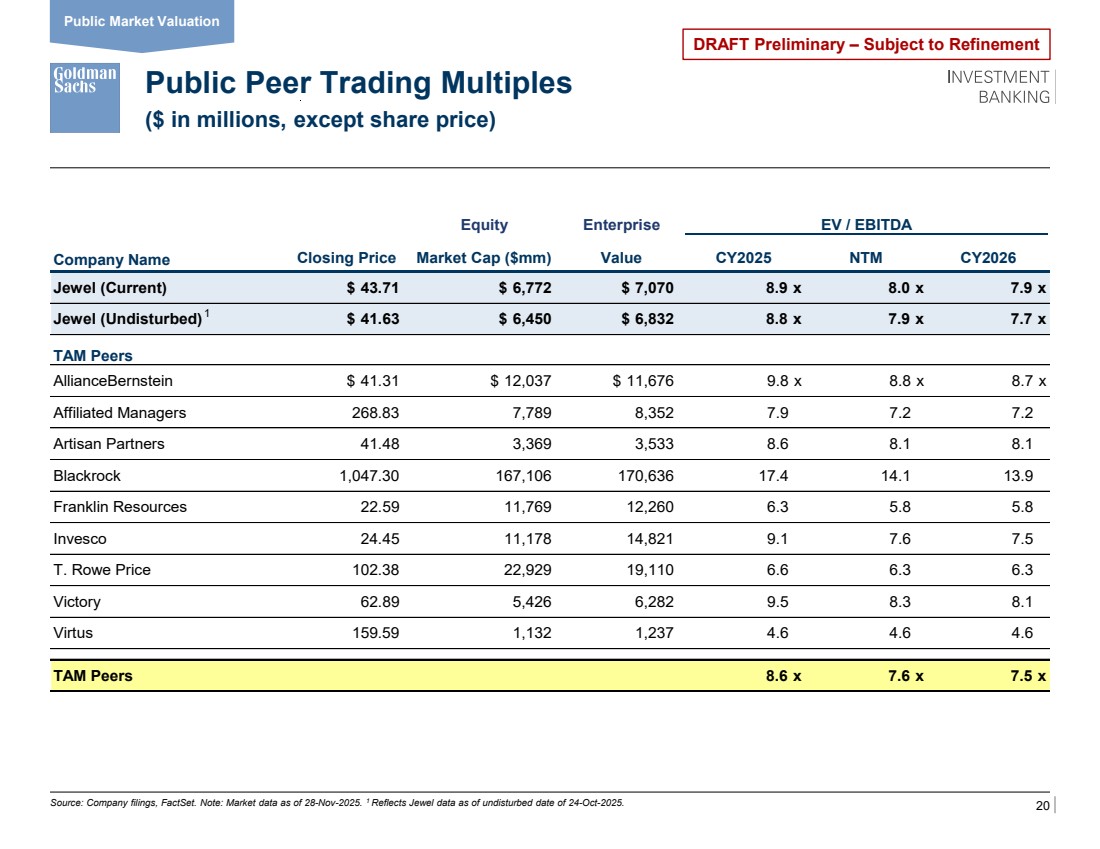
| 20 DRAFT Preliminary – Subject to Refinement Equity Enterprise EV / EBITDA Company Name Closing Price Market Cap ($mm) Value CY2025 NTM CY2026 Jewel (Current) $ 43.71 $ 6,772 $ 7,070 8.9 x 8.0 x 7.9 x Jewel (Undisturbed) $ 41.63 $ 6,450 $ 6,832 8.8 x 7.9 x 7.7 x TAM Peers AllianceBernstein $ 41.31 $ 12,037 $ 11,676 9.8 x 8.8 x 8.7 x Affiliated Managers 268.83 7,789 8,352 7.9 7.2 7.2 Artisan Partners 41.48 3,369 3,533 8.6 8.1 8.1 Blackrock 1,047.30 167,106 170,636 17.4 14.1 13.9 Franklin Resources 22.59 11,769 12,260 6.3 5.8 5.8 Invesco 24.45 11,178 14,821 9.1 7.6 7.5 T. Rowe Price 102.38 22,929 19,110 6.6 6.3 6.3 Victory 62.89 5,426 6,282 9.5 8.3 8.1 Virtus 159.59 1,132 1,237 4.6 4.6 4.6 TAM Peers 8.6 x 7.6 x 7.5 x Public Peer Trading Multiples Source: Company filings, FactSet. Note: Market data as of 28-Nov-2025. 1 Reflects Jewel data as of undisturbed date of 24-Oct-2025. Public Market Valuation ($ in millions, except share price) 1 |
| DRAFT Preliminary – Subject to Refinement Appendix B: Additional Financial Information |
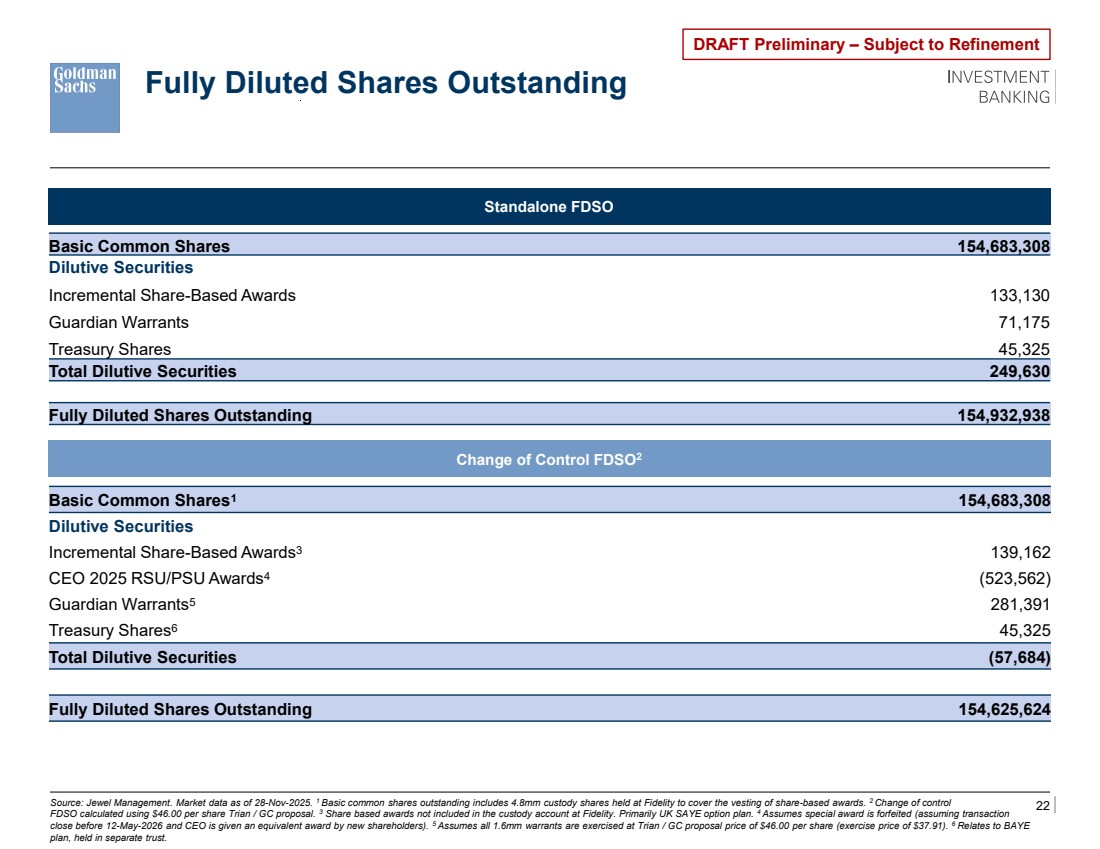
| 22 DRAFT Preliminary – Subject to Refinement Fully Diluted Shares Outstanding Source: Jewel Management. Market data as of 28-Nov-2025. 1 Basic common shares outstanding includes 4.8mm custody shares held at Fidelity to cover the vesting of share-based awards. 2 Change of control FDSO calculated using $46.00 per share Trian / GC proposal. 3 Share based awards not included in the custody account at Fidelity. Primarily UK SAYE option plan. 4 Assumes special award is forfeited (assuming transaction close before 12-May-2026 and CEO is given an equivalent award by new shareholders). 5 Assumes all 1.6mm warrants are exercised at Trian / GC proposal price of $46.00 per share (exercise price of $37.91). 6 Relates to BAYE plan, held in separate trust. Change of Control FDSO2 Standalone FDSO Basic Common Shares1 154,683,308 Dilutive Securities Incremental Share-Based Awards3 139,162 CEO 2025 RSU/PSU Awards4 (523,562) Guardian Warrants5 281,391 Treasury Shares6 45,325 Total Dilutive Securities (57,684) Fully Diluted Shares Outstanding 154,625,624 Basic Common Shares 154,683,308 Dilutive Securities Incremental Share-Based Awards 133,130 Guardian Warrants 71,175 Treasury Shares 45,325 Total Dilutive Securities 249,630 Fully Diluted Shares Outstanding 154,932,938 |
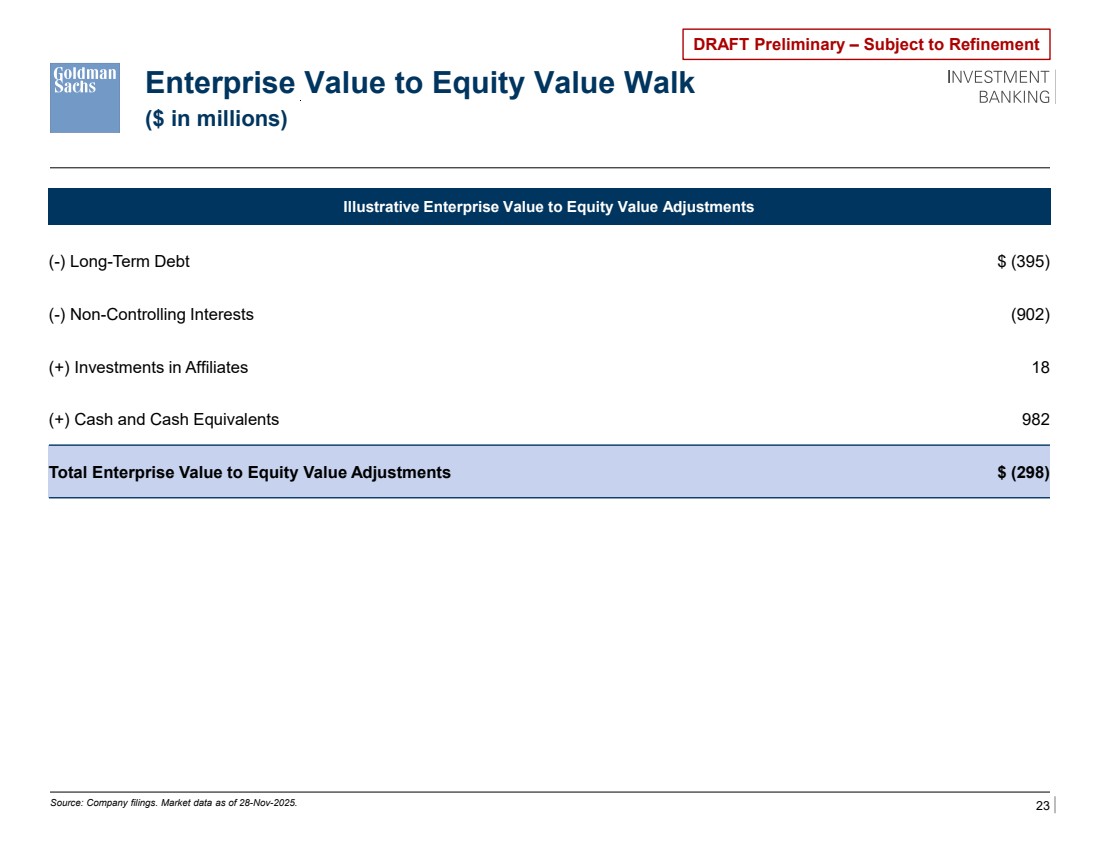
| 23 DRAFT Preliminary – Subject to Refinement Enterprise Value to Equity Value Walk Source: Company filings. Market data as of 28-Nov-2025. Illustrative Enterprise Value to Equity Value Adjustments (-) Long-Term Debt $ (395) (-) Non-Controlling Interests (902) (+) Investments in Affiliates 18 (+) Cash and Cash Equivalents 982 Total Enterprise Value to Equity Value Adjustments $ (298) ($ in millions) |
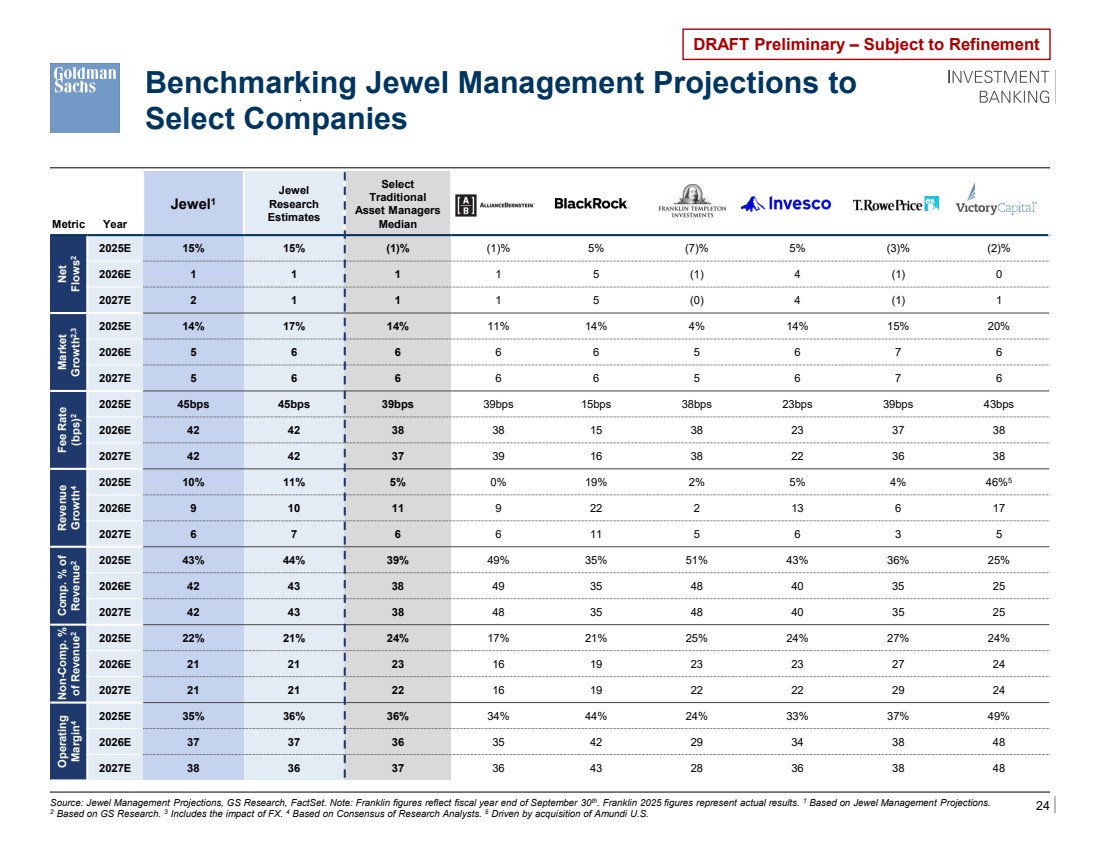
| 24 DRAFT Preliminary – Subject to Refinement Benchmarking Jewel Management Projections to Select Companies Metric Year Jewel1 Jewel Research Estimates Select Traditional Asset Managers Median Net Flows 2 2025E 15% 15% (1)% (1)% 5% (7)% 5% (3)% (2)% 2026E 1 1 1 1 5 (1) 4 (1) 0 2027E 2 1 1 1 5 (0) 4 (1) 1 Market Growth2,3 2025E 14% 17% 14% 11% 14% 4% 14% 15% 20% 2026E 5 6 6 6 6 5 6 7 6 2027E 5 6 6 6 6 5 6 7 6 Fee Rate (bps) 2 2025E 45bps 45bps 39bps 39bps 15bps 38bps 23bps 39bps 43bps 2026E 42 42 38 38 15 38 23 37 38 2027E 42 42 37 39 16 38 22 36 38 Revenue Growth4 2025E 10% 11% 5% 0% 19% 2% 5% 4% 46%5 2026E 9 10 11 9 22 2 13 6 17 2027E 6 7 6 6 11 5 6 3 5 Comp. % of Revenue 2 2025E 43% 44% 39% 49% 35% 51% 43% 36% 25% 2026E 42 43 38 49 35 48 40 35 25 2027E 42 43 38 48 35 48 40 35 25 Non-Comp. % of Revenue 2 2025E 22% 21% 24% 17% 21% 25% 24% 27% 24% 2026E 21 21 23 16 19 23 23 27 24 2027E 21 21 22 16 19 22 22 29 24 Operating Margin4 2025E 35% 36% 36% 34% 44% 24% 33% 37% 49% 2026E 37 37 36 35 42 29 34 38 48 2027E 38 36 37 36 43 28 36 38 48 Source: Jewel Management Projections, GS Research, FactSet. Note: Franklin figures reflect fiscal year end of September 30th. Franklin 2025 figures represent actual results. 1 Based on Jewel Management Projections. 2 Based on GS Research. 3 Includes the impact of FX. 4 Based on Consensus of Research Analysts. 5 Driven by acquisition of Amundi U.S. |