Pay vs Performance Disclosure - USD ($)
|
12 Months Ended |
Dec. 31, 2025 |
Dec. 31, 2024 |
Dec. 31, 2023 |
Dec. 31, 2022 |
| Pay vs Performance Disclosure |
|
|
|
|
| Pay vs Performance Disclosure, Table |
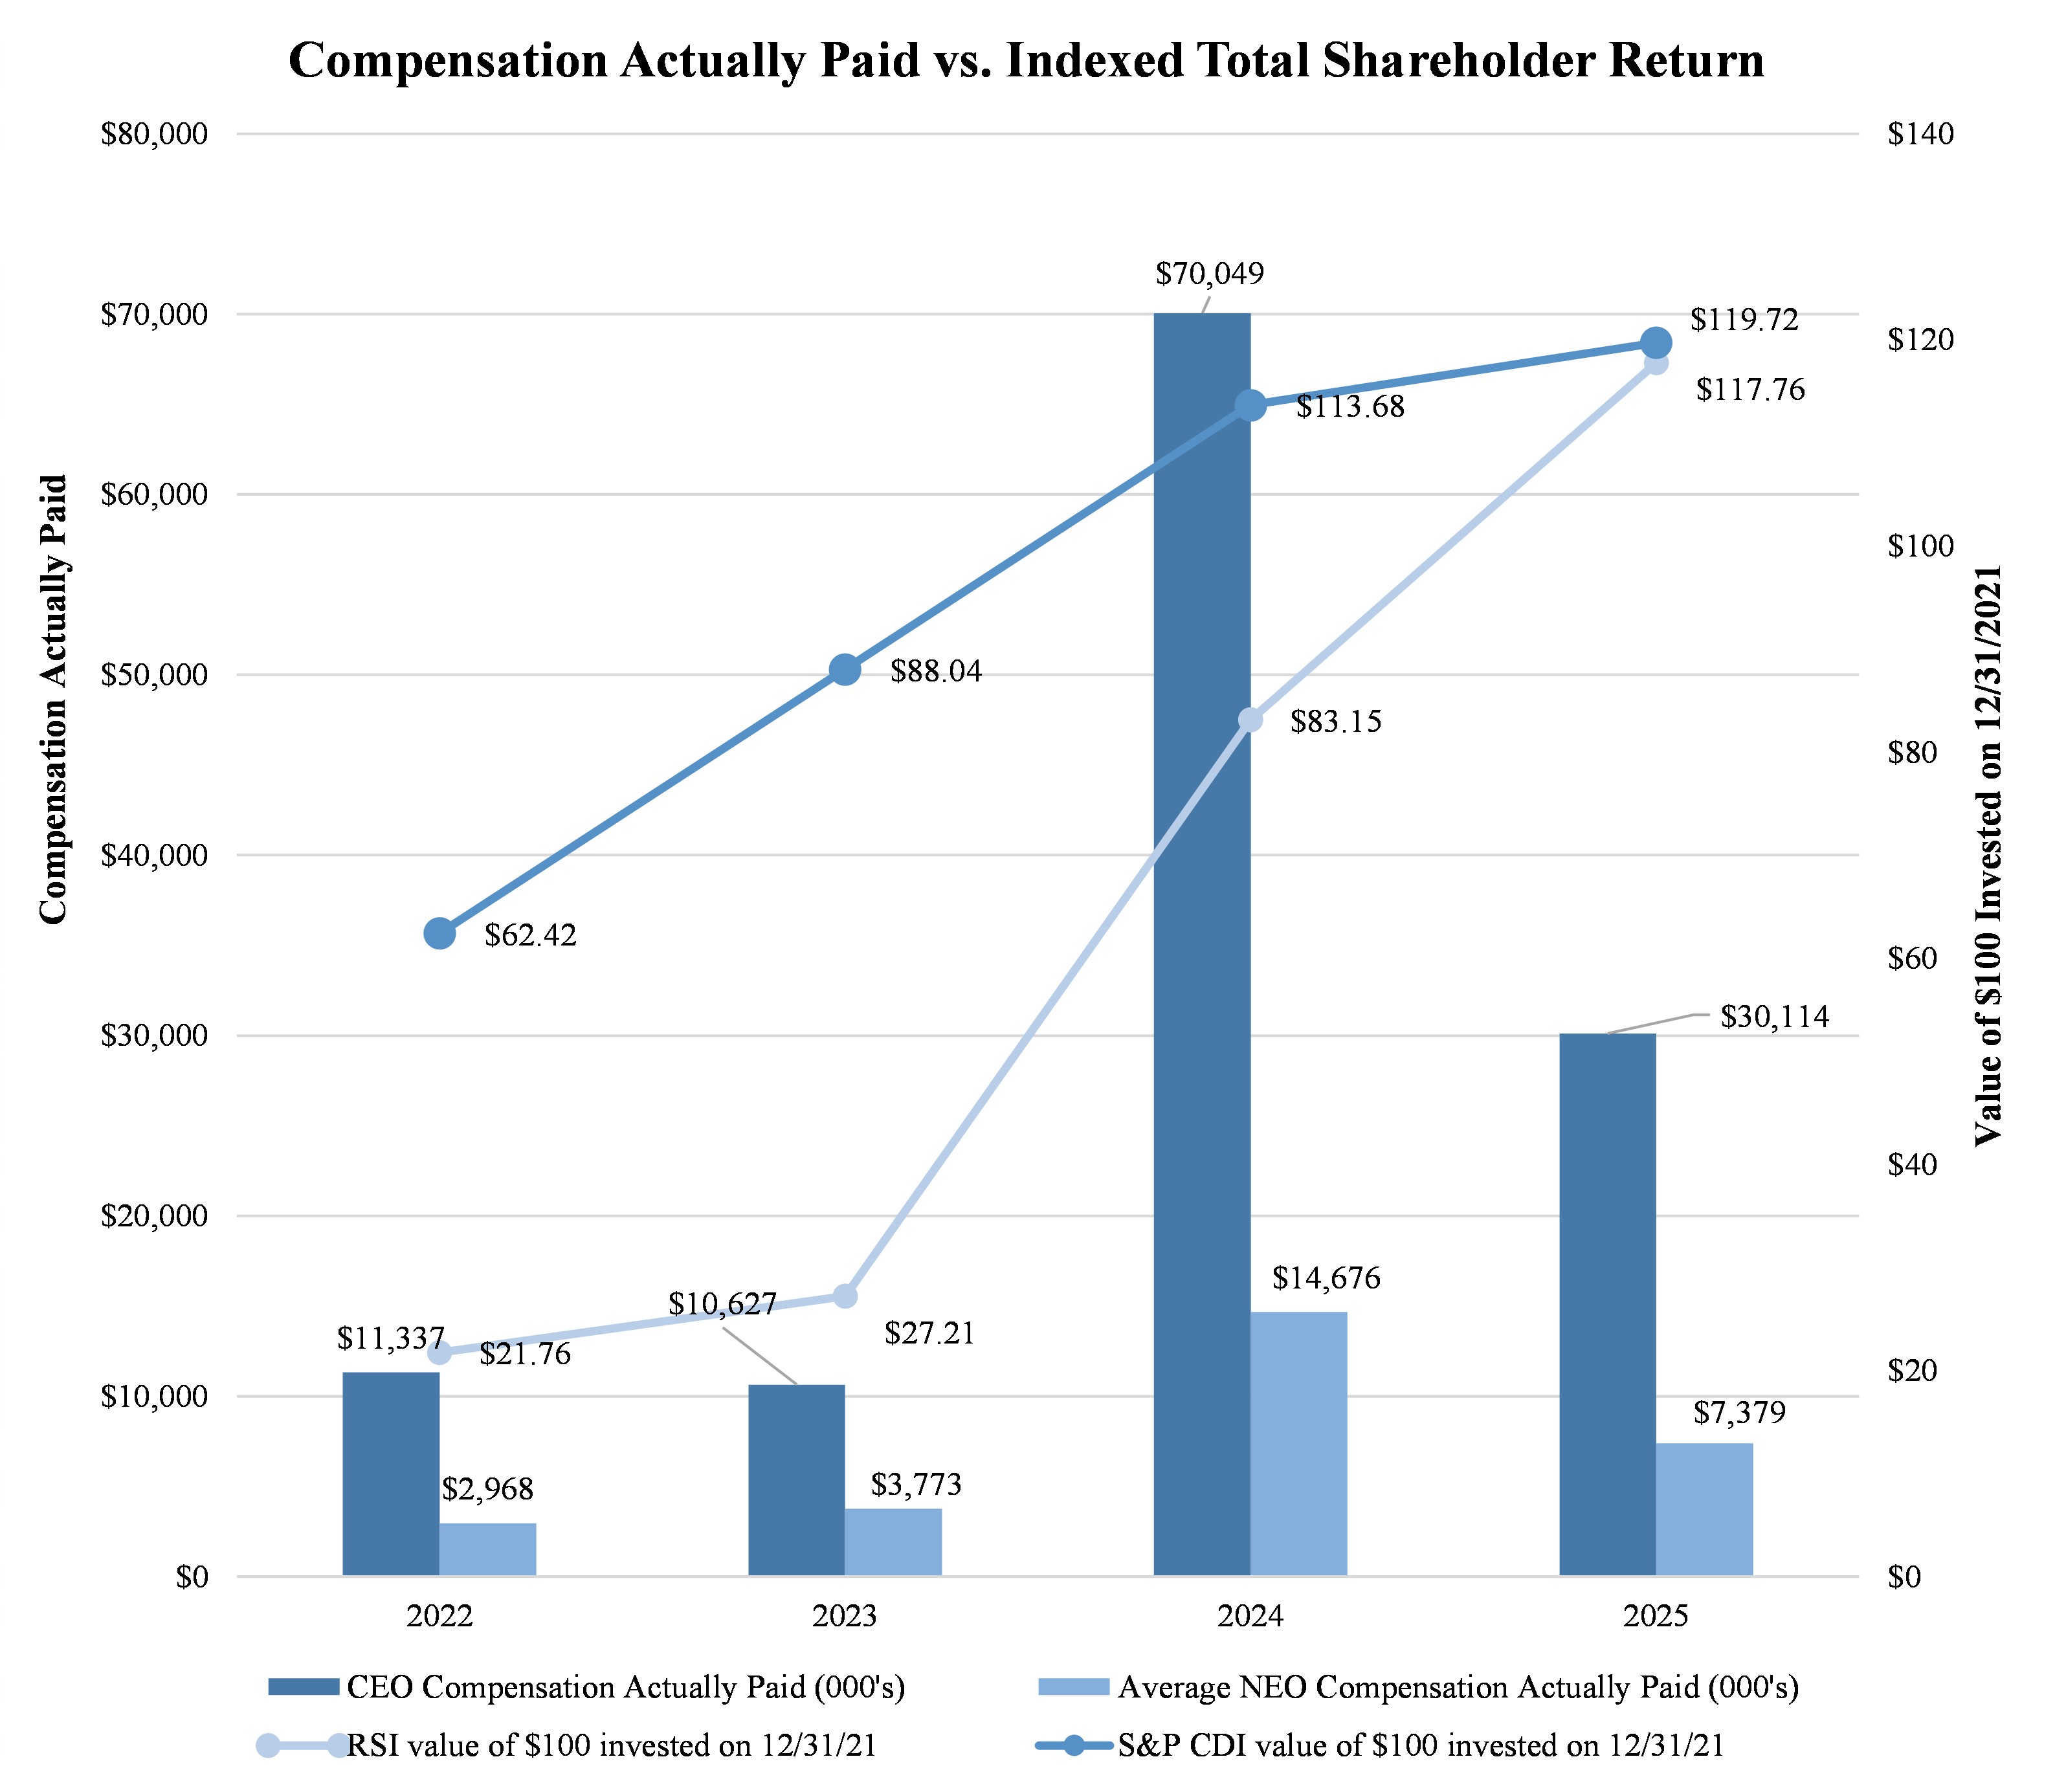
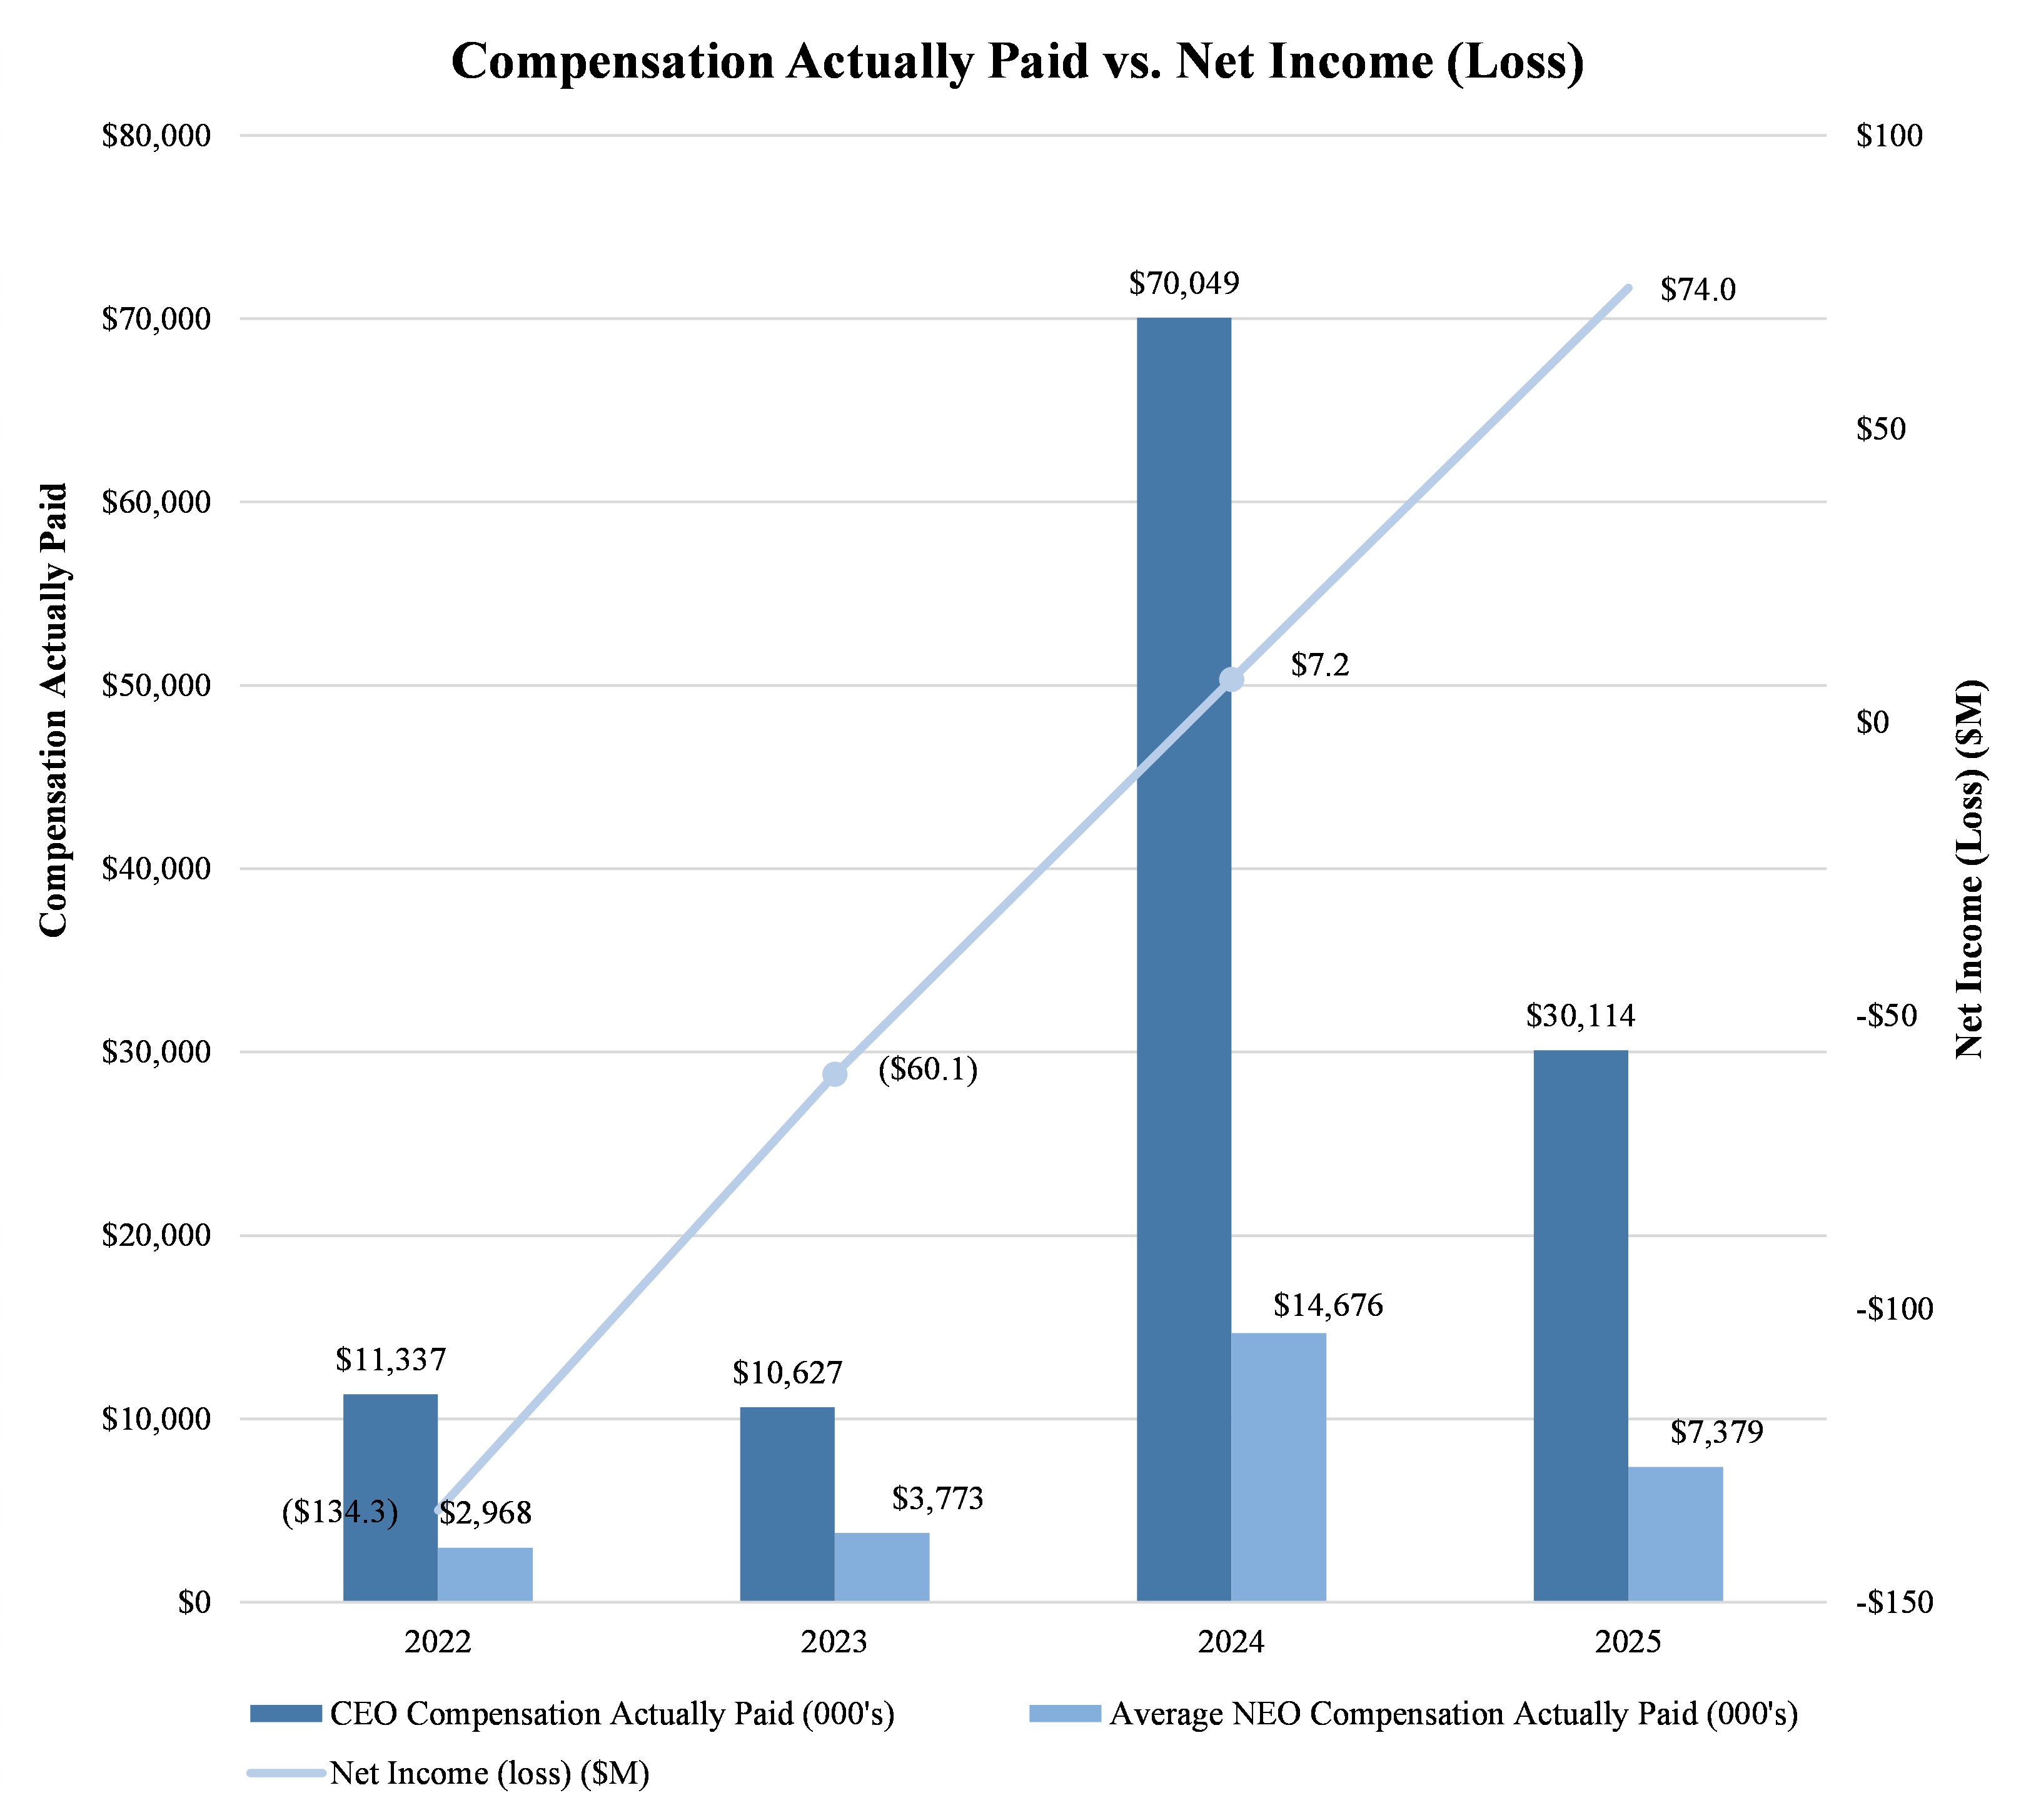
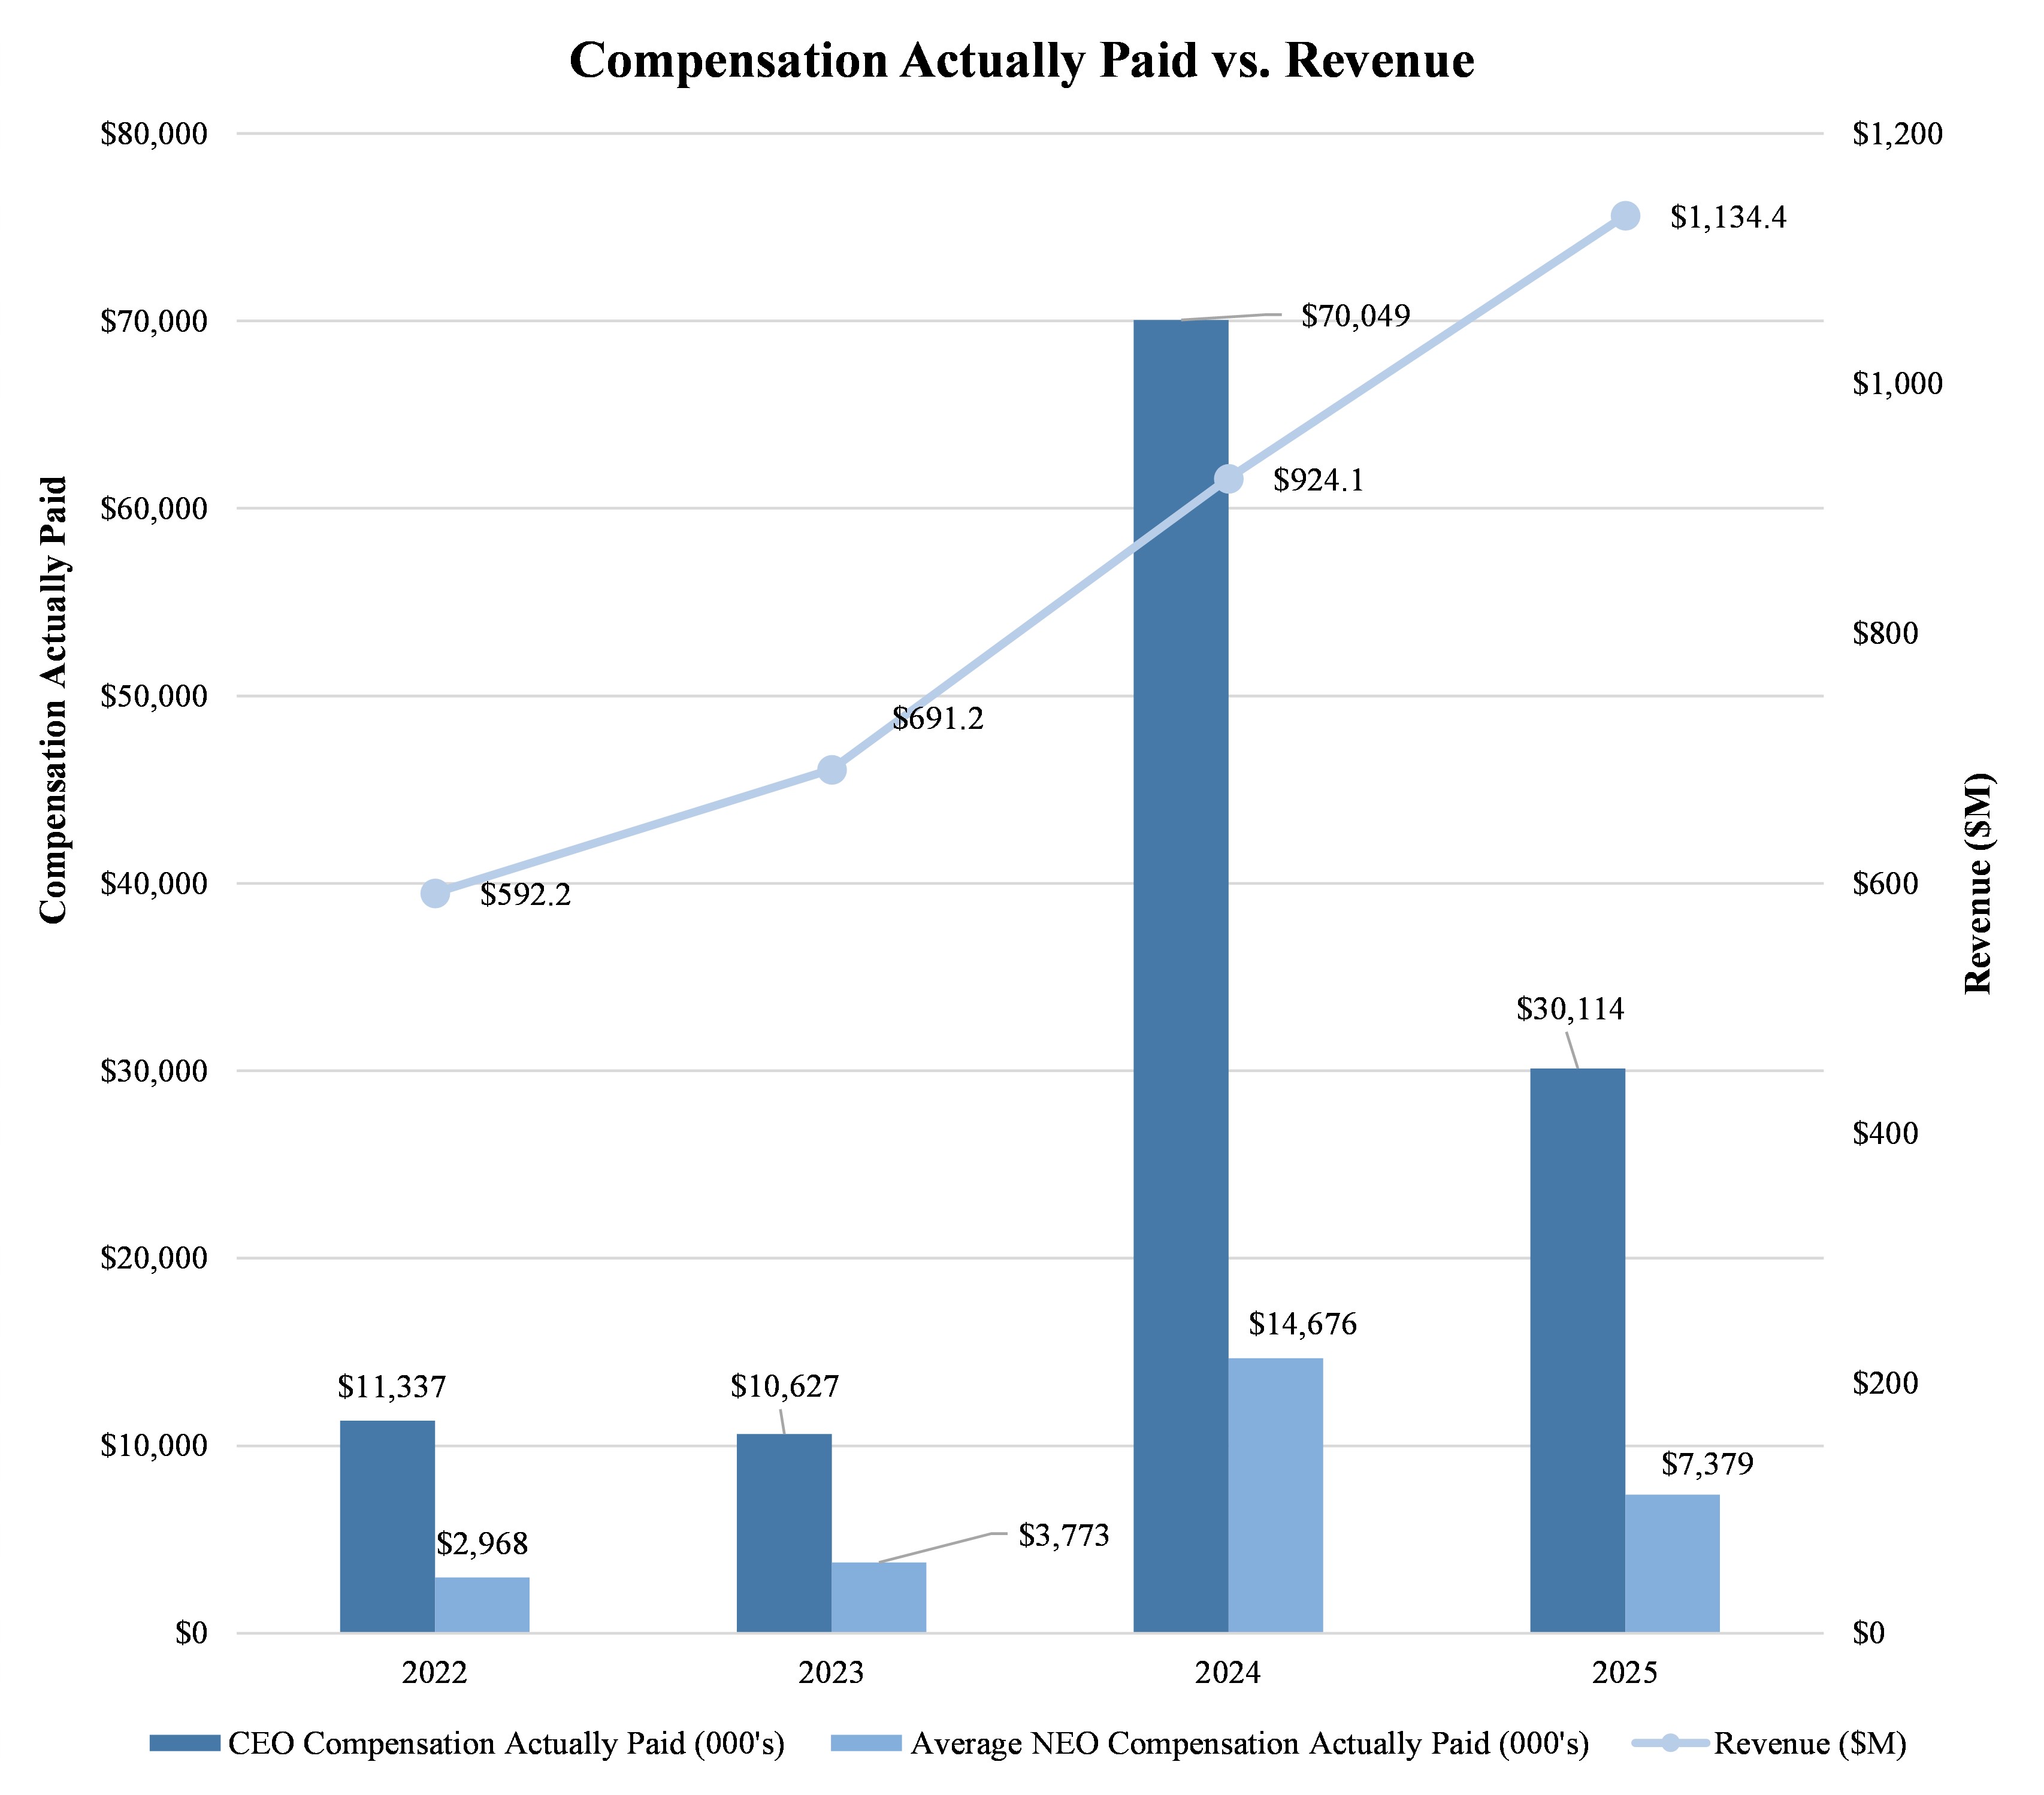
This section provides disclosure about the relationship between executive compensation actually paid to our principal executive officer (“PEO”) and Non-PEO Named Executive Officers and certain financial performance measures of the Company for the fiscal years listed below. This disclosure has been prepared in accordance with Item 402(v) of Regulation S-K under the Securities Exchange Act of 1934 (the “Pay Versus Performance Rules”) and does not necessarily reflect how the Compensation Committee evaluates compensation decisions. | | | | | | | | | | | | | | | | | | | | | | | | | | |
Year |
Summary Compensation Table Total for PEO(1) |
Compensation Actually Paid to PEO(2) | Average Summary Compensation Table Total for non-PEO Named Executive Officers(2) | Average Compensation Actually Paid to non-PEO Named Executive Officers(2) | Value of Initial Fix $100 Investment Based On: |
Net Income (Loss) (in thousands) | GAAP Revenue (in thousands) (4) | Total Stockholder Return of RSI | Peer Group Total Stockholder Return(3) | | 2025 | $ | 6,946,803 | | $ | 30,113,715 | | $ | 2,240,643 | | $ | 7,378,823 | | $ | 117.76 | | $ | 119.72 | | $ | 74.0 | | $ | 1,134.4 | | | 2024 | $ | 9,029,774 | | $ | 70,048,529 | | $ | 2,774,565 | | $ | 14,676,127 | | $ | 83.15 | | $ | 113.68 | | $ | 7.2 | | $ | 924.1 | | | 2023 | $ | 6,929,661 | | $ | 10,627,265 | | $ | 2,696,194 | | $ | 3,772,551 | | $ | 27.21 | | $ | 88.04 | | $ | (60.1) | | $ | 691.2 | | | 2022 | $ | 14,119,163 | | $ | 11,336,786 | | $ | 3,847,612 | | $ | 2,967,553 | | $ | 21.76 | | $ | 62.42 | | $ | (134.3) | | $ | 592.2 | |
|
|
|
|
| Company Selected Measure Name |
GAAP Revenue
|
|
|
|
| Named Executive Officers, Footnote |
The NEOs included in calculating this table in accordance with the Pay Versus Performance Rules comprised the following individuals as the Principal Executive Officer (“PEO”) and the remaining NEOs as the “non-PEO NEOs” for the years noted: (i) 2025, Richard Schwartz as the PEO and Kyle Sauers, Mattias Stetz, Paul Wierbicki and Neil Bluhm as the non-PEO NEOs, (ii) 2024, Richard Schwartz as the PEO and Kyle Sauers, Mattias Stetz, Einar Roosileht, and Paul Wierbicki as the non-PEO NEOs; (iii) 2023, Richard Schwartz as the PEO and Kyle Sauers and Mattias Stetz as the non-PEO NEOs; and (iv) 2022, Richard Schwartz as the PEO and Einar Roosileht and Mattias Stetz as the non-PEO NEOs.
|
|
|
|
| Peer Group Issuers, Footnote |
The Peer Group TSR set forth in this table utilizes the S&P 500 Consumer Discretionary Index, which we also utilize in the stock performance graph required by Item 201(e) of Regulation S-K included in our Annual Report for the year ended December 31, 2025. The comparison assumes $100 was invested for the period starting December 31, 2021, through the end of the listed year in the Company and in the S&P 500 Consumer Discretionary Index, respectively. Historical stock performance is not necessarily indicative of future stock performance.
|
|
|
|
| PEO Total Compensation Amount |
$ 6,946,803
|
$ 9,029,774
|
$ 6,929,661
|
$ 14,119,163
|
| PEO Actually Paid Compensation Amount |
$ 30,113,715
|
70,048,529
|
10,627,265
|
11,336,786
|
| Adjustment To PEO Compensation, Footnote |
The Pay Versus Performance Rules require that certain adjustments be made to the totals set forth in the Summary Compensation Table included in this Proxy Statement (the “Summary Compensation Table”) in order to determine “compensation actually paid” (“CAP”) for purposes of this Pay Versus Performance disclosure. “Compensation actually paid” does not represent cash and/or equity value transferred to the applicable NEO, but rather is a value calculated in accordance with the Pay Versus Performance Rules for purposes of this Pay Versus Performance disclosure. In general, “compensation actually paid” is calculated as total compensation set forth in the Summary Compensation Table, as adjusted to include the fair market value of equity awards as of December 31 of the applicable year or, if earlier, the vesting date (rather than the grant date). None of the NEOs received any awards that failed to meet the applicable vesting conditions during 2025, received any dividends or participated in a defined benefit plan and there have been no amendments to the exercise price of options, so the following table does not include an adjustment for such items. The below tables reflect the required adjustments to reconcile total compensation as set forth in the Summary Compensation Table to “Compensation actually paid” for purposes of this Pay Versus Performance disclosure. | | | | | | | | | | | | | | | | | | | | | | | | | | |
Year |
Total Compensation from Summary Compensation Table total for PEO |
Adjustment for grant date values in the Summary Compensation Table (a) | Year-end fair value of unvested awards granted in the current year (b) | Year-over-year difference of year-end fair values for unvested awards granted in prior years (c) | Fair values at vest date for awards granted and vested in current year (d) | Difference in fair values between prior year-end fair values and vest-date fair values for awards granted in prior years (e) |
Total Adjustments for Equity Awards | Compensation Actually Paid to PEO | | | 2025 | $ | 6,946,803 | | $ | (5,225,353) | | $ | 11,181,052 | | $ | 10,139,306 | | $ | 12,807,285 | | $ | (5,735,378) | | $ | 23,166,912 | | $ | 30,113,715 | | | 2024 | $ | 9,029,774 | | $ | (7,408,645) | | $ | 20,158,090 | | $ | 25,536,220 | | $ | 8,097,914 | | $ | 14,635,176 | | $ | 61,018,755 | | $ | 70,048,529 | | | 2023 | $ | 6,929,661 | | $ | (5,430,078) | | $ | 7,568,054 | | $ | 1,438,445 | | $ | — | | $ | 121,183 | | $ | 3,697,604 | | $ | 10,627,265 | | | 2022 | $ | 14,119,163 | | $ | (12,845,808) | | $ | 11,430,411 | | $ | (1,227,286) | | $ | — | | $ | (139,694) | | $ | (2,782,377) | | $ | 11,336,786 | |
|
|
|
|
| Non-PEO NEO Average Total Compensation Amount |
$ 2,240,643
|
2,774,565
|
2,696,194
|
3,847,612
|
| Non-PEO NEO Average Compensation Actually Paid Amount |
$ 7,378,823
|
14,676,127
|
3,772,551
|
2,967,553
|
| Adjustment to Non-PEO NEO Compensation Footnote |
| | | | | | | | | | | | | | | | | | | | | | | | | | |
Year | Total Average Compensation from Summary Compensation Table total for Non-PEO NEOs | Adjustment for grant date values in the Summary Compensation Table (a) | Year-end fair value of unvested awards granted in the current year (b) | Year-over-year difference of year-end fair values for unvested awards granted in prior years (c) | Fair values at vest date for awards granted and vested in current year (d) | Difference in fair values between prior year-end fair values and vest-date fair values for awards granted in prior years (e) | Total Adjustments for Equity Awards | Average Compensation Actually Paid to Non-PEO NEOs | | | 2025 | $ | 2,240,643 | | $ | (1,367,075) | | $ | 2,805,142 | | $ | 2,213,340 | | $ | 2,740,087 | | $ | (1,253,314) | | $ | 5,138,180 | | $ | 7,378,823 | | | 2024 | $ | 2,774,565 | | $ | (1,818,682) | | $ | 4,948,430 | | $ | 6,007,510 | | $ | 1,265,303 | | $ | 1,499,001 | | $ | 11,901,562 | | $ | 14,676,127 | | | 2023 | $ | 2,696,194 | | $ | (1,709,897) | | $ | 2,383,133 | | $ | 363,908 | | $ | — | | $ | 39,213 | | $ | 1,076,357 | | $ | 3,772,551 | | | 2022 | $ | 3,847,612 | | $ | (3,048,846) | | $ | 2,744,356 | | $ | (516,748) | | $ | — | | $ | (58,821) | | $ | (880,059) | | $ | 2,967,553 | |
(a) Deduction for the amounts reported in the “Stock Awards” and “Option Awards” columns of the Summary Compensation Table. (b) Increase in fair value, calculated in accordance with FASB ASC 718, as of the end of the reported fiscal year of equity awards granted in the reported fiscal year that were outstanding and unvested as of the end of the reported fiscal year. (c) Change in fair value, calculated in accordance with FASB ASC 718, as of the end of the reported fiscal year from the end of the prior fiscal year, of equity awards granted in prior years that are outstanding and unvested as of the end of the reported fiscal year. (d) Change in fair value, calculated in accordance with FASB ASC 718, as of the vesting date for awards that are granted and vest in the same reported fiscal year. (e) Change in fair value, calculated in accordance with FASB ASC 718, from the end of the prior fiscal year to the vesting date for awards granted in prior years that vest in the reported year.
|
|
|
|
| Compensation Actually Paid vs. Total Shareholder Return |
|
|
|
|
| Compensation Actually Paid vs. Net Income |
|
|
|
|
| Compensation Actually Paid vs. Company Selected Measure |
|
|
|
|
| Total Shareholder Return Vs Peer Group |
|
|
|
|
| Tabular List, Table |
Revenue •Adjusted EBITDA •Stock Price
|
|
|
|
| Total Shareholder Return Amount |
$ 117.76
|
83.15
|
27.21
|
21.76
|
| Peer Group Total Shareholder Return Amount |
119.72
|
113.68
|
88.04
|
62.42
|
| Net Income (Loss), Including Portion Attributable to Noncontrolling Interest |
$ 74,000.0
|
$ 7,200
|
$ (60,100)
|
$ (134,300)
|
| Company Selected Measure Amount |
1,134,400
|
924,100
|
691,200
|
592,200
|
| PEO Name |
Richard Schwartz
|
Richard Schwartz
|
Richard Schwartz
|
Richard Schwartz
|
| Additional 402(v) Disclosure |
For 2025 compensation decisions, the Company focused on achievement of GAAP Revenue growth, as well as other metrics such as Adjusted EBITDA, through highly effective customer acquisition, retention, engagement, and monetization, enabled by innovative product offerings and technology enhancements and cost base improvements across the Company’s operations. The Company determined consolidated GAAP Revenue to be the most important financial performance measure used to link Company performance to CAP to our PEO and Non-PEO NEOs in 2025.
|
|
|
|
| Measure:: 1 |
|
|
|
|
| Pay vs Performance Disclosure |
|
|
|
|
| Name |
Revenue
|
|
|
|
| Measure:: 2 |
|
|
|
|
| Pay vs Performance Disclosure |
|
|
|
|
| Name |
Adjusted EBITDA
|
|
|
|
| Measure:: 3 |
|
|
|
|
| Pay vs Performance Disclosure |
|
|
|
|
| Name |
Stock Price
|
|
|
|
| PEO |
|
|
|
|
| Pay vs Performance Disclosure |
|
|
|
|
| Adjustment to Compensation, Amount |
$ 23,166,912
|
$ 61,018,755
|
$ 3,697,604
|
$ (2,782,377)
|
| PEO | Aggregate Grant Date Fair Value of Equity Award Amounts Reported in Summary Compensation Table |
|
|
|
|
| Pay vs Performance Disclosure |
|
|
|
|
| Adjustment to Compensation, Amount |
(5,225,353)
|
(7,408,645)
|
(5,430,078)
|
(12,845,808)
|
| PEO | Year-end Fair Value of Equity Awards Granted in Covered Year that are Outstanding and Unvested |
|
|
|
|
| Pay vs Performance Disclosure |
|
|
|
|
| Adjustment to Compensation, Amount |
11,181,052
|
20,158,090
|
7,568,054
|
11,430,411
|
| PEO | Year-over-Year Change in Fair Value of Equity Awards Granted in Prior Years That are Outstanding and Unvested |
|
|
|
|
| Pay vs Performance Disclosure |
|
|
|
|
| Adjustment to Compensation, Amount |
10,139,306
|
25,536,220
|
1,438,445
|
(1,227,286)
|
| PEO | Vesting Date Fair Value of Equity Awards Granted and Vested in Covered Year |
|
|
|
|
| Pay vs Performance Disclosure |
|
|
|
|
| Adjustment to Compensation, Amount |
12,807,285
|
8,097,914
|
0
|
0
|
| PEO | Change in Fair Value as of Vesting Date of Prior Year Equity Awards Vested in Covered Year |
|
|
|
|
| Pay vs Performance Disclosure |
|
|
|
|
| Adjustment to Compensation, Amount |
(5,735,378)
|
14,635,176
|
121,183
|
(139,694)
|
| Non-PEO NEO |
|
|
|
|
| Pay vs Performance Disclosure |
|
|
|
|
| Adjustment to Compensation, Amount |
5,138,180
|
11,901,562
|
1,076,357
|
(880,059)
|
| Non-PEO NEO | Aggregate Grant Date Fair Value of Equity Award Amounts Reported in Summary Compensation Table |
|
|
|
|
| Pay vs Performance Disclosure |
|
|
|
|
| Adjustment to Compensation, Amount |
(1,367,075)
|
(1,818,682)
|
(1,709,897)
|
(3,048,846)
|
| Non-PEO NEO | Year-end Fair Value of Equity Awards Granted in Covered Year that are Outstanding and Unvested |
|
|
|
|
| Pay vs Performance Disclosure |
|
|
|
|
| Adjustment to Compensation, Amount |
2,805,142
|
4,948,430
|
2,383,133
|
2,744,356
|
| Non-PEO NEO | Year-over-Year Change in Fair Value of Equity Awards Granted in Prior Years That are Outstanding and Unvested |
|
|
|
|
| Pay vs Performance Disclosure |
|
|
|
|
| Adjustment to Compensation, Amount |
2,213,340
|
6,007,510
|
363,908
|
(516,748)
|
| Non-PEO NEO | Vesting Date Fair Value of Equity Awards Granted and Vested in Covered Year |
|
|
|
|
| Pay vs Performance Disclosure |
|
|
|
|
| Adjustment to Compensation, Amount |
2,740,087
|
1,265,303
|
0
|
0
|
| Non-PEO NEO | Change in Fair Value as of Vesting Date of Prior Year Equity Awards Vested in Covered Year |
|
|
|
|
| Pay vs Performance Disclosure |
|
|
|
|
| Adjustment to Compensation, Amount |
$ (1,253,314)
|
$ 1,499,001
|
$ 39,213
|
$ (58,821)
|