Pay vs Performance Disclosure
Dec. 31, 2025
USD ($)
Dec. 31, 2024
USD ($)
Dec. 31, 2023
USD ($)
Dec. 31, 2022
USD ($)
Dec. 31, 2021
USD ($)
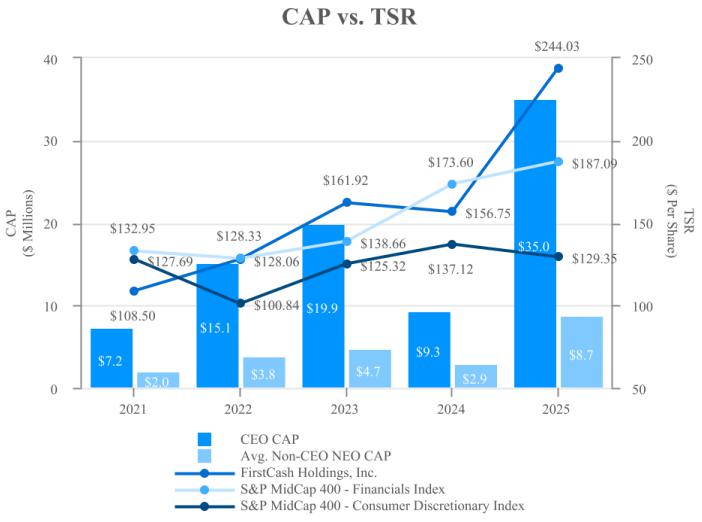
As required by SEC rules, the Company is providing the following information about the relationship between “compensation actually paid” (as computed in accordance with SEC rules) to its Principal Executive Officer (“PEO”) and to its other NEOs and certain financial performance of the Company for the five most recently completed fiscal years:
| Average | ||||||||||||||||||||||||||||||||
| Summary | Average | |||||||||||||||||||||||||||||||
| Compen- | Compen- | |||||||||||||||||||||||||||||||
| sation | sation | |||||||||||||||||||||||||||||||
| Summary | Table | Actually | Value of Initial Fixed $100 | |||||||||||||||||||||||||||||
| Compen- | Compen- | Total for | Paid to | Investment Based On: | ||||||||||||||||||||||||||||
| sation | sation | Non-PEO | Non-PEO | Peer Group | Adjusted | |||||||||||||||||||||||||||
| Table | Actually | Named | Named | Total | Total | Diluted | ||||||||||||||||||||||||||
| Total for | Paid to | Executive | Executive | Shareholder | Shareholder | Earnings | ||||||||||||||||||||||||||
| PEO (1) | PEO (2) | Officers (3) | Officers (2) | Return (4) | Return (4) | Net Income | Per Share (5) | |||||||||||||||||||||||||
| Year | ($) | ($) | ($) | ($) | ($) | ($) | ($) | ($) | ||||||||||||||||||||||||
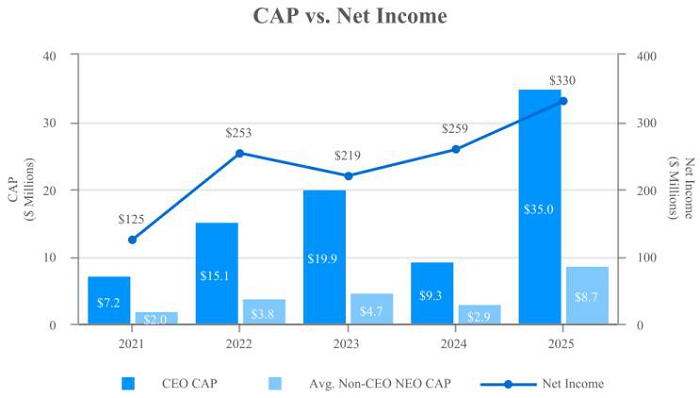
| 2025 | 15,658,761 | 34,997,098 | 4,360,492 | 8,722,755 | 244.03 | 187.09 | 330,375,000 | 8.76 | ||||||||||||||||||||||||
| 2024 | 12,069,657 | 9,287,053 | 3,579,331 | 2,882,113 | 156.75 | 173.60 | 258,815,000 | 6.70 | ||||||||||||||||||||||||
| 2023 | 12,256,895 | 19,930,731 | 3,574,925 | 4,683,793 | 161.92 | 138.66 | 219,301,000 | 6.06 | ||||||||||||||||||||||||
| 2022 | 9,836,835 | 15,114,505 | 2,834,198 | 3,793,799 | 128.06 | 128.33 | 253,495,000 | 5.19 | ||||||||||||||||||||||||
| 2021 | 7,175,467 | 7,215,249 | 2,014,574 | 1,972,295 | 108.50 | 132.95 | 124,909,000 | 3.94 | ||||||||||||||||||||||||
| (1) | Rick Wessel was the Company’s PEO in 2021, 2022, 2023, 2024 and 2025. |
| (2) | To calculate compensation actually paid (“CAP”), the following amounts were deducted from and added to SCT total compensation: |
| PEO | 2025 | 2024 | 2023 | 2022 | 2021 | |||||||||||||||
| SCT total compensation | $ | 15,658,761 | $ | 12,069,657 | $ | 12,256,895 | $ | 9,836,835 | $ | 7,175,467 | ||||||||||
| Less fair value of stock awards reported in the SCT | (9,706,654 | ) | (8,343,435 | ) | (7,016,337 | ) | (5,155,277 | ) | (3,453,904 | ) | ||||||||||
| Plus fair value as of year end of stock awards granted in current year | 16,104,233 | 6,853,347 | 9,361,536 | 8,103,054 | 5,177,226 | |||||||||||||||
| Change in fair value of stock awards granted in prior years that are outstanding and unvested as of year end | 6,796,115 | (903,943 | ) | 2,201,800 | 2,287,279 | 840,071 | ||||||||||||||
| Change in fair value of stock awards granted in prior years that vested during the current year | 6,144,643 | (388,573 | ) | 3,126,837 | 42,614 | (2,523,611 | ) | |||||||||||||
| CAP | $ | 34,997,098 | $ | 9,287,053 | $ | 19,930,731 | $ | 15,114,505 | $ | 7,215,249 | ||||||||||
| Average of Non-PEO NEO | 2025 | 2024 | 2023 | 2022 | 2021 | |||||||||||||||
| SCT total compensation | $ | 4,360,492 | $ | 3,579,331 | $ | 3,574,925 | $ | 2,834,198 | $ | 2,014,574 | ||||||||||
| Less fair value of stock awards reported in the SCT | (2,148,857 | ) | (1,882,974 | ) | (1,615,710 | ) | (1,161,314 | ) | (744,532 | ) | ||||||||||
| Plus fair value as of year end of stock awards granted in current year | 3,551,983 | 1,531,161 | 2,141,786 | 1,678,775 | 1,083,099 | |||||||||||||||
| Change in fair value of stock awards granted in prior years that are outstanding and unvested as of year end | 1,465,379 | (277,176 | ) | 568,670 | 443,809 | 156,478 | ||||||||||||||
| Change in fair value of stock awards granted in prior years that vested during the current year | 1,493,758 | (68,229 | ) | 14,122 | (1,669 | ) | (278,176 | ) | ||||||||||||
| Less fair value of stock awards forfeited during the current year | (259,148 | ) | ||||||||||||||||||
| CAP | $ | 8,722,755 | $ | 2,882,113 | $ | 4,683,793 | $ | 3,793,799 | $ | 1,972,295 | ||||||||||
| (3) | The non-PEO NEOs included in the averages are the following individuals for each of the years shown: |
| 2025 | 2024 | 2023 | 2022 | 2021 | ||||
| T. Brent Stuart | T. Brent Stuart | T. Brent Stuart | T. Brent Stuart | T. Brent Stuart | ||||
| R. Douglas Orr | R. Douglas Orr | R. Douglas Orr | R. Douglas Orr | R. Douglas Orr | ||||
| Howard F. Hambleton | Howard F. Hambleton | Howard F. Hambleton | Howard F. Hambleton (i) | Anna M. Alvarado (ii) | ||||
| Raul R. Ramos | Raul R. Ramos | Raul R. Ramos | Raul R. Ramos | Raul R. Ramos |
| (i) | Mr. Hambleton joined the Company in December 2021, in conjunction with the AFF acquisition, as the AFF president. |
| (ii) | Ms. Alvarado resigned from the Company effective October 8, 2021. |
| (4) | For the relevant year, represents the cumulative TSR of the Company and the S&P MidCap 400 – Financials Index from December 31, 2020 though the respective measurement periods ending on December 31 of 2025, 2024, 2023, 2022 and 2021. Each year reflects what the cumulative value of $100 would be, including the reinvestment of dividends, if such amount were invested on December 31, 2020. For purposes of reporting comparative stockholder returns per Item 201(e) of Regulation S-K under the Exchange Act in the Company’s Annual Report on Form 10-K for the year ended December 31, 2025, both the S&P MidCap 400 – Financials Index and the S&P MidCap 400 – Consumer Discretionary Index are used by the Company. Given that more than 50% of the Company’s earnings in 2025 were from consumer finance-related activities, the Company has elected to use the S&P MidCap 400 – Financials Index Returns as the peer group benchmark in this table. For informational purposes, the stockholder returns for the S&P MidCap 400 – Consumer Discretionary Index were $129.35, $137.12, $125.32, $100.84 and 127.69 for 2025, 2024, 2023, 2022 and 2021, respectively. |
| (5) | Non-GAAP financial measure. See detailed reconciliation of non-GAAP financial measures provided in Appendix G. |
| (1) | Rick Wessel was the Company’s PEO in 2021, 2022, 2023, 2024 and 2025. |
| (3) | The non-PEO NEOs included in the averages are the following individuals for each of the years shown: |
| 2025 | 2024 | 2023 | 2022 | 2021 | ||||
| T. Brent Stuart | T. Brent Stuart | T. Brent Stuart | T. Brent Stuart | T. Brent Stuart | ||||
| R. Douglas Orr | R. Douglas Orr | R. Douglas Orr | R. Douglas Orr | R. Douglas Orr | ||||
| Howard F. Hambleton | Howard F. Hambleton | Howard F. Hambleton | Howard F. Hambleton (i) | Anna M. Alvarado (ii) | ||||
| Raul R. Ramos | Raul R. Ramos | Raul R. Ramos | Raul R. Ramos | Raul R. Ramos |
| (i) | Mr. Hambleton joined the Company in December 2021, in conjunction with the AFF acquisition, as the AFF president. |
| (ii) | Ms. Alvarado resigned from the Company effective October 8, 2021. |
| (4) | For the relevant year, represents the cumulative TSR of the Company and the S&P MidCap 400 – Financials Index from December 31, 2020 though the respective measurement periods ending on December 31 of 2025, 2024, 2023, 2022 and 2021. Each year reflects what the cumulative value of $100 would be, including the reinvestment of dividends, if such amount were invested on December 31, 2020. For purposes of reporting comparative stockholder returns per Item 201(e) of Regulation S-K under the Exchange Act in the Company’s Annual Report on Form 10-K for the year ended December 31, 2025, both the S&P MidCap 400 – Financials Index and the S&P MidCap 400 – Consumer Discretionary Index are used by the Company. Given that more than 50% of the Company’s earnings in 2025 were from consumer finance-related activities, the Company has elected to use the S&P MidCap 400 – Financials Index Returns as the peer group benchmark in this table. For informational purposes, the stockholder returns for the S&P MidCap 400 – Consumer Discretionary Index were $129.35, $137.12, $125.32, $100.84 and 127.69 for 2025, 2024, 2023, 2022 and 2021, respectively. |
| (2) | To calculate compensation actually paid (“CAP”), the following amounts were deducted from and added to SCT total compensation: |
| PEO | 2025 | 2024 | 2023 | 2022 | 2021 | |||||||||||||||
| SCT total compensation | $ | 15,658,761 | $ | 12,069,657 | $ | 12,256,895 | $ | 9,836,835 | $ | 7,175,467 | ||||||||||
| Less fair value of stock awards reported in the SCT | (9,706,654 | ) | (8,343,435 | ) | (7,016,337 | ) | (5,155,277 | ) | (3,453,904 | ) | ||||||||||
| Plus fair value as of year end of stock awards granted in current year | 16,104,233 | 6,853,347 | 9,361,536 | 8,103,054 | 5,177,226 | |||||||||||||||
| Change in fair value of stock awards granted in prior years that are outstanding and unvested as of year end | 6,796,115 | (903,943 | ) | 2,201,800 | 2,287,279 | 840,071 | ||||||||||||||
| Change in fair value of stock awards granted in prior years that vested during the current year | 6,144,643 | (388,573 | ) | 3,126,837 | 42,614 | (2,523,611 | ) | |||||||||||||
| CAP | $ | 34,997,098 | $ | 9,287,053 | $ | 19,930,731 | $ | 15,114,505 | $ | 7,215,249 | ||||||||||
| (2) | To calculate compensation actually paid (“CAP”), the following amounts were deducted from and added to SCT total compensation: |
| Average of Non-PEO NEO | 2025 | 2024 | 2023 | 2022 | 2021 | |||||||||||||||
| SCT total compensation | $ | 4,360,492 | $ | 3,579,331 | $ | 3,574,925 | $ | 2,834,198 | $ | 2,014,574 | ||||||||||
| Less fair value of stock awards reported in the SCT | (2,148,857 | ) | (1,882,974 | ) | (1,615,710 | ) | (1,161,314 | ) | (744,532 | ) | ||||||||||
| Plus fair value as of year end of stock awards granted in current year | 3,551,983 | 1,531,161 | 2,141,786 | 1,678,775 | 1,083,099 | |||||||||||||||
| Change in fair value of stock awards granted in prior years that are outstanding and unvested as of year end | 1,465,379 | (277,176 | ) | 568,670 | 443,809 | 156,478 | ||||||||||||||
| Change in fair value of stock awards granted in prior years that vested during the current year | 1,493,758 | (68,229 | ) | 14,122 | (1,669 | ) | (278,176 | ) | ||||||||||||
| Less fair value of stock awards forfeited during the current year | (259,148 | ) | ||||||||||||||||||
| CAP | $ | 8,722,755 | $ | 2,882,113 | $ | 4,683,793 | $ | 3,793,799 | $ | 1,972,295 | ||||||||||
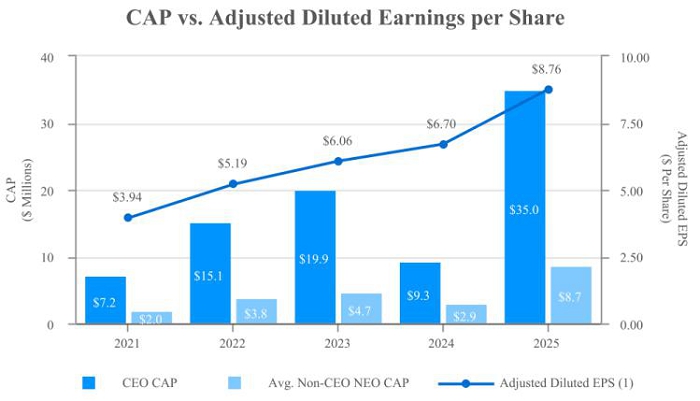
The following are the most important financial performance measures used by the Compensation Committee to link compensation actually paid to the Company’s NEOs with the Company’s performance. The role of each of these performance measures on the NEO compensation is further described in the “Compensation Discussion and Analysis” section above:
| ● | Adjusted diluted earnings per share |
| ● | Adjusted net income |
| ● | Adjusted EBITDA |
| ● | Net revenue (gross profit) |
| ● | TSR relative to compensation peers |
| (5) | Non-GAAP financial measure. See detailed reconciliation of non-GAAP financial measures provided in Appendix G. |