Pay vs Performance Disclosure
Dec. 31, 2025
USD ($)
$ / shares
shares
Dec. 31, 2024
USD ($)
$ / shares
shares
Dec. 31, 2023
USD ($)
$ / shares
Dec. 31, 2022
USD ($)
$ / shares
Dec. 31, 2021
USD ($)
$ / shares
shares
| Value of Initial Fixed $100 Investment Based on December 31, 2020 | ||||||||||||||||||||||||||
| Year | Summary Compensation Table Total for CEO (1)(5) | Compensation Actually Paid to CEO (1)(2) | Average Summary Compensation Table Total for non-CEO Named Executive Officers (3)(5) | Average Compensation Actually Paid to non-CEO Named Executive Officers (3) | Total Shareholder Return | Peer Group Total Shareholder Return(4) | Net Income (dollars in thousands) | Return on Average Assets | ||||||||||||||||||
| 2025 | $ | 1,693,201 | $ | 6,638,828 | $ | 1,361,768 | $ | 1,941,032 | $545.67 | $142.30 | $46,993 | 1.05% | ||||||||||||||
| 2024 | $ | 1,868,263 | $ | 9,612,332 | $ | 1,546,723 | $ | 3,764,753 | $404.33 | $134.22 | $45,219 | 1.15% | ||||||||||||||
| 2023 | $ | 2,003,785 | $ | 1,515,616 | $ | 700,546 | $ | 612,939 | $211.48 | $123.48 | $44,579 | 1.28% | ||||||||||||||
| 2022 | $ | 1,980,542 | $ | 1,454,819 | $ | 1,670,303 | $ | 2,092,317 | $226.29 | $106.40 | $40,625 | 1.38% | ||||||||||||||
| 2021 | $ | 4,514,200 | $ | 10,882,059 | $ | 647,199 | $ | 1,529,305 | $241.05 | $126.82 | $27,005 | 1.24% | ||||||||||||||
•2025: Brian T. Hamilton, Brandon J. Soto, Joel G. Edwards, Curt T. Queyrouze and Andrew G. Stines.
•2024: Brian T. Hamilton, Curt T. Queyrouze, Joel G. Edwards and Andrew G. Stines.
•2023: Curt T. Queyrouze, Joel G. Edwards, Russell A. Keithley and Andrew G. Stines.
•2022: Curt T. Queyrouze and Joel G. Edwards.
•2021: Joel G. Edwards and John J. Dickson.
The following table reconciles the Summary Compensation Table compensation to the Compensation Actually Paid disclosed in the above table for the periods indicated:
| 2025 | ||||||||||||||
| CEO | Non CEO NEOs | |||||||||||||
| Summary Compensation Table Total Compensation | $ | 1,693,201 | $ | 1,361,768 | ||||||||||
| - | Grant date fair value of stock awards granted in fiscal year | (375,069) | (687,039) | |||||||||||
| + | Fair value at fiscal year-end of outstanding and unvested awards granted in fiscal year | 483,455 | 804,261 | |||||||||||
| +/- | Change in fair value of outstanding and unvested stock awards granted in prior fiscal years | 4,813,948 | 272,836 | |||||||||||
| +/- | Change in fair value as of vesting date of stock awards granted in prior fiscal years for which applicable vesting conditions were satisfied during the fiscal year | 23,293 | 189,206 | |||||||||||
| Compensation Actually Paid | $ | 6,638,828 | $ | 1,941,032 | ||||||||||
| 2024 | ||||||||||||||
| CEO | Non CEO NEOs | |||||||||||||
| Summary Compensation Table Total Compensation | $ | 1,868,263 | $ | 1,546,723 | ||||||||||
| - | Grant date fair value of stock awards granted in fiscal year | (508,823) | (1,074,700) | |||||||||||
| + | Fair value at fiscal year-end of outstanding and unvested awards granted in fiscal year | 1,135,756 | 2,422,525 | |||||||||||
| +/- | Change in fair value of outstanding and unvested stock awards granted in prior fiscal years | 7,186,968 | 878,101 | |||||||||||
| +/- | Change in fair value as of vesting date of stock awards granted in prior fiscal years for which applicable vesting conditions were satisfied during the fiscal year | (69,832) | (7,895) | |||||||||||
| Compensation Actually Paid | $ | 9,612,332 | $ | 3,764,753 | ||||||||||
| 2023 | ||||||||||||||
| CEO | Non CEO NEOs | |||||||||||||
| Summary Compensation Table Total Compensation | $ | 2,003,785 | $ | 700,546 | ||||||||||
| - | Grant date fair value of stock awards granted in fiscal year | (726,125) | (155,276) | |||||||||||
| + | Fair value at fiscal year-end of outstanding and unvested awards granted in fiscal year | 743,024 | 162,363 | |||||||||||
| +/- | Change in fair value of outstanding and unvested stock awards granted in prior fiscal years | (412,899) | (73,254) | |||||||||||
| +/- | Change in fair value as of vesting date of stock awards granted in prior fiscal years for which applicable vesting conditions were satisfied during the fiscal year | (92,168) | (21,441) | |||||||||||
| Compensation Actually Paid | $ | 1,515,616 | $ | 612,939 | ||||||||||
| 2022 | ||||||||||||||
| CEO | Non CEO NEOs | |||||||||||||
| Summary Compensation Table Total Compensation | $ | 1,980,542 | $ | 1,670,303 | ||||||||||
| - | Grant date fair value of stock awards granted in fiscal year | (700,018) | $ | (1,018,414) | ||||||||||
| + | Fair value at fiscal year-end of outstanding and unvested awards granted in fiscal year | 676,115 | 1,501,680 | |||||||||||
| +/- | Change in fair value of outstanding and unvested stock awards granted in prior fiscal years | (287,971) | (42,047) | |||||||||||
| +/- | Change in fair value as of vesting date of stock awards granted in prior fiscal years for which applicable vesting conditions were satisfied during the fiscal year | (213,849) | (19,205) | |||||||||||
| Compensation Actually Paid | $ | 1,454,819 | $ | 2,092,317 | ||||||||||
| 2021 | ||||||||||||||
| CEO | Non CEO NEOs | |||||||||||||
| Summary Compensation Table Total Compensation | $ | 4,514,200 | $ | 647,199 | ||||||||||
| - | Grant date fair value of stock awards granted in fiscal year | (3,073,802) | $ | (107,007) | ||||||||||
| + | Fair value at fiscal year-end of outstanding and unvested awards granted in fiscal year | 5,825,299 | 259,048 | |||||||||||
| +/- | Change in fair value of outstanding and unvested stock awards granted in prior fiscal years | 3,450,049 | 695,774 | |||||||||||
| +/- | Change in fair value as of vesting date of stock awards granted in prior fiscal years for which applicable vesting conditions were satisfied during the fiscal year | 166,314 | 34,292 | |||||||||||
| Compensation Actually Paid | $ | 10,882,059 | $ | 1,529,305 | ||||||||||
•Core Deposit Growth
•Gross Loan Growth
•Net Charge-offs (for the community bank segment)
Changes in the Company’s stock price from period to period can have a material impact on the fair value amounts shown in the table above and, as a result, the Compensation Actually Paid from year to year may differ more dramatically. The following chart shows the Company’s stock price as of the dates indicated:
| 12/31/2025 | 12/31/2024 | 12/31/2023 | 12/31/2022 | 12/31/2021 | ||||||||||
| $ | 114.59 | $ | 84.91 | $ | 44.41 | $ | 47.52 | $ | 50.62 | |||||
Compensation Actually Paid to our CEO in 2021 was significantly impacted by the grant of 100,000 PSUs to further align his performance with shareholder returns and to retain his services. These PSUs cliff vest 6 years after the grant date if certain specified performance conditions are met. Average Compensation Actually Paid to Non-CEO NEOs in 2024 was significantly impacted by the grant of 75,000 PSUs to the President - CCBX to further align his performance with shareholder returns and to retain his services. These PSUs are eligible to vest at various quantities beginning October 1, 2024 through April 30, 2028 if certain specified performance conditions are met. Similarly, average Compensation Actually Paid to Non-CEO NEOs in 2025 was significantly impacted by the grant of 15,000 PSUs to the Chief Financial Officer to further align their performance with shareholder returns and to retain their services. These PSUs are eligible to vest over four years at various quantities if certain specified performance conditions are met. More information on these PSUs can be found in the “Executive Compensation” section of this proxy statement.
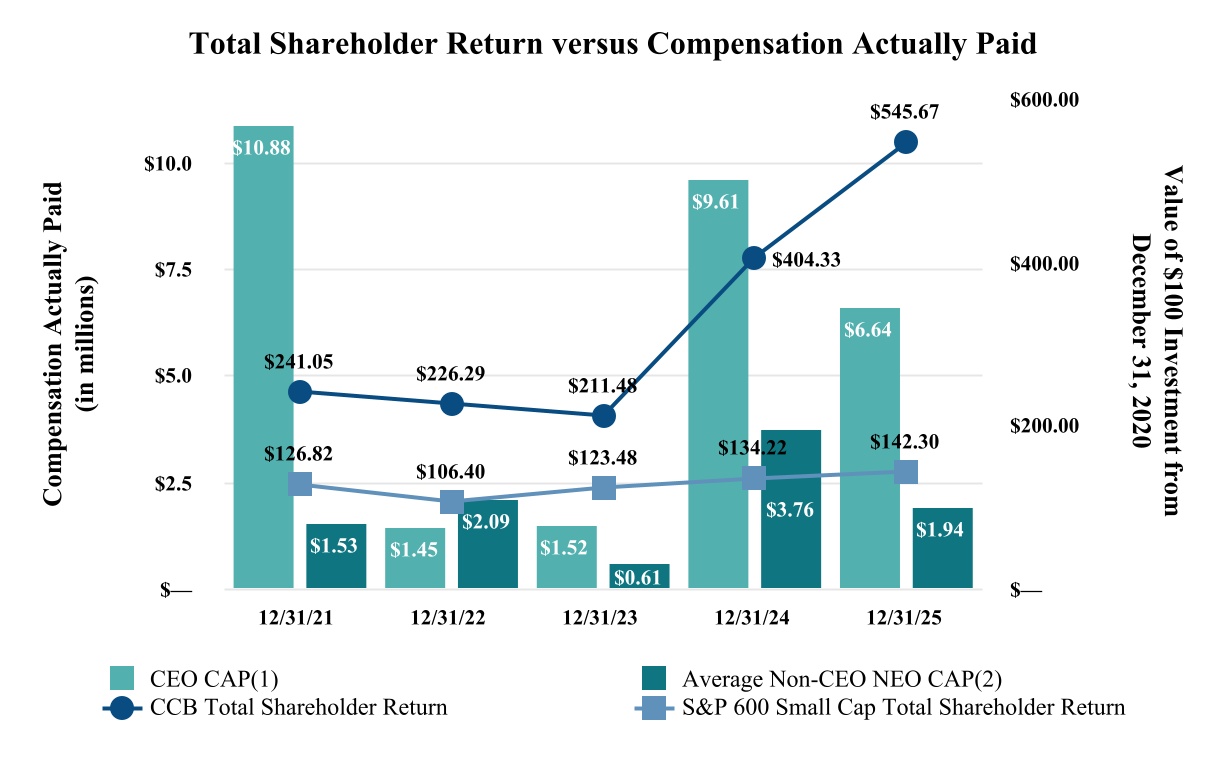
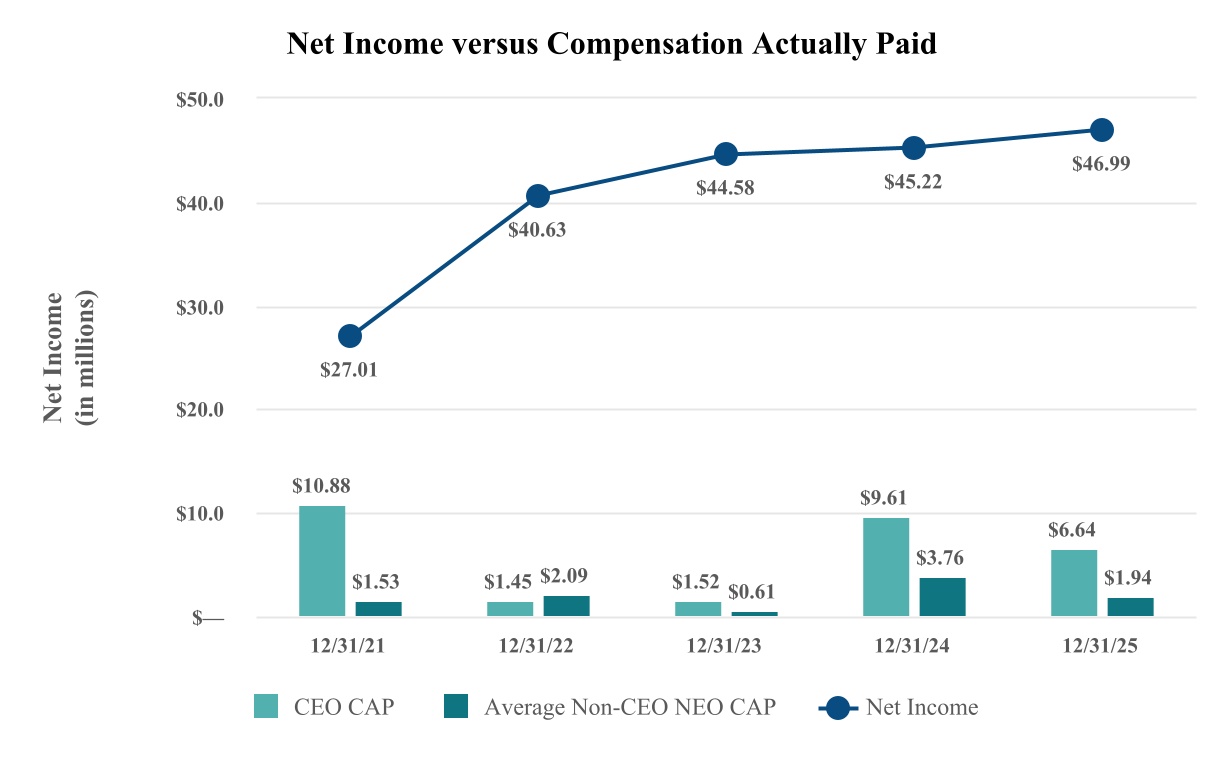
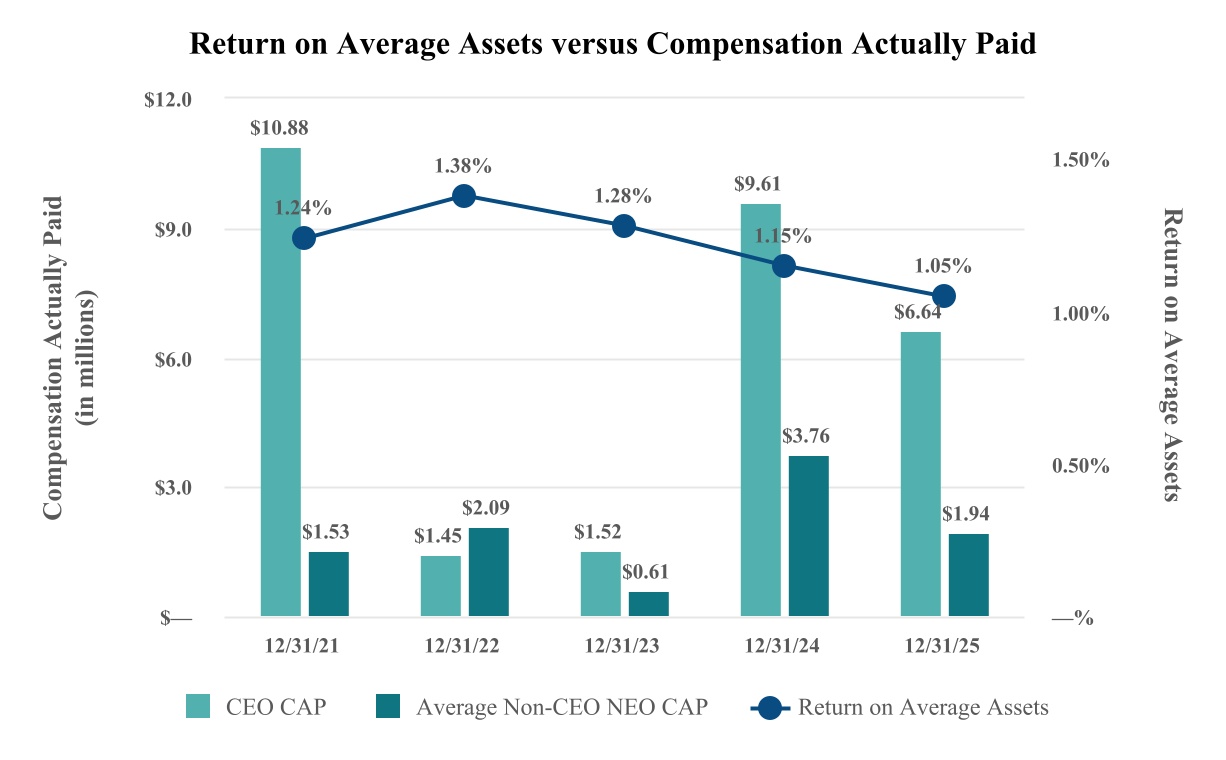
The illustrations below provide a graphical description of Compensation Actually Paid (“CAP”) (as calculated in accordance with SEC rules) and the following measures:
•the Company’s and the peer group total shareholder return (assuming an initial fixed investment of $100);
•the Company’s net income; and
•the Company’s selected measure, which is return on average assets.