Pay vs Performance Disclosure
|
12 Months Ended |
|
Dec. 31, 2025
USD ($)
$ / shares
|
Dec. 31, 2024
USD ($)
$ / shares
|
Dec. 31, 2023
USD ($)
$ / shares
|
Dec. 31, 2022
USD ($)
$ / shares
|
Dec. 31, 2021
USD ($)
$ / shares
|
| Pay vs Performance Disclosure |
|
|
|
|
|
| Pay vs Performance Disclosure, Table |
| | | | | | | | | | | | | | | | | | | | | | | | | | | | | | | | | | | | | | | | | | | | | | | | | | | | Year | | Total Compensation for CEO | | Compensation Actually Paid to CEO1 | | Average Total for Other NEOs | | Average Compensation Actually Paid to Other NEOs1 | | Value of $100 Initial Fixed Investment Based on TSR2 | | Value of $100 Initial Fixed Investment Based on 10‑K Peer Group TSR3 | | Net Income ($000's) | | Company Selected Measure - Core Earnings Per Share4 | | 2025 | | $ | 4,030,080 | | | $ | 4,237,640 | | | $ | 2,069,028 | | | $ | 2,058,569 | | | $135 | | $153 | | $ | 135,262 | | | $2.53 | | 2024 | | $ | 2,847,082 | | | $ | 2,431,467 | | | $ | 1,362,825 | | | $ | 1,196,424 | | | $128 | | $143 | | $ | 113,691 | | | $2.09 | | 2023 | | $ | 2,179,159 | | | $ | 2,542,829 | | | $ | 1,079,862 | | | $ | 674,115 | | | $130 | | $127 | | $ | 122,565 | | | $2.27 | | 2022 | | $ | 2,494,467 | | | $ | 2,234,208 | | | $ | 1,272,385 | | | $ | 1,162,227 | | | $124 | | $127 | | $ | 128,311 | | | $2.38 | | 2021 | | $ | 2,116,540 | | | $ | 3,053,103 | | | $ | 1,096,599 | | | $ | 1,630,556 | | | $131 | | $137 | | $ | 123,449 | | | $2.40 |
|
|
|
|
|
| Company Selected Measure Name |
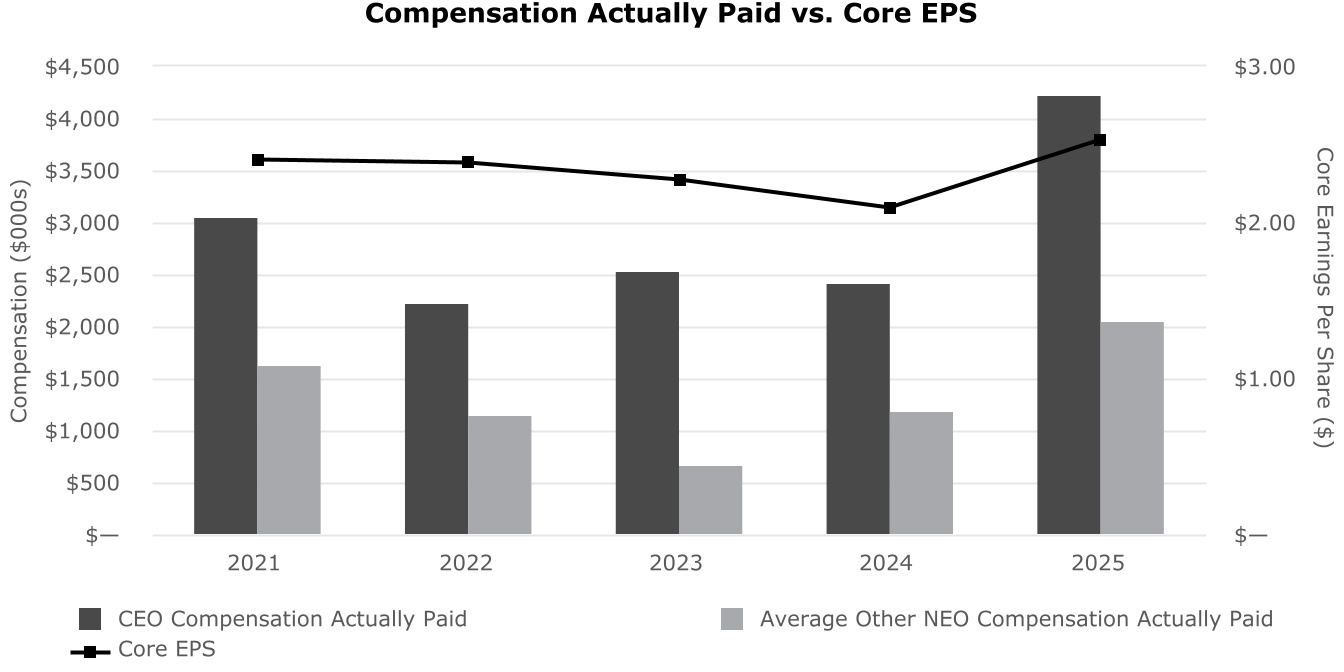
Core Earnings Per Share
|
|
|
|
|
| Peer Group Issuers, Footnote |
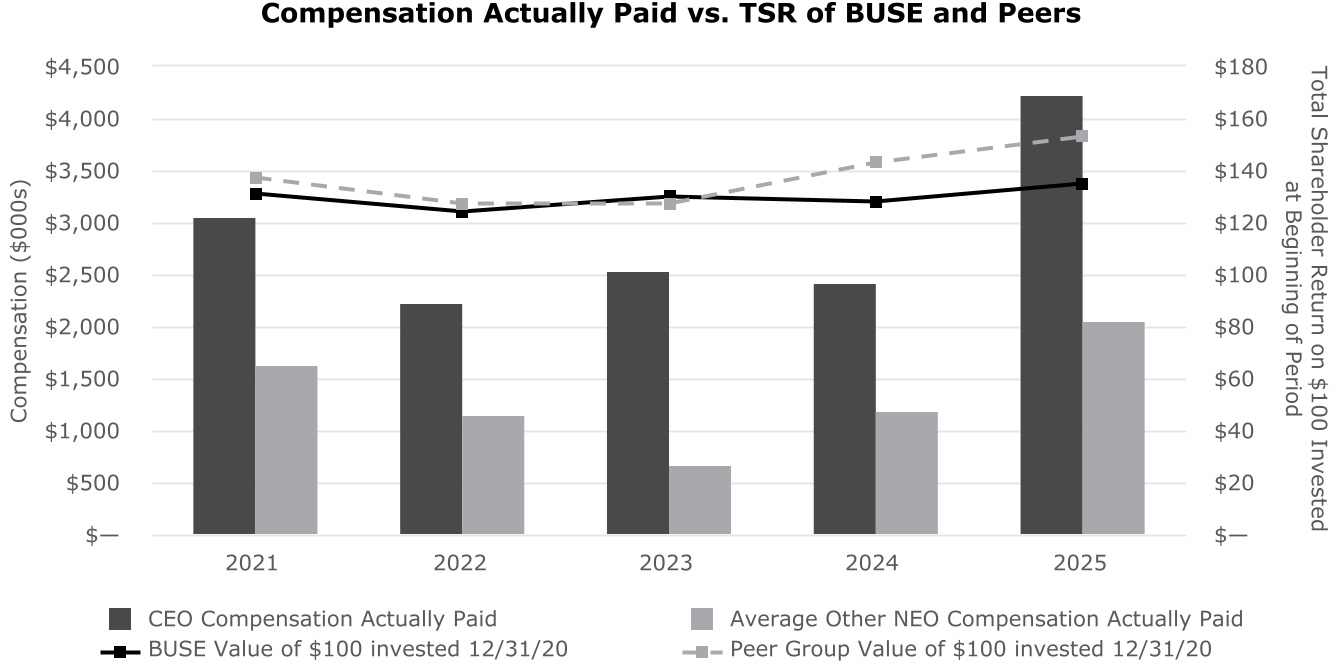
Based on initial investment of $100 as of December 31, 2020, and a cumulative Total Stockholder Return of First Busey and the KBW Nasdaq Regional Banking Index.
|
|
|
|
|
| PEO Total Compensation Amount |
$ 4,030,080
|
$ 2,847,082
|
$ 2,179,159
|
$ 2,494,467
|
$ 2,116,540
|
| PEO Actually Paid Compensation Amount |
$ 4,237,640
|
2,431,467
|
2,542,829
|
2,234,208
|
3,053,103
|
| Adjustment To PEO Compensation, Footnote |
Amounts represent executive compensation actually paid to our CEO and the average executive compensation actually paid to our NEOs for the relevant fiscal year. Executive compensation actually paid to our NEOs represents the “Total” compensation reported in the Summary Compensation Table for the applicable fiscal year, adjusted as follows: | | | | | | | | | | | 2025 | | Summary Compensation for CEO Van A. Dukeman | | $ | 4,030,080 | | | Deduction for amounts reported under the “Stock Awards” and “Option Awards” columns in the Summary Compensation Table | | $ | (1,939,686) | | | Addition for the fair value of equity awards granted and related dividend equivalents during the year that remain outstanding and unvested as of year-end | | $ | 1,972,105 | | | Addition for the change in fair value of awards granted in prior years that were unvested as of year-end and related dividend equivalents | | $ | 108,617 | | | Addition for the change in fair value of awards granted in prior years that vested during year and dividends paid | | $ | 66,524 | | | Compensation Actually Paid to CEO | | $ | 4,237,640 | | | | | | | 2025 | | Average Summary Compensation for NEOs | | $ | 2,069,028 | | | Deduction for amounts reported under the “Stock Awards” and “Option Awards” columns in the Summary Compensation Table | | $ | (571,264) | | | Addition for the fair value of equity awards granted and related dividend equivalents during the year that remain outstanding and unvested as of year-end | | $ | 854,029 | | | Addition for the change in fair value of awards granted in prior years that were unvested as of year-end and related dividend equivalents | | $ | 21,553 | | | Addition for the change in fair value of awards granted in prior years that vested during year and dividends paid | | $ | 12,066 | | | Addition for the change in fair value of awards that were forfeited during the year | | $ | (326,843) | | | Average Compensation Actually Paid to NEOs | | $ | 2,058,569 | | NEOs included in Average Summary Compensation and average compensation actually paid(a) | | | Christopher H.M. Chan Jeffrey D. Jones Scott A. Phillips Michael J. Maddox Amy L. Randolph Monica L. Bowe | | |
___________________________________________ (a)Robin N. Elliott was an NEO in 2021, 2022 and 2023 and was therefore included for those years. John J. Powers was an NEO in 2021, 2022, 2023 and 2024 and was therefore included for those years. Mr. Chan, Mr. Phillips and Mr. Maddox were not NEOs in 2021, 2022, 2023 or 2024 and were therefore not included for those years. Ms. Bowe was not an NEO in 2021 or 2022 and was therefore not included for those years.
|
|
|
|
|
| Non-PEO NEO Average Total Compensation Amount |
$ 2,069,028
|
1,362,825
|
1,079,862
|
1,272,385
|
1,096,599
|
| Non-PEO NEO Average Compensation Actually Paid Amount |
$ 2,058,569
|
1,196,424
|
674,115
|
1,162,227
|
1,630,556
|
| Adjustment to Non-PEO NEO Compensation Footnote |
Amounts represent executive compensation actually paid to our CEO and the average executive compensation actually paid to our NEOs for the relevant fiscal year. Executive compensation actually paid to our NEOs represents the “Total” compensation reported in the Summary Compensation Table for the applicable fiscal year, adjusted as follows: | | | | | | | | | | | 2025 | | Summary Compensation for CEO Van A. Dukeman | | $ | 4,030,080 | | | Deduction for amounts reported under the “Stock Awards” and “Option Awards” columns in the Summary Compensation Table | | $ | (1,939,686) | | | Addition for the fair value of equity awards granted and related dividend equivalents during the year that remain outstanding and unvested as of year-end | | $ | 1,972,105 | | | Addition for the change in fair value of awards granted in prior years that were unvested as of year-end and related dividend equivalents | | $ | 108,617 | | | Addition for the change in fair value of awards granted in prior years that vested during year and dividends paid | | $ | 66,524 | | | Compensation Actually Paid to CEO | | $ | 4,237,640 | | | | | | | 2025 | | Average Summary Compensation for NEOs | | $ | 2,069,028 | | | Deduction for amounts reported under the “Stock Awards” and “Option Awards” columns in the Summary Compensation Table | | $ | (571,264) | | | Addition for the fair value of equity awards granted and related dividend equivalents during the year that remain outstanding and unvested as of year-end | | $ | 854,029 | | | Addition for the change in fair value of awards granted in prior years that were unvested as of year-end and related dividend equivalents | | $ | 21,553 | | | Addition for the change in fair value of awards granted in prior years that vested during year and dividends paid | | $ | 12,066 | | | Addition for the change in fair value of awards that were forfeited during the year | | $ | (326,843) | | | Average Compensation Actually Paid to NEOs | | $ | 2,058,569 | | NEOs included in Average Summary Compensation and average compensation actually paid(a) | | | Christopher H.M. Chan Jeffrey D. Jones Scott A. Phillips Michael J. Maddox Amy L. Randolph Monica L. Bowe | | |
___________________________________________ (a)Robin N. Elliott was an NEO in 2021, 2022 and 2023 and was therefore included for those years. John J. Powers was an NEO in 2021, 2022, 2023 and 2024 and was therefore included for those years. Mr. Chan, Mr. Phillips and Mr. Maddox were not NEOs in 2021, 2022, 2023 or 2024 and were therefore not included for those years. Ms. Bowe was not an NEO in 2021 or 2022 and was therefore not included for those years.
|
|
|
|
|
| Compensation Actually Paid vs. Total Shareholder Return |
|
|
|
|
|
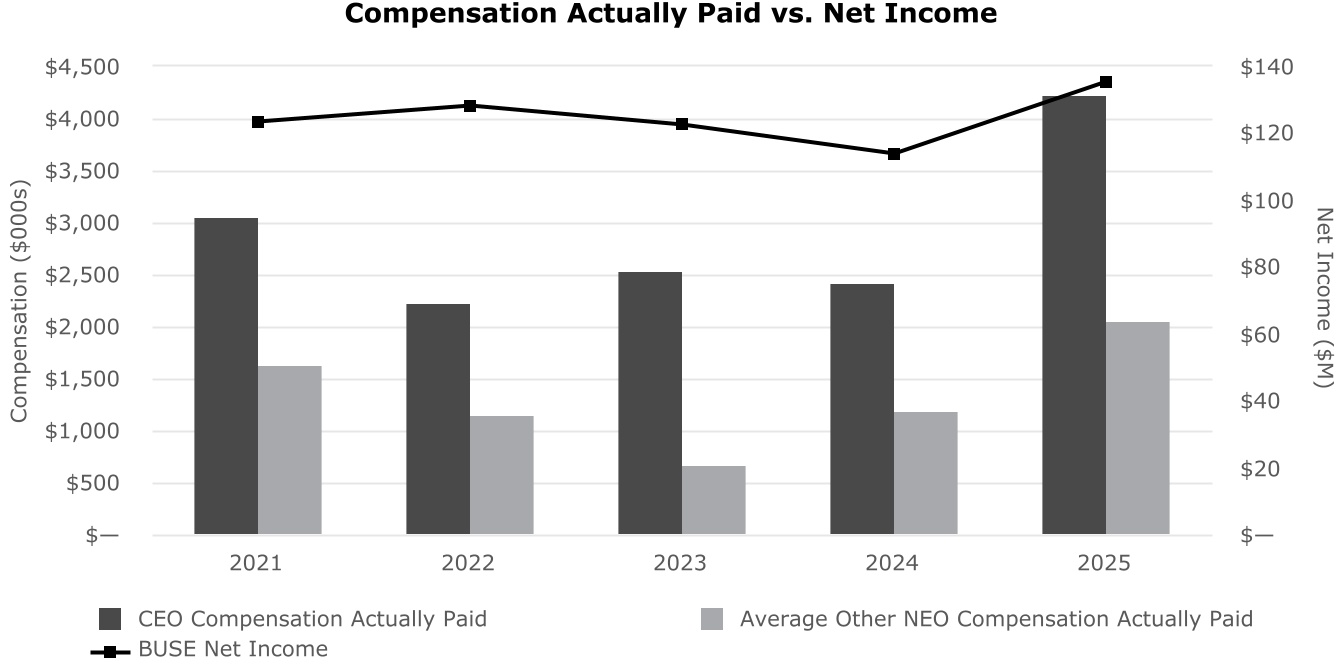
| Compensation Actually Paid vs. Net Income |
|
|
|
|
|
| Compensation Actually Paid vs. Company Selected Measure |
|
|
|
|
|
| Total Shareholder Return Vs Peer Group |
|
|
|
|
|
| Tabular List, Table |
Core Earnings Per Share •Asset Quality Ratio •Non-Bank Revenue (Fee Income) •Core Deposit Growth •Strategic Integration Goal •Relative Total Stockholder Return •Core Return on average Tangible Common Equity
|
|
|
|
|
| Total Shareholder Return Amount |
$ 135
|
128
|
130
|
124
|
131
|
| Peer Group Total Shareholder Return Amount |
153
|
143
|
127
|
127
|
137
|
| Net Income (Loss) |
$ 135,262,000
|
$ 113,691,000
|
$ 122,565,000
|
$ 128,311,000
|
$ 123,449,000
|
| Company Selected Measure Amount | $ / shares |
2.53
|
2.09
|
2.27
|
2.38
|
2.40
|
| Additional 402(v) Disclosure |
Based on initial investment of $100 as of December 31, 2020.
|
|
|
|
|
| Measure:: 1 |
|
|
|
|
|
| Pay vs Performance Disclosure |
|
|
|
|
|
| Name |
Core Earnings Per Share
|
|
|
|
|
| Non-GAAP Measure Description |
Core Earnings Per Share is the same as adjusted diluted earnings per share, a non-GAAP financial measure. Beginning in 2025, the Company revised its calculation of adjusted net income for all periods presented to include, as applicable, adjustments for net securities gains and losses, realized net gains and losses on the sale of mortgage servicing rights, and non-recurring deferred tax adjustments. Adjusted diluted earnings per share equals (i) the sum of (A) adjusted net income, plus (B) balance sheet repositioning, net securities (gains) losses, initial provision for credit losses, acquisition expenses, restructuring expenses and the tax benefit related to the foregoing, divided by (ii) the weighted average number of common shares outstanding on a diluted basis. For additional information on adjusted diluted earnings per share and a reconciliation to the most directly comparable GAAP financial measure, see the Company’s Annual Report on Form 10‑K for the year ended December 31, 2025 under the heading “Non-GAAP Financial Information.”
|
|
|
|
|
| Measure:: 2 |
|
|
|
|
|
| Pay vs Performance Disclosure |
|
|
|
|
|
| Name |
Asset Quality Ratio
|
|
|
|
|
| Measure:: 3 |
|
|
|
|
|
| Pay vs Performance Disclosure |
|
|
|
|
|
| Name |
Non-Bank Revenue (Fee Income)
|
|
|
|
|
| Measure:: 4 |
|
|
|
|
|
| Pay vs Performance Disclosure |
|
|
|
|
|
| Name |
Core Deposit Growth
|
|
|
|
|
| Measure:: 5 |
|
|
|
|
|
| Pay vs Performance Disclosure |
|
|
|
|
|
| Name |
Strategic Integration Goal
|
|
|
|
|
| Measure:: 6 |
|
|
|
|
|
| Pay vs Performance Disclosure |
|
|
|
|
|
| Name |
Relative Total Stockholder Return
|
|
|
|
|
| Measure:: 7 |
|
|
|
|
|
| Pay vs Performance Disclosure |
|
|
|
|
|
| Name |
Core Return on average Tangible Common Equity
|
|
|
|
|
| PEO | Aggregate Grant Date Fair Value of Equity Award Amounts Reported in Summary Compensation Table |
|
|
|
|
|
| Pay vs Performance Disclosure |
|
|
|
|
|
| Adjustment to Compensation, Amount |
$ (1,939,686)
|
|
|
|
|
| PEO | Year-end Fair Value of Equity Awards Granted in Covered Year that are Outstanding and Unvested |
|
|
|
|
|
| Pay vs Performance Disclosure |
|
|
|
|
|
| Adjustment to Compensation, Amount |
1,972,105
|
|
|
|
|
| PEO | Year-over-Year Change in Fair Value of Equity Awards Granted in Prior Years That are Outstanding and Unvested, And Dividends Paid on Equity Awards not Otherwise Reflected in Total Compensation [Member] |
|
|
|
|
|
| Pay vs Performance Disclosure |
|
|
|
|
|
| Adjustment to Compensation, Amount |
108,617
|
|
|
|
|
| PEO | Change in Fair Value as of Vesting Date of Prior Year Equity Awards Vested in Covered Year, And Dividends Paid on Equity Awards not Otherwise Reflected in Total Compensation [Member] |
|
|
|
|
|
| Pay vs Performance Disclosure |
|
|
|
|
|
| Adjustment to Compensation, Amount |
66,524
|
|
|
|
|
| Non-PEO NEO | Aggregate Grant Date Fair Value of Equity Award Amounts Reported in Summary Compensation Table |
|
|
|
|
|
| Pay vs Performance Disclosure |
|
|
|
|
|
| Adjustment to Compensation, Amount |
(571,264)
|
|
|
|
|
| Non-PEO NEO | Year-end Fair Value of Equity Awards Granted in Covered Year that are Outstanding and Unvested |
|
|
|
|
|
| Pay vs Performance Disclosure |
|
|
|
|
|
| Adjustment to Compensation, Amount |
854,029
|
|
|
|
|
| Non-PEO NEO | Prior Year End Fair Value of Equity Awards Granted in Any Prior Year that Fail to Meet Applicable Vesting Conditions During Covered Year |
|
|
|
|
|
| Pay vs Performance Disclosure |
|
|
|
|
|
| Adjustment to Compensation, Amount |
(326,843)
|
|
|
|
|
| Non-PEO NEO | Year-over-Year Change in Fair Value of Equity Awards Granted in Prior Years That are Outstanding and Unvested, And Dividends Paid on Equity Awards not Otherwise Reflected in Total Compensation [Member] |
|
|
|
|
|
| Pay vs Performance Disclosure |
|
|
|
|
|
| Adjustment to Compensation, Amount |
21,553
|
|
|
|
|
| Non-PEO NEO | Change in Fair Value as of Vesting Date of Prior Year Equity Awards Vested in Covered Year, And Dividends Paid on Equity Awards not Otherwise Reflected in Total Compensation [Member] |
|
|
|
|
|
| Pay vs Performance Disclosure |
|
|
|
|
|
| Adjustment to Compensation, Amount |
$ 12,066
|
|
|
|
|